

In the visual abstract, the colors for risk score 1 and risk score 2 in the legend were reversed. Risk score 1 should be green, and risk score 2 should be blue.
Page 3928: In Figure 5G, the colors of the curves representing risk score 1 and risk score 2 were reversed. The curve on the left should be blue, and the curve in the center should be green. The corrected visual abstract and Figure 5G are shown below.
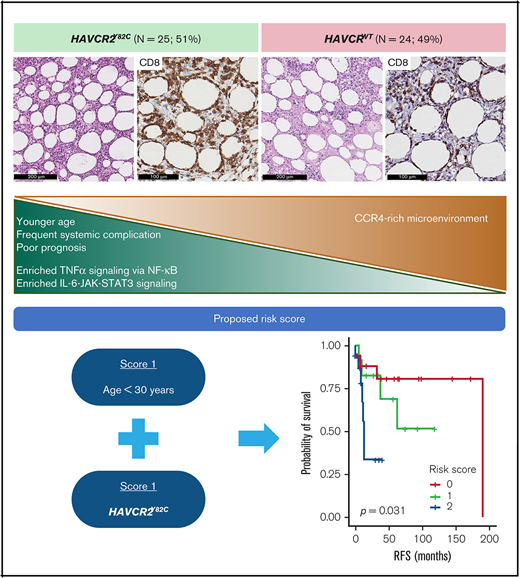
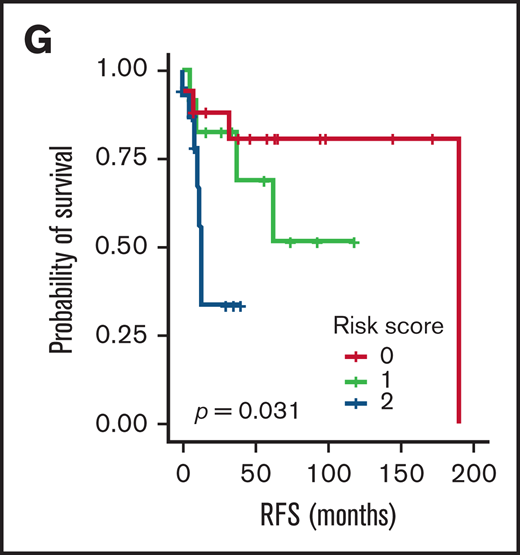
The publisher apologizes for the errors, which have been corrected in the published article.

