

Key Points
ATG4A regulates terminal erythroid maturation.
ATG4A promotes autophagosome maturation and mitochondrial clearance.

Abstract
Autophagy is a self-degradation pathway that is essential for erythropoiesis. During erythroid differentiation, autophagy facilitates the degradation of macromolecules and the programmed clearance of mitochondria. Impaired mitochondrial clearance results in anemia and alters the lifespan of red blood cells in vivo. While several essential autophagy genes contribute to autophagy in erythropoiesis, little is known about erythroid-specific mediators of this pathway. Genetic analysis of primary human erythroid and nonerythroid cells revealed the selective upregulation of the core autophagy gene ATG4A in maturing human erythroid cells. Because the function of ATG4A in erythropoiesis is unknown, we evaluated its role using an ex vivo model of human erythropoiesis. Depletion of ATG4A in primary human hematopoietic stem and progenitor cells selectively impaired erythroid but not myeloid lineage differentiation, resulting in reduced red cell production, delayed terminal differentiation, and impaired enucleation. Loss of ATG4A impaired autophagy and mitochondrial clearance, giving rise to reticulocytes with retained mitochondria and autophagic vesicles. In summary, our study identifies ATG4A as a cell type–specific regulator of autophagy in erythroid development.
Introduction
Two million red blood cells (RBCs) are produced each second in healthy human adults through the regulated differentiation of hematopoietic stem and progenitor cells (HSPCs).1,2 Mature RBCs are devoid of organelles and contain trillions of molecules of hemoglobin for oxygen transport.3 During the terminal differentiation of erythroblasts, all organelles, including the nucleus, are eliminated.3 Impaired organelle clearance results in anemia and altered RBC lifespan and is associated with myelodysplastic syndromes.4-6
The molecular mechanisms that underlie organelle clearance in erythropoiesis are not well understood; however, the degradative pathway of autophagy contributes to the elimination of mitochondria and ribosomes.3,7 In erythroid cells, autophagosomes (autophagic vesicles) are abundant in maturing erythroblasts and reticulocytes.8 Autophagosomes are formed de novo to encapsulate selective cytoplasmic macromolecules and organelles for degradation.9,10 Landmark studies in yeast identified 16 autophagy-related genes (ATGs) required for autophagosome formation.11 Studies in genetically modified mice have determined that the genes Atg7, Fip200, Ulk1(Atg1), and Bnip3l contribute to autophagy-dependent mitochondrial clearance during erythropoiesis.4,5,12 -14 However, it has also been shown that mitochondrial clearance does not solely depend on the canonical Atg5 and Atg7 pathways, suggesting the role of essential ATG proteins in erythropoiesis is complex.11,15-17
The study of autophagy from yeast to humans has revealed critical species-specific roles of essential ATG genes.18,19 While murine models have provided crucial insight into the role and requirement of autophagy for erythroid differentiation, fundamental differences exist between human and murine erythropoiesis.20 Genetic analysis of primary human erythroid cells has identified the upregulation of a novel set of autophagy genes late in erythroid maturation, including ATG9, ATG4, and ATG2.21 ATG4 is a cysteine protease essential for autophagy.22 In mammals, there are 4 ATG4 paralogs: ATG4A, ATG4B, ATG4C, and ATG4D.22 In human erythroid cells, expression of ATG4B remains constant throughout differentiation whereas the expression of ATG4A and ATG4D increases during the terminal stages of maturation.8 Expression of dominant-negative mutants for ATG4B and ATG4D in human HSPCs does not affect erythroid differentiation whereas the functions of ATG4A and ATG4C are unknown.8 We have identified an essential role for ATG4A in human erythroid differentiation and organelle clearance using primary human cells.
Methods
Lentiviral autophagy reporters
The TRC cloning vector pLKO.1 was used to generate the lentiviral LC3B and MT-Keima reporter constructs. pLKO.1 cloning vector was a gift from David Root (Addgene plasmid #10878). Fusion proteins of GFP-mCherry-LC3B23 and MT-Keima (gift from Steven Chan, University of Toronto) were generated by gene synthesis and inserted downstream of the PGK promoter in place of the puromycin gene into pLKO.1 to generate the reporter constructs. ATG4 short hairpin RNAs (shRNAs) were selected from the Sigma TRC library, synthesized as complementary oligonucleotides, annealed, and cloned downstream of the U6 promoter.
Hematopoietic cell transduction
Cord blood–derived CD34+ HSPCs were thawed and prestimulated in cord blood (CB) media: X-VIVO (Lonza) + 1% bovine serum albumin + L-glutamine (2 mM) and cytokines: stem cell factor (SCF) (100 ng/mL), fms-related tyrosine kinase 3 ligand (100 ng/mL), thrombopoietin (50 ng/mL), and interleukin (IL)-6 (20 ng/mL) (all Peprotech) for 4 hours prior to lentiviral infection. CB CD34+ cells were transduced with lentivirus for 16 to 18 hours at 37°C using a multiplicity of infection 50 in a 96-well plate precoated with Retronectin (Takara) (10 μg/cm2). Cells were washed and returned to CB media for 48 hours in a 24-well plate. After 48 hours, the cells were stained and sorted for transduced fluorescent proteins and CD34 on a BD Aria III equipped with a 70-μm nozzle. After sorting, CD34+ cells were placed in serum-free expansion media for 3 days: SFEM (Stem Cell Technologies) supplemented with fms-related tyrosine kinase 3 ligand (100 ng/mL), SCF (100 ng/mL), IL-3 (5 ng/mL), and IL-6 (20 ng/mL).
Ex vivo erythroid differentiation
Erythroid differentiation was performed as described using the timed addition of hematopoietic cytokines to erythroid differentiation media (EDM): Iscove Modified Dulbecco's Media + L-glutamine (2 mM) + 1% bovine serum albumin + holo-transferrin (500 µg/mL) + recombinant human insulin (10 µg/mL).24 After expansion for 3 days, ex vivo erythroid differentiation was initiated by plating 100K of CD34+ HSPCs in 1 well of a 24-well plate containing Stage I media. Stage I media was composed of EDM + IL-3 (5 ng/mL) + SCF (100 ng/mL) + Erythropoietin (EPO) (6 U/mL). At the end of Stage I, cells were counted and analyzed for markers of erythroid differentiation. Stage II of differentiation was initiated by seeding 200 000 cells per well of a 24-well plate in Stage II media for 4 days. Stage II media was composed of EDM + SCF (50 ng/mL) + EPO (6 U/mL). At the end of Stage II, erythroid differentiation was evaluated by flow cytometry (CD71, GLYA) and cell morphology. For Stage III, 500 000 cells were seeded into EDM + EPO (2 U/mL) for 8 days and morphologically evaluated after Wright-Giemsa staining. Enucleation was determined on days 18 to 20 by staining with GLYA and SYTO60 (Molecular Probes).
Statistical analysis
Statistical analysis was performed with GraphPad Prism software. Data are shown as the mean with standard deviation unless noted. For all analyses, P < .05 was considered statistically significant. Investigators were not blinded to the different groups.
Additional methods for bioinformatics analysis, isolation of HSPCs, mitochondrial staining, confocal microscopy, flow cytometry, methylcellulose colony forming assay, western blotting, qRT-PCR, and transmission electron microscopy can be found in the supplemental methods.
Results
Identification of tissue-specific expression of ATG4A
To better understand the transcriptional regulation of autophagy during human erythroid differentiation, we compared the expression of autophagy genes between undifferentiated human HSPCs and mature basophilic erythroblasts in the dataset previously published by Yan et al.25 Consistent with previous studies, we found that the expression of ATG8 genes (GABARAPL2, GABARAP, LC3B) is increased in basophilic erythroblasts relative to immature HSPCs (supplemental Figure 1A). Similarly, genes implicated in the mitophagy pathway, including BNIP3L, BNIP3, and OPTN, are also upregulated in basophilic erythroblasts (supplemental Figure 1B). Several ATG genes that have not been associated with erythropoiesis were significantly upregulated during erythroid differentiation, including ATG4A P < .02), ATG9A (P < .02), and ATG3 (P = .003) (Figure 1A). To determine the expression of ATG4A, ATG9A, and ATG3 throughout the human hematopoietic hierarchy, we analyzed gene expression of sorted hematopoietic populations published by Novershtern et al.26 The expression of ATG4A and ATG9A was upregulated in the erythroid lineage (P < .0001) (supplemental Figure 2A,C). To examine the expression of ATG4A and ATG9A in nonhematopoietic human tissues, we analyzed their expression in the Human Gene Atlas.27 Interestingly, ATG4A was selectively expressed in CD71+ erythroid cells and lowly expressed in all other tissues (supplemental Figure 2B). ATG9A was expressed in the testis, CD71+ erythroid cells, and the heart (supplemental Figure 2D). In contrast, ATG3 was highly expressed in other hematopoietic lineages and tissues (supplemental Figure 2E-F). Integration of these 3 independent data sets identifies erythroid cell type–specific expression of ATG4A.
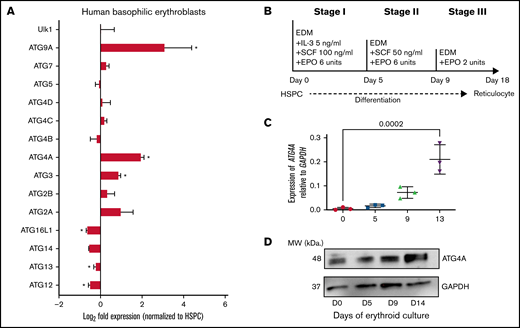
Tissue-specific expression of ATG4A in human erythropoiesis. (A) Fold change (log2) in the expression of ATG genes in human basophilic erythroblasts relative to undifferentiated hematopoietic stem and progenitor cells (HSPCs). Data courtesy of Yan et al (GSE107218).25 The data are plotted as mean ± SEM of 3 independent replicates. Significance was determined using an unpaired 2-tailed Student’s t test. *P < .05. (B) Scheme of ex vivo human erythroid differentiation of CB-derived CD34+ HSPCs. Erythroid culture: immature CD34+ HSPCs are cultured for 18 days in EDM containing the timed addition of cytokines to become reticulocytes. (C) Transcript levels of ATG4A relative to GAPDH on days 0, 5, 9, and 13 of erythroid culture. The data are plotted as mean ± SEM of 3 independent replicates. Significance was determined using a 1-way analysis of variance (ANOVA) followed by a Dunnett post-test. (D) Protein lysates were collected from erythroid culture on days 0, 5, 9, and 13 and analyzed using immunoblot analysis for ATG4A and GAPDH.
Tissue-specific expression of ATG4A in human erythropoiesis. (A) Fold change (log2) in the expression of ATG genes in human basophilic erythroblasts relative to undifferentiated hematopoietic stem and progenitor cells (HSPCs). Data courtesy of Yan et al (GSE107218).25 The data are plotted as mean ± SEM of 3 independent replicates. Significance was determined using an unpaired 2-tailed Student’s t test. *P < .05. (B) Scheme of ex vivo human erythroid differentiation of CB-derived CD34+ HSPCs. Erythroid culture: immature CD34+ HSPCs are cultured for 18 days in EDM containing the timed addition of cytokines to become reticulocytes. (C) Transcript levels of ATG4A relative to GAPDH on days 0, 5, 9, and 13 of erythroid culture. The data are plotted as mean ± SEM of 3 independent replicates. Significance was determined using a 1-way analysis of variance (ANOVA) followed by a Dunnett post-test. (D) Protein lysates were collected from erythroid culture on days 0, 5, 9, and 13 and analyzed using immunoblot analysis for ATG4A and GAPDH.
To validate our bioinformatics analysis, we quantified transcripts of ATG4A during the ex vivo erythroid differentiation of human HSPCs. Erythroid cells were differentiated according to a previously established 3-stage culture system of human erythropoiesis.24 In this model, primary CD34+ cells are isolated from human umbilical CB and differentiated into RBCs ex vivo through the timed addition of growth factors over 18 to 21 days (Figure 1B). RNA was harvested from cells on days 0, 5, 9, and 13 of erythroid differentiation and analyzed for ATG4A mRNA expression. ATG4A expression was lowest in undifferentiated HSPCs and increased 20-fold by day 13 of culture in basophilic and polychromatic erythroblasts (P = .0002) (Figure 1C). Protein lysates harvested from cultured erythroid cells at days 0, 5, 9, and 14 revealed a similar increase in ATG4A protein expression (Figure 1D). These results are consistent with our bioinformatic analysis, which showed a rise in ATG4A transcripts in human basophilic erythroblasts relative to undifferentiated HSPCs. Our results indicate that the expression of ATG4A is upregulated as erythroid cells terminally mature.
ATG4A promotes human erythroid differentiation
To determine the role of ATG4A in human erythropoiesis, we transduced primary human CD34+ HSPCs isolated from multiple donors with 2 independent lentiviral shRNAs that target ATG4A (shATG4A) or the control luciferase gene (shLUC). HSPCs expressing shATG4A (ATG4A knockdown [KD]) showed at least a 50% reduction in ATG4A mRNA relative to controls (P < .09; P < .006) (supplemental Figure 3A). Sorted CD34+ HSPCs expressing shRNAs were plated into methylcellulose to evaluate hematopoietic colony-forming potential or guided through ex vivo erythroid differentiation (Figure 2A). To evaluate hematopoietic potential, sorted CD34+ HSPCs expressing control or shATG4A hairpins were plated into methylcellulose, and multipotent (GEMM), erythroid (BFU-E, CFU-E), and myeloid (CFU-G, CFU-M, or CFU-GM) hematopoietic colonies were counted. Methylcellulose plates seeded with ATG4A KD HSPCs had <25% of erythroid colonies compared with control HSPCs (P < .0001) (Figure 2B). In contrast, equivalent numbers of CFU-GEMM and myeloid colonies were present in control and ATG4A KD methylcellulose plates (Figure 2B). These results support an erythroid-specific role for ATG4A in human hematopoietic differentiation.
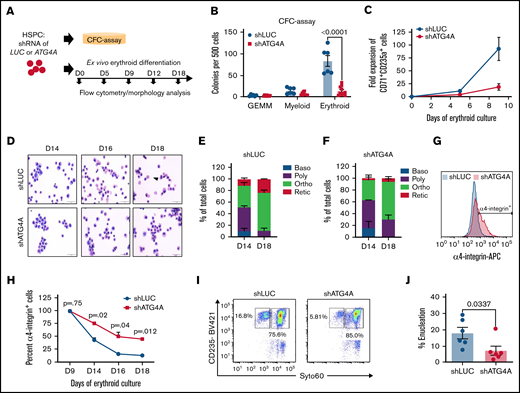
ATG4A promotes human erythroid maturation and enucleation. (A) Human CB-derived CD34+ HSPCs were transduced with control (shLUC) or ATG4A KD (shATG4A) lentiviruses, expanded, and sorted before erythroid culture. (B) Colony-forming potential of CD34+ shRNA expressing HSPCs plated into methylcellulose-containing cytokines. Myeloid, erythroid, or multilineage (CFU-GEMM) colonies were scored by 2 independent investigators. Data shown are plotted as mean ± SEM of 3 independent donors and 2 shRNA hairpins per group. Significance was calculated using a 2-way ANOVA followed by a multiple comparisons test. (C) Fold expansion of erythroid cells stained with CD71 and CD235a on days 5 and 9 of erythroid culture. Data shown are plotted as mean ± SEM of 3 independent donors and 2-shRNA hairpins per group. (D) Erythroid cell morphology evaluated using May-Grunwald-Giemsa–stained cytospins of control or ATG4A KD cells on days 14, 16, and 18 of erythroid culture. Images were taken at 60× magnification. The scale bar is 50 µm. The arrow in the top row highlights enucleated cells in control erythroid cultures. (E) Quantification of erythroid cell morphology on days 14 and 18 May-Grunwald-Giemsa–stained cytospins from control (shLUC) cultures. Baso, basophilic erythroblast; poly, polychromatic erythroblast; ortho, orthochromatic erythroblast; retic, reticulocyte. (F) Quantification of erythroid cell morphology on days 14 and 18 May-Grunwald-Giemsa–stained cytospins from ATG4A KD (shATG4A) cultures. (G) Immunophenotypic evaluation of control and ATG4A KD cells from day 18 of erythroid culture, stained with CD49d. (H) Quantification of CD49d-positive cells on days 9, 14, 16, and 18 of erythroid culture. Data shown are plotted as mean ± SEM of 2 independent donors. Significance calculated using Student 2-tailed t test. (I and J) Enucleation efficiency on day 18 of differentiation. Enucleation efficiency was quantified using flow cytometry. Enucleated cells were defined as GLYA+ SYTO60−. Data shown are plotted as mean ± SEM of 3 independent donors and 2 shRNA hairpins per group.
ATG4A promotes human erythroid maturation and enucleation. (A) Human CB-derived CD34+ HSPCs were transduced with control (shLUC) or ATG4A KD (shATG4A) lentiviruses, expanded, and sorted before erythroid culture. (B) Colony-forming potential of CD34+ shRNA expressing HSPCs plated into methylcellulose-containing cytokines. Myeloid, erythroid, or multilineage (CFU-GEMM) colonies were scored by 2 independent investigators. Data shown are plotted as mean ± SEM of 3 independent donors and 2 shRNA hairpins per group. Significance was calculated using a 2-way ANOVA followed by a multiple comparisons test. (C) Fold expansion of erythroid cells stained with CD71 and CD235a on days 5 and 9 of erythroid culture. Data shown are plotted as mean ± SEM of 3 independent donors and 2-shRNA hairpins per group. (D) Erythroid cell morphology evaluated using May-Grunwald-Giemsa–stained cytospins of control or ATG4A KD cells on days 14, 16, and 18 of erythroid culture. Images were taken at 60× magnification. The scale bar is 50 µm. The arrow in the top row highlights enucleated cells in control erythroid cultures. (E) Quantification of erythroid cell morphology on days 14 and 18 May-Grunwald-Giemsa–stained cytospins from control (shLUC) cultures. Baso, basophilic erythroblast; poly, polychromatic erythroblast; ortho, orthochromatic erythroblast; retic, reticulocyte. (F) Quantification of erythroid cell morphology on days 14 and 18 May-Grunwald-Giemsa–stained cytospins from ATG4A KD (shATG4A) cultures. (G) Immunophenotypic evaluation of control and ATG4A KD cells from day 18 of erythroid culture, stained with CD49d. (H) Quantification of CD49d-positive cells on days 9, 14, 16, and 18 of erythroid culture. Data shown are plotted as mean ± SEM of 2 independent donors. Significance calculated using Student 2-tailed t test. (I and J) Enucleation efficiency on day 18 of differentiation. Enucleation efficiency was quantified using flow cytometry. Enucleated cells were defined as GLYA+ SYTO60−. Data shown are plotted as mean ± SEM of 3 independent donors and 2 shRNA hairpins per group.
To further evaluate the contribution of ATG4A to erythroid differentiation, we differentiated human CD34+ HSPCs expressing ATG4A KD or control hairpins ex vivo. ATG4A KD cultures on day 18 had ∼50% ATG4A protein compared with controls (supplemental Figure 3B), indicating that suppression of ATG4A expression was maintained throughout erythroid differentiation. During erythroid differentiation, control HSPCs expanded approximately 100-fold between days 0 and 9 of erythroid culture, whereas ATG4A KD HSPCs only expanded 20-fold, suggesting that loss of ATG4A reduces erythroid cell production (Figure 2C). To monitor human erythroid differentiation, we stained cells on days 5, 9, 13, and 18 of erythroid culture with CD71 (transferrin receptor) and CD235a/Glycophorin A (GLYA) (supplemental Figure 3C). Nearly all control and ATG4A-deficient cells became GLYA+ erythroblasts. However, the kinetics of cell surface expression of CD71 differed between erythroid cells from control and ATG4A KD cultures. During differentiation, human erythroid cells transition immunophenotypically from CD71+GLYA- pro-erythroblasts to CD71+GLYA+ erythroblasts to CD71loGLYA+ population, which contains polychromatic/orthochromatic erythroblasts and reticulocytes. While the levels of CD71 declined on erythroid cells from control cultures between days 9 and 13 of culture, erythroid cells from ATG4A KD cultures maintained a 2-fold higher expression of CD71 (P < .006; P < .002) (supplemental Figure 3D). By day 18, only 6.5% of erythroid cells from ATG4A KD cultures transitioned from CD71+ GLYA+ to a CD71loGLYA+ immunophenotype compared with 17% in control erythroid cells (supplemental Figure 3E). Because the decrease in the immunophenotypic transition from a CD71+ GLYA+ to CD71loGLYA+ reflects erythroid maturation, the alterations in CD71 kinetics on ATG4A KD erythroid cells suggest a delay in terminal differentiation. In addition to CD71, we also evaluated the expression of CD36, an early erythroid marker normally downregulated in terminal differentiation. Less than 10% of ATG4A KD erythroid cells had low levels of CD36, whereas ∼20% of control erythroid cells had decreased CD36 expression (supplemental Figure 3F). Morphologic examination of cells from days 14 and 18 of ATG4A KD cultures revealed the persistence of polychromatic erythroblasts and an impaired transition to orthochromatic and the enucleated reticulocyte stages (Figure 2D-F). To further evaluate erythroblast maturation immunophenotypically, we stained ATG4A KD and control erythroid cells with CD49d on days 9, 14, 16, and 18. On these days of differentiation, control erythroblasts became progressively CD49d-. In contrast, ATG4A KD cultures maintained a CD49d+ population, supporting a role for ATG4A in terminal erythroblast maturation (Figure 2G-H). To quantify enucleation efficiency, we stained cells from erythroid culture with a membrane-permeable nuclear stain Syto60. On day 18 of culture, we observed 18% GLYA+Syto60lo enucleated cells in control cultures compared with only 7% in ATG4A KD cultures (P < .04) (Figure 2I-J). Together, these results establish that ATG4A is required for human erythroid differentiation ex vivo.
ATG4A promotes macroautophagy during human erythropoiesis
ATG4 proteases have been previously shown to promote autophagosome growth and maturation.8,28,29 To monitor autophagy in live human erythroid cells undergoing differentiation, we generated a lentiviral vector expressing a fluorescent LC3B-ratiometric reporter (mCherry-EGFP-LC3B) and an shRNA to reduce the expression of ATG4A (see Methods) (herein LC3B-ratiometric reporter) (Figure 3A). The LC3B-ratiometric reporter becomes incorporated into growing autophagosomes through the conjugation of LC3B to phosphatidylethanolamine (PE).30 At the end of autophagosome maturation, autophagosomes are acidified by lysosomes, and EGFP fluorescence is quenched.30 In erythroid cells undergoing differentiation, the fluorescence of mCherry remained stable, whereas the fluorescence of GFP decreased from days 5 to 18 of differentiation (Figure 3B). Thus, the ratio of mCherry to GFP reflects autophagic flux and can be quantified using flow cytometry.30 To determine if ATG4A contributes to autophagosome dynamics in human erythropoiesis, human HSPCs were transduced with the LC3B-ratiometric reporter expressing shLUC or shATG4A, and mCherry/GFP fluorescence was evaluated during differentiation by flow cytometry. On day 1, the fluorescence of GFP and mCherry was approximately equal, resulting in a ratio of ∼1 in both groups. By day 18 of culture, the ratio of mCherry/GFP had increased to 4.5 in control GLYA+ erythroid cells, indicating higher autophagic flux, whereas the ratio was 3.5 in ATG4A KD erythroid cells (P = .02) (Figure 3C). These results suggest that depletion of ATG4A results in reduced autophagic flux.

ATG4A promotes macroautophagy during erythropoiesis. (A) Schematic design of the LC3B-GFP-mCherry autophagy ratiometric reporter. (B) Representative histograms of mCherry and GFP fluorescence measured by flow cytometry in human erythroid cells expressing the LC3B-ratiometric reporter on days 5, 9, 12, and 18 of erythroid differentiation. (C) LC3B-ratiometric reporter mCherry/GFP ratio in control and ATG4A KD erythroid differentiation. The ratio of mCherry/GFP from control (shLUC) and ATG4A KD (shATG4A) erythroid cells was plotted on days 1, 5, 9, 12, and 18 of erythroid culture. The fluorescence of mCherry and GFP was quantified using flow cytometry. Data shown are plotted as mean ± SEM of 3 independent donors and 2 shRNA hairpins per group. Significance was determined using a 2-way ANOVA followed by a multiple comparisons test. (D) LC3B protein level in lysates harvested from days 5 and 18 of erythroid culture immunoblotted for LC3B and β-actin. (E and F) Quantification of immunoblots for LC3B-I and LC3B-II relative to β-actin on days 5 and 18 of erythroid culture. Data plotted as mean ± SEM of 2 hairpins per group from a single CB donor. (G and H) LC3B protein level in control and ATG4A KD cells from days 5 and 18 of culture treated with 200 nM of bafilomycin A1 for 4 hours. Lysates were analyzed with anti-LC3B and GAPDH. (I) The ratio of mCherry to GFP fluorescence in erythroid cells expressing the LC3B-ratiometric reporter from day 5 of culture treated with 200 nM of bafilomycin A1 for 4 hours. Following treatment, the ratio of mCherry to GFP was quantified by flow cytometry. Data shown are plotted as mean ± SEM of 3 independent donors and 2 shRNA hairpins per group. Significance was evaluated using a 2-way ANOVA followed by a multiple comparisons test.
ATG4A promotes macroautophagy during erythropoiesis. (A) Schematic design of the LC3B-GFP-mCherry autophagy ratiometric reporter. (B) Representative histograms of mCherry and GFP fluorescence measured by flow cytometry in human erythroid cells expressing the LC3B-ratiometric reporter on days 5, 9, 12, and 18 of erythroid differentiation. (C) LC3B-ratiometric reporter mCherry/GFP ratio in control and ATG4A KD erythroid differentiation. The ratio of mCherry/GFP from control (shLUC) and ATG4A KD (shATG4A) erythroid cells was plotted on days 1, 5, 9, 12, and 18 of erythroid culture. The fluorescence of mCherry and GFP was quantified using flow cytometry. Data shown are plotted as mean ± SEM of 3 independent donors and 2 shRNA hairpins per group. Significance was determined using a 2-way ANOVA followed by a multiple comparisons test. (D) LC3B protein level in lysates harvested from days 5 and 18 of erythroid culture immunoblotted for LC3B and β-actin. (E and F) Quantification of immunoblots for LC3B-I and LC3B-II relative to β-actin on days 5 and 18 of erythroid culture. Data plotted as mean ± SEM of 2 hairpins per group from a single CB donor. (G and H) LC3B protein level in control and ATG4A KD cells from days 5 and 18 of culture treated with 200 nM of bafilomycin A1 for 4 hours. Lysates were analyzed with anti-LC3B and GAPDH. (I) The ratio of mCherry to GFP fluorescence in erythroid cells expressing the LC3B-ratiometric reporter from day 5 of culture treated with 200 nM of bafilomycin A1 for 4 hours. Following treatment, the ratio of mCherry to GFP was quantified by flow cytometry. Data shown are plotted as mean ± SEM of 3 independent donors and 2 shRNA hairpins per group. Significance was evaluated using a 2-way ANOVA followed by a multiple comparisons test.
ATG4 proteases contribute to autophagic flux through the priming and recycling of ATG8 proteins through the ATG8 conjugation system.31 Loss of ATG4 proteases impairs the conjugation and delipidation of LC3B/GABARAP proteins in human cell lines.32 Therefore, we probed for the conjugation of LC3B to PE during human erythropoiesis in control and ATG4A KD cells. Immunoblots on days 5 and 18 of erythroid differentiation revealed similar levels of unconjugated LC3B-I in control and ATG4A KD cells (Figure 3D-E). LC3B-II levels were similar on day 5 of differentiation, with a trend toward more LC3B-II in ATG4A KD cells on day 18 of differentiation (Figure 3F). These results indicate that the depletion of ATG4A does not alter the conjugation of LC3B to PE during erythroid differentiation. To determine if the loss of ATG4A completely blocked autophagic flux, we treated cells on days 5 and 18 of differentiation with bafilomycin A1, an inhibitor of lysosome acidification and autophagy. Treatment with bafilomycin A1 resulted in comparable LC3B-II accumulation in control and ATG4A KD cells on day 5 and, to a lesser extent, on day 18 (Figure 3G-H). Furthermore, treatment of control and ATG4A KD erythroid cells expressing the LC3B-ratiometric reporter with bafilomycin A1 resulted in a significant decrease of the mCherry/GFP ratio (control: P < .02; ATG4A KD: P < .004), indicating that basal levels of autophagy were still active in the absence of ATG4A (Figure 3I). Our results suggest that ATG4A contributes to autophagosome turnover during erythropoiesis, yet its partial loss does not impair the ATG8 conjugation system.
Other ATG4 proteins have a limited role in erythroid differentiation
The ATG4 family of proteases includes ATG4B and ATG4D, previously shown to contribute to autophagy in human erythropoiesis.8 ATG4B and ATG4D are similarly upregulated during human erythroid differentiation (supplemental Figure 4A-D). To determine if ATG4B and ATG4D contribute to erythroid differentiation or autophagy, we performed shRNA KD of ATG4B and ATG4D in the LC3B-ratiometric reporter, resulting in ∼50% reduction of ATG4B and ∼75% reduction of ATG4D mRNA transcripts relative to control hairpins (supplemental Figure 5A-B). To determine the role of ATG4B and ATG4D in human erythropoiesis, we transduced primary human CD34+ HSPCs isolated from multiple independent CB donors with lentiviral shRNAs targeting ATG4B (shATG4B), ATG4D (shATG4D), or the control luciferase gene (shLUC). Sorted CD34+ HSPCs were plated into methylcellulose to evaluate hematopoietic colony-forming potential or guided through ex vivo erythroid differentiation. We found no significant differences in the number of erythroid (CFU-E and BFU-E), myeloid, or CFU-GEMM colonies after ATG4B and ATG4D KD (supplemental Figure 5C). Furthermore, ex vivo differentiation of shATG4B and shATG4D HSPCs resulted in the nearly identical maturation of GLYA+ erythroblasts compared with controls (supplemental Figure 5D). In contrast to ATG4A KD erythroid cultures, we did not find any differences in the enucleation of ATG4B KD or ATG4D KD erythroid cells (supplemental Figure 5E). We further characterized terminal erythropoiesis by staining ATG4B and ATG4D KD cells from days 9, 14, 16, and 18 of erythroid culture with CD49d (supplemental Figure 6A). We found no difference in the kinetics of CD49d downregulation in ATG4B and ATG4D KD erythroid cells relative to controls (supplemental Figure 6B). Cumulatively, these results suggest that the loss of ATG4B or ATG4D does not alter human erythroid differentiation.
Because we profiled erythroid differentiation of ATG4B KD and ATG4D KD cells using the LC3B ratiometric reporter, we simultaneously measured the ratio of mCherry/GFP fluorescence on days 5, 9, and 18. The ratio of mCherry/GFP was comparable between shLUC, shATG4B, and shATG4D on days 5 and 9 but was reduced in shATG4B cells on day 18 (supplemental Figure 7A). GLYA+ ATG4B KD erythroid cells also had higher Mitotracker Deep Red fluorescence levels than controls (supplemental Figure 7B). Therefore, our findings suggest that ATG4B contributes to autophagic flux during the final stages of erythropoiesis, but ATG4B and ATG4D have a limited role in erythroid differentiation.
ATG4A regulates mitochondrial dynamics during human erythroid differentiation
Autophagy is known to contribute to the clearance of mitochondria in erythropoiesis. To determine if ATG4A contributes to organelle clearance during human erythroid differentiation, we monitored the clearance of mitochondria using a lentiviral vector that expresses the mitochondrial-targeted (MT) Keima fluorescent protein and an shRNA (see Methods) (herein MT-Keima reporter) (Figure 4A). The fluorescence of Keima is pH-sensitive, allowing it to be used to track lysosomal-dependent mitochondrial degradation in mammalian cells.33,34 Keima can be excited by distinct wavelengths depending on whether it is located in a neutral environment (458 nm) or an acidic compartment (561 nm). Previous studies have used the fluorescence ratio (herein 561:458 ratio) to monitor mitophagy.34-36 We first confirmed mitochondrial localization of MT-Keima by staining HeLa cells expressing the MT-Keima reporter with Mitotracker Green. Overlap of the MT-Keima (eg, 458 nm) signal and Mitotracker Green signal revealed substantial colocalization demonstrating that the Keima protein targets mitochondrial membranes (supplemental Figure 8A). To ensure that the 561:458 ratio reflects changes in mitochondrial dynamics, we treated 293 T cells expressing the MT-Keima reporter with bafilomycin A1 to inhibit the acidification of lysosomes and prevent the degradation of mitochondria in autophagosomes. Treatment with bafilomycin A1 decreased the 561:458 ratio, reflecting the inhibition of mitophagy (P < .002) (supplemental Figure 8B).
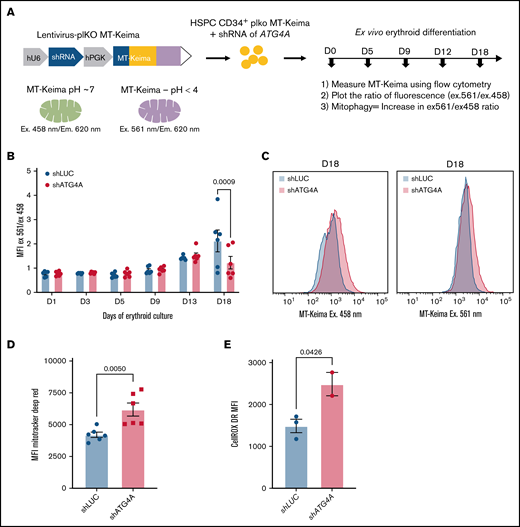
ATG4A promotes mitochondrial clearance during terminal erythroid maturation. (A) Scheme of the MT-Keima mitophagy reporter. (B) The 561/458 MT-Keima fluorescence ratio measured by flow cytometry on days 1, 3, 5, 9, 13, and 18 of erythroid culture. HSPCs transduced with MT-Keima control (shLUC) or MT-Keima ATG4A KD (shATG4A) reporters were stained with CD71 and GLYA to gate on a total erythroid population. A significant difference in the 561:458 ratio between control and ATG4A KD cells was found only on day 18 of culture. Data shown are plotted as mean ± SEM of 3 independent donors and analyzed using a 2-way ANOVA followed by a multiple comparisons test. (C) Representative flow plots of MT-Keima fluorescence at 458 nm or 561 nm excitation on day 18 of erythroid differentiation. (D and E) Mitotracker Deep Red (MDR) or CellROX Deep Red levels on day 18 of erythroid culture. Control and ATG4A KD erythroid cells were stained with GLYA, and MDR mean fluorescence intensity was measured by flow cytometry. Significance was evaluated using Student t test. Data shown are plotted as mean ± SEM of 3 independent donors and 2 shRNA hairpins per group (D). Data shown are plotted as mean ± SEM of 2 independent donors (E).
ATG4A promotes mitochondrial clearance during terminal erythroid maturation. (A) Scheme of the MT-Keima mitophagy reporter. (B) The 561/458 MT-Keima fluorescence ratio measured by flow cytometry on days 1, 3, 5, 9, 13, and 18 of erythroid culture. HSPCs transduced with MT-Keima control (shLUC) or MT-Keima ATG4A KD (shATG4A) reporters were stained with CD71 and GLYA to gate on a total erythroid population. A significant difference in the 561:458 ratio between control and ATG4A KD cells was found only on day 18 of culture. Data shown are plotted as mean ± SEM of 3 independent donors and analyzed using a 2-way ANOVA followed by a multiple comparisons test. (C) Representative flow plots of MT-Keima fluorescence at 458 nm or 561 nm excitation on day 18 of erythroid differentiation. (D and E) Mitotracker Deep Red (MDR) or CellROX Deep Red levels on day 18 of erythroid culture. Control and ATG4A KD erythroid cells were stained with GLYA, and MDR mean fluorescence intensity was measured by flow cytometry. Significance was evaluated using Student t test. Data shown are plotted as mean ± SEM of 3 independent donors and 2 shRNA hairpins per group (D). Data shown are plotted as mean ± SEM of 2 independent donors (E).
Primary human CD34+ HSPCs were transduced with the MT-Keima reporter and guided through ex vivo erythroid differentiation. Flow cytometry was used to monitor mitochondrial clearance using the 561:458 ratio in an immunophenotypically defined erythroid population. In control cells, the 561:458 ratio of the MT-Keima reporter remained relatively stable between days 0 and 9 of erythroid culture, suggesting that the proportion of mitochondria in an acidic and neutral environment was equal. However, the ratio began to increase on days 11 to 15 and doubled by day 18 of culture, reflecting the shift in localization of mitochondria from a cytoplasmic to an acidic compartment (P < .003) (supplemental Figure 8C-D). These results are consistent with previous studies, which found that the levels of mitochondria gradually decrease during terminal erythroid differentiation.8,37,38
To determine if ATG4A contributes to mitochondrial clearance during erythroid differentiation, we transduced CD34+ HSPCs with the MT-Keima reporter expressing shATG4A or shLUC (Figure 4A). To quantify mitochondrial clearance during human erythropoiesis, we plotted the 561:458 ratio of the MT-Keima reporter. Measurement of the MT-Keima 561:458 ratio in total erythroid cells on days 1, 3, 5, 9, and 13 of erythroid culture revealed no significant differences between ATG4A KD and control erythroid cells. However, on day 18 of erythroid culture, the 561:458 ratio was ∼1.50 in ATG4A KD erythroid cells. In contrast, the ratio in control cells had increased to 2.25, suggesting that mitochondrial clearance was incomplete in ATG4A KD erythroid cells (P < .0009) (Figure 4B-C). Cells from ATG4A KD and control cultures were stained with Mitotracker Deep Red on day 18 of differentiation to measure mitochondrial mass directly. Terminally differentiated ATG4A KD cells had ∼30% higher mitochondrial mass compared with erythroid cells from control cultures (P < .005) (Figure 4D). Previous reports have identified higher levels of reactive oxygen species in erythroid cells with impaired autophagy.13 Furthermore, ATG4A KD cells had high levels of reactive oxygen species measured by CellRox DeepRed on day 18 of erythroid differentiation, suggesting that the inhibition of autophagy and organelle clearance during erythropoiesis induces oxidative stress (Figure 4E). These results suggest that ATG4A promotes the clearance of mitochondria during terminal erythropoiesis.
To determine if enucleated red cells retained mitochondria at the end of differentiation, we analyzed the ultrastructure of enucleated red cells using transmission electron microscopy. On day 18 of ex vivo erythroid differentiation, ATG4A KD and control cultures were harvested, sorted, and fixed. Transmission electron microscopy images revealed various autophagic structures, including early and late autophagosomes, amphisomes, lysosomes, and mitochondria (Figure 5A). Quantification of mitochondria, autophagic vesicles, and lysosomes in control and ATG4A KD reticulocytes showed that ATG4A KD reticulocytes had higher levels of mitochondria and autophagic vesicles relative to controls (Figure 5B-D). Together, these results demonstrate that ATG4A contributes to the autophagic clearance of mitochondria during human erythroid differentiation.
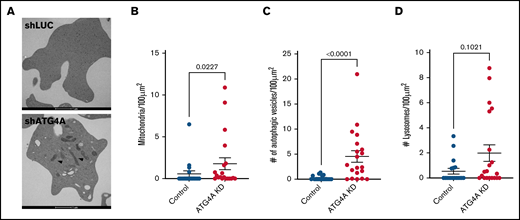
Ultrastructural analysis of ATG4A KD reticulocytes. (A) Transmission electron micrograph of day 18 reticulocytes from control and ATG4A KD cultures. Mitochondria are marked with arrows. Quantification of mitochondria (B), autophagic vesicles (C), and lysosomes (D). Analysis was performed on 2-dimensional sections of at least 18 reticulocytes from each group. Data shown reflect 2 hairpins per group and are plotted as mean ± SEM of a single donor. Data were analyzed using the Mann-Whitney test.
Ultrastructural analysis of ATG4A KD reticulocytes. (A) Transmission electron micrograph of day 18 reticulocytes from control and ATG4A KD cultures. Mitochondria are marked with arrows. Quantification of mitochondria (B), autophagic vesicles (C), and lysosomes (D). Analysis was performed on 2-dimensional sections of at least 18 reticulocytes from each group. Data shown reflect 2 hairpins per group and are plotted as mean ± SEM of a single donor. Data were analyzed using the Mann-Whitney test.
Discussion
Autophagy is indispensable for organelle clearance during the terminal stages of erythroid differentiation; however, its erythroid-specific regulation is incompletely understood. Previous studies have identified an association between the expression of autophagy genes and normal erythroid maturation.21 Combining the differentiation of human HSPCs ex vivo with fluorescent autophagy and mitophagy reporters, we show that ATG4A is indispensable for human erythropoiesis. Loss of ATG4A but not the other ATG4 family proteins (ATG4B, ATG4D) impaired terminal erythroid maturation and enucleation. Furthermore, ATG4A was essential for autophagosome dynamics and mitochondrial clearance, and its loss results in the production of reticulocytes with retained mitochondria and autophagic vesicles. Taken together, the results of our study identify a new and essential role for the autophagy-related gene ATG4A in human erythropoiesis.
The degradation of mitochondria must be closely regulated because mitochondria are the site for heme production and facilitate erythroid enucleation.39,40 Our results highlight that ATG4A expression is essential for the temporal induction of autophagic flux and mitochondrial clearance in terminally differentiated orthochromatic erythroblasts. Prior studies have identified a role for the autophagy-related genes Bnip3l, Atg7, Fip200, and Ulk1 in mitochondrial clearance during erythroid differentiation.4,5,12 -14 Bnip3l is the best-characterized mitophagy receptor in erythropoiesis and facilitates the recruitment of mitochondria to autophagosomes.41,42 Loss of Bnip3l in mice results in impaired mitochondrial clearance during terminal erythropoiesis and anemia.4,5 Although loss of BNIP3L has been studied extensively in mice, few studies have interrogated its contribution to mitochondrial clearance in human erythropoiesis. In contrast, recent studies have identified a role for the PINK1-PARKIN canonical mitophagy pathway in mitochondrial clearance during human erythropoiesis.38 Although ATG4 proteases facilitate Pink1/Parkin-dependent mitophagy, a role in BNIP3L-dependent mitophagy is unknown.29 Thus, multiple mechanisms of mitochondrial clearance may be acting during terminal erythroid differentiation.
ATG4 proteases have been previously shown to contribute to autophagosome maturation in human erythroid cells.8 ATG4 proteases in mammals have both canonical and noncanonical functions in the autophagy pathway. In the canonical pathway of autophagy, ATG4 proteases (i) promote autophagosome biogenesis by cleaving newly synthesized ATG8 proteins, which allow for the conjugation with PE, and (ii) facilitate recycling of ATG8 proteins from mature autophagosomes by removing ATG8 from ATG8-PE conjugates.43 Additionally, ATG4A also functions as a deubiquitinating-like enzyme to prevent the posttranslational modification of other cellular structures with LC3/GABARAP proteins.44 Interestingly, ATG4A KD erythroid cells did not show significant changes in LC3B-I, with a modest increase in LC3B-II (LC3B-PE), suggesting that ATG4A may regulate LC3B delipidation. Notably, other ATG4A family proteins, ATG4B and ATG4D, also modestly regulate LC3B-dependent autophagy but do not affect erythroid differentiation, consistent with the previous findings by Betin et al. It is thus possible that ATG4A may also act through alternate mechanisms. Recently a noncanonical role for ATG4A-dependent mitophagy was identified, in which ATG4A directly recruits ATG9A-vesicles to promote mitophagy.29 Therefore, further study is needed to unravel the mechanisms of ATG4A-dependent autophagy during erythroid differentiation.
Previous studies have determined that the endocytic and autophagy pathways converge during erythroid maturation.45,46 In human erythroid cells, expression of dominant negative ATG4B/D mutants results in an increase type II amphisomes, which are hybrid endosomal/autophagosome structures, supporting a role for ATG4 paralogs in this process.8 Knockdown of ATG4A resulted in aberrant kinetics of the transferrin receptor, known to be recycled through the endosome pathway, as well as a variety of cytoplasmic structures in reticulocytes, Cumulatively, this evidence suggests that ATG4A may also support endocytic and autophagy pathways.
Autophagy has been recently identified as a therapeutic target in impaired and ineffective erythropoiesis associated with bone marrow failure and thalassemias; however, the exact mechanism remains unclear.47,48 Previous studies have shown that the cysteines in ATG4A can be oxidized by reactive oxygen species, impairing its proteolytic function.49 Thus, inhibition of ATG4A by oxidative stress may be a shared mechanism underlying impaired mitophagy across human RBC disorders.
Acknowledgments
The authors thank Donna Prunkard and Xiaoping Wu at the Pathology Flow Cytometry core at the University of Washington and Nathaniel Peters at the Keck Imaging Center for providing technical assistance. Sequences for MT-Keima were a generous gift from Dr. Steven Chan at the University of Toronto. The authors would like to thank the Fred Hutch Cellular Imaging Shared Resource for assistance with microscopy and image analysis. The authors thank Thalia Papayannopoulou (University of Washington) for helpful discussions and critical review of the manuscript.
This work was supported by National Heart, Lung, and Blood Institute, National Institutes of Health grants R00 HL123484, R21 HL139864, and R01 HL151651 (S.D.), grant R01 HL031823 (J.L.A.), and NIH New Innovator Award DP2 HL147126 (S.D.). This research was funded through the Wayne D. Kuni and Joan E. Kuni Foundation Discovery Grant, American Federation for Aging Research Junior Faculty Grant, Research Royalty Fund Award, and ASH Scholar Award. M.C.S. was supported by an National Institute of Diabetes and Digestive and Kidney Diseases grant K01 DK128126, National Heart, Lung, and Blood Institute, National Institutes of Health training grant T32 HL007093, Co-Operative Center for Excellence in Hematology (CCEH) pilot award (U54 DK106829), and R01 Diversity Supplement (R01 HL031823-01S1). This research was supported by the Cellular Imaging Shared Resource (CISR) of the Fred Hutch/University of Washington Cancer Consortium (P30 CA015704).
Authorship
Contribution: M.C.S., J.L.A., and S.D. conceived the project and designed the experiments; M.C.S. performed experiments, analyzed data, and wrote the manuscript; A.R. performed and analyzed confocal images; R.B. and S.S. performed experiments; C.A.C. participated in the cloning of the autophagy reporters; R.W. contributed to the bioinformatic analysis; N.T. performed experiments and contributed to the bioinformatics analysis; R.S. harvested CD34+ cells from cord blood; J.L.A. assisted with the interpretation of the results and manuscript preparation; S.D. assisted with data analysis and manuscript preparation; and J.L.A. and S.D. supervised the study.
Conflict-of-interest disclosure: The authors declare no competing financial interests.
Correspondence: Sergei Doulatov, University of Washington, 1710 NE Pacific St, Health Sciences, Box 357710, Seattle, WA 98195; e-mail: doulatov@uw.edu.

