

Key Points
Combined targeting of AML patient cells with p38 MAPK and BCL2 inhibitors overcomes monocytic-associated resistance to VEN.
Exploiting complementary drug sensitivity profiles with respect to leukemic differentiation state affords enhanced efficacy in AML.
Abstract
Using ex vivo drug screening of primary patient specimens, we identified the combination of the p38 MAPK inhibitor doramapimod (DORA) with the BCL2 inhibitor venetoclax (VEN) as demonstrating broad, enhanced efficacy compared with each single agent across 335 acute myeloid leukemia (AML) patient samples while sparing primary stromal cells. Single-agent DORA and VEN sensitivity was associated with distinct, nonoverlapping tumor cell differentiation states. In particular, increased monocytes, M4/M5 French-American-British classification, and CD14+ immunophenotype tracked with sensitivity to DORA and resistance to VEN but were mitigated with the combination. Increased expression of MAPK14 and BCL2, the respective primary targets of DORA and VEN, were observed in monocytic and undifferentiated leukemias, respectively. Enrichment for DORA and VEN sensitivities was observed in AML with monocyte-like and progenitor-like transcriptomic signatures, respectively, and these associations diminished with the combination. The mechanism underlying the combination’s enhanced efficacy may result from inhibition of p38 MAPK-mediated phosphorylation of BCL2, which in turn enhances sensitivity to VEN. These findings suggest exploiting complementary drug sensitivity profiles with respect to leukemic differentiation state, such as dual targeting of p38 MAPK and BCL2, offers opportunity for broad, enhanced efficacy across the clinically challenging heterogeneous landscape of AML.
Introduction
The development of molecularly targeted therapies to improve outcomes relative to chemotherapy for acute myeloid leukemia (AML) is impeded by the heterogeneity of genetic aberrations that contribute to disease.1 Elucidating biological mechanisms that lead to AML disease initiation and progression, which may then guide the identification of effective therapies, is a strategy to overcome somatic heterogeneity. Among such mechanisms are cytokine signaling pathways, a hallmark of chronic inflammation, whose dysregulation contributes to the growth, survival, and differentiation of AML cells in a manner independent of their mutational status.2-5 Interleukin-1β (IL-1β) stimulates proliferation of leukemic blasts in primary AML samples6-8 via enhanced activation of p38 MAPK, an effect that can be blocked by IL-1 receptor knockdown or by inhibition of p38 kinase signaling with doramapimod (DORA), a p38 MAPK inhibitor.9
Activation of p38 MAPK signaling, which is triggered by many inflammatory cytokines and growth factors,10 has also been shown to phosphorylate BCL2, thereby altering its antiapoptotic potential.11-13 This observation has implications for patients with AML treated with the Food and Drug Administration–approved BCL2 inhibitor venetoclax (VEN), where despite impressive response rates, recent studies have shown sensitivity preferentially associates with undifferentiated leukemic cells.14-16 These associations prompted us to evaluate DORA in combination with VEN for sensitivity in AML cells.
Methods
Patient samples and ex vivo drug screens
All patient specimens were collected following informed consent and in accordance with approved institutional review board protocols by the Oregon Health and Science University as previously described for the Beat AML program.16 Mononuclear cells were isolated from freshly obtained bone marrow aspirates or peripheral blood draws and plated ex vivo (10 000 cells per well) in the presence of a 7-point concentration series (10 μM to 0.0137 μM) of DORA, VEN, or the combination (equimolar concentration series identical to those used for single agents) and assessed at 72 hours by 3-(4,5 dimethylthiazol-2-yl)-5-(3-carboxymethoxyphenyl-2-(4-sulfophenyl)-2H-tetrazolium (MTS)-based viability assay as described.17,18 For patient samples with bone marrow blast percentage annotation (n = 172), the median was 74.9% (range, 1.5% to 98%). For samples with peripheral blood differential cell count data (n = 165), the median was 60% blasts (range, 0% to 98%). Single-agent and combination conditions were compared by the Friedman test with post hoc Nemenyi test. HS-5 stromal cells or stromal cells isolated from the post-Ficoll pellet of an AML patient sample (20-00494; expanded and frozen prior to testing) were plated in the presence of DORA, VEN, or the combination (identical concentration series as above) and assessed at 72 hours by MTS-based viability assay. A mixture of flavopiridol, staurosporine, and velcade was used as a positive control.
Cell synergy studies
Mononuclear cells freshly isolated from an AML patient sample (21-00779) and MOLM14 AML cells were evaluated in the presence of single-agent drug or a 7 × 7 dose matrix (concentration series ranging from 10 μM to 0.0137 μM) and analyzed by MTS-based viability assay at 72 hours. Highest single-agent synergy (HSA), a model that measures synergy as net increase in sensitivity to the combination beyond the most potent single agent, was computed using the “synergyfinder” R package (Bioconductor Release 3.13).
Analysis of clinical and genetic features
Disease-specific panels of clinical, prognostic, genetic, cytogenetic, and immunophenotype characteristics were obtained from patient electronic medical records. Genetic characterization of patient samples included results of a clinical deep-sequencing panel of genes commonly mutated in hematologic malignancies. The association between inhibitor single-agent or combination efficacy (area under the curve [AUC]) and categorical variables was assessed by the Mann-Whitney U test. Correlations between continuous clinical variables and drug sensitivity values were evaluated by Spearman rank correlation. False discovery rate adjustments were applied to P values using the Benjamini-Hochberg adaptive linear step-up method to account for multiple tests being performed.
Gene expression and enrichment analysis
RNA sequencing (RNAseq) analysis was performed as previously described for the Beat AML program.17 RNAseq-based expression data for drug target genes among AML patient samples were compared by immunophenotype or French-American-British (FAB) classification (Mann-Whitney U test). Drug sensitivity was dissected with respect to 6 previously defined gene signatures for hematopoietic cell differentiation states19 following conditional quantile normalization for 225 AML patient samples with AUC values for both drugs and the combination. Cell state gene expression signature associations for the comprehensive Beat AML dataset will be published separately (D.B.; N.L.; Anna Reister Schultz et al., manuscript in preparation). For each single agent and the combination, sensitive and resistant patient samples were defined as those below the 20th and above the 80th percentiles by AUC, respectively. Unobserved covariates for conditional quantile normalization normalized expression were estimated using surrogate variable analysis. The Camera method20 for gene set testing was applied to each of the 6 cell type signatures to test whether the drug-specific resistant vs sensitive surrogate variable analysis–adjusted log fold-change was different for genes within the set compared with those outside the set. Bonferroni corrections were made to gene set test P values within each of the 3 tested drugs. All raw and processed sequencing data, along with relevant clinical annotations, have been submitted to the dbGaP (ncbi.nlm.nih.gov/gap) and Genomic Data Commons (gdc.cancer.gov).
Results and discussion
Evaluation of drug efficacy using an ex vivo assay revealed primary AML patient samples (n = 335) were significantly more sensitive to the combination than to either single agent (P < .0001) (Figure 1A). Among 335 AML patient samples tested, synergy by Highest single-agent (HSA) or Bliss models was evident in 66% and 51% of samples, respectively. Enhanced efficacy and synergy of the combination were also validated across a broader matrix of tested concentrations for each drug using a primary patient sample and MOLM14 AML cells (Figure 1B-D). Based on mean Cmax values for DORA and VEN (2196 ng/mL [4.16 μM] and 2000 ng/mL [2.3 μM], respectively), the majority of AML patient samples tested (312; 93.1%) exhibited an ex vivo 50% inhibitory concentration value for VEN+DORA of <2 μM, suggesting combination efficacy within achievable serum levels. Sensitivity to single agents and the combination was confined to the primary patient leukemic cells, as evidenced from a representative AML sample with matched patient-derived stroma (Figure 1E). Furthermore, neither single agent nor the VEN+DORA combination showed sensitivity on HS-5 stromal cells (Figure 1F); however, both stromal cell types were sensitive to a control inhibitor cocktail.

VEN+DORA demonstrate enhanced efficacy and synergy toward AML leukemic cells. (A) Scatter and boxplot of ex vivo sensitivities for matched samples from 335 unique patients with AML displayed as area under the dose-response curve as a percentage of maximum (AUC % of max) for DORA, VEN, and the combination. n.s., not significant. (B) Highest single-agent synergy surface plot for a 7 × 7 dose matrix of VEN and DORA combinations on primary AML cells from a representative sample (21-00779). Red coloring denotes a positive synergy score. (C) Viability response curves for VEN upon increasing concentrations of DORA in MOLM14 AML cells. Cells were cultured with drug for 72 hours and analyzed by MTS-based assay, normalizing to untreated wells. Mean percent viability ± standard error of the mean for 4 replicates is shown. (D) HSA synergy surface plot for a 7 × 7 dose matrix of VEN and DORA combinations on MOLM14 AML cells from panel B. Red coloring denotes a positive synergy score. (E) Comparison of single-agent and combination sensitivity for matched mononuclear cell (MNCs) and stromal cell populations from a representative patient sample (20-00494). (F) Viability response curves for single agents and the combination in HS-5 stromal cells. A control kill cocktail of flavopiridol + staurosporine + velcade (FSV) was also tested. Mean percent viability for 3 replicates is shown. HSA, highest single-agent.
VEN+DORA demonstrate enhanced efficacy and synergy toward AML leukemic cells. (A) Scatter and boxplot of ex vivo sensitivities for matched samples from 335 unique patients with AML displayed as area under the dose-response curve as a percentage of maximum (AUC % of max) for DORA, VEN, and the combination. n.s., not significant. (B) Highest single-agent synergy surface plot for a 7 × 7 dose matrix of VEN and DORA combinations on primary AML cells from a representative sample (21-00779). Red coloring denotes a positive synergy score. (C) Viability response curves for VEN upon increasing concentrations of DORA in MOLM14 AML cells. Cells were cultured with drug for 72 hours and analyzed by MTS-based assay, normalizing to untreated wells. Mean percent viability ± standard error of the mean for 4 replicates is shown. (D) HSA synergy surface plot for a 7 × 7 dose matrix of VEN and DORA combinations on MOLM14 AML cells from panel B. Red coloring denotes a positive synergy score. (E) Comparison of single-agent and combination sensitivity for matched mononuclear cell (MNCs) and stromal cell populations from a representative patient sample (20-00494). (F) Viability response curves for single agents and the combination in HS-5 stromal cells. A control kill cocktail of flavopiridol + staurosporine + velcade (FSV) was also tested. Mean percent viability for 3 replicates is shown. HSA, highest single-agent.
Consistent with broad efficacy, correlation analysis between patient sensitivity to the combination and standard clinical variables failed to reveal any significant associations (supplemental Figure 1). However, monocyte levels in peripheral blood revealed an opposing association for each single agent, with increased monocytes correlating with DORA sensitivity and also with VEN resistance (Figure 2A). These findings were corroborated by the immunophenotype-based surface expression of CD14, an established marker for monocytes, where DORA and VEN demonstrated increased sensitivity in CD14+ and CD14− patient samples, respectively; combination sensitivity was evident regardless of CD14 surface marker expression (Figure 2B). Expression of additional markers was significantly associated with resistance to VEN (CD11b, CD16, CD56, CD64, HLADR) or sensitivity to VEN (CD117) or DORA (HLADR) (supplemental Figure 2). For 108 patient samples with accompanying FAB designations, sensitivity to the combination was similar across classifications of undifferentiated (M0/M1) through monocytic (M4/M5) leukemia. In contrast, single-agent VEN efficacy was greatest in M0 through M3 samples, unlike DORA, which showed little difference across subgroups (supplemental Figure 3). Of note, M3 AML is confined to cases of acute promyelocytic leukemia, which represents a unique molecular and clinical entity.21 A similar pattern of increased sensitivity in M4/M5 samples was observed for additional p38 inhibitors (supplemental Figure 4). IL-1β, secreted by monocytes and macrophages, has been shown to promote a p38/GATA2-dependent positive feedback loop, enhancing the expression of IL-1β and other proinflammatory mediators in AML.22,23 Moreover, GATA2 is dependent on p38 signaling for its activation and is overexpressed in patients with AML with poor prognosis.23-26 Thus, the dual targeting of BCL2 and p38 signaling may help mitigate disease progression.
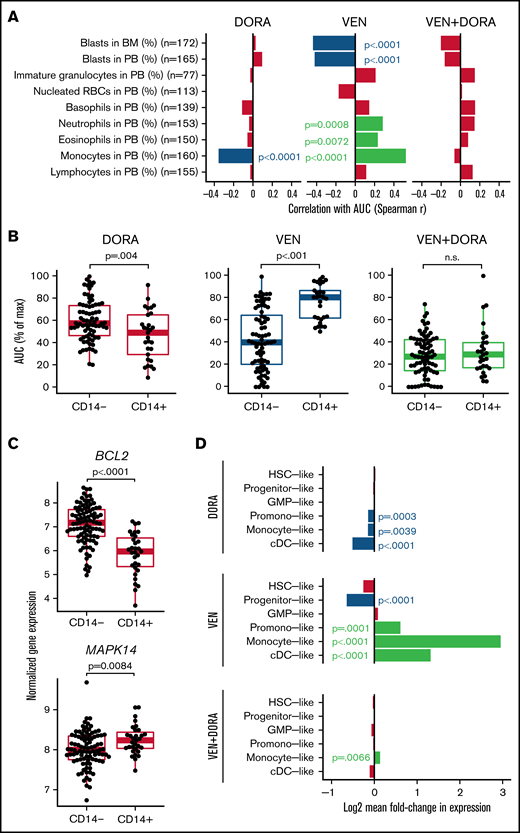
Cell state gene expression signatures distinguish VEN and DORA sensitivities. (A) Spearman correlation of differential cell counts at the time of specimen collection with AUC for DORA, VEN, and the combination. Red-colored bars indicate no statistical significance. (B) Scatter and boxplots of sensitivities with respect to CD14 surface expression for matched samples from 105 AML unique patient samples displayed as AUC (% of maximum) for DORA, VEN, and the combination. (C) Normalized RNAseq-based gene expression levels for BCL2 and MAPK14 relative to surface expression of the monocytic marker CD14. Boxplots indicate the interquartile range. (D) Bar plot depicting log2 mean fold-change in expression for cell differentiation gene sets comparing sensitive (lowest quintile) and resistant (upper quintile) patient samples according to AUC distributions for DORA, VEN, and VEN+DORA. Significant false discovery rate–corrected P values for gene set enrichment are shown. BM, bone marrow; cDC, conventional dendritic cell; GMP, granulocyte-monocyte progenitor; HSC, hematopoietic stem cell; PB, peripheral blood; RBCs, red blood cells.
Cell state gene expression signatures distinguish VEN and DORA sensitivities. (A) Spearman correlation of differential cell counts at the time of specimen collection with AUC for DORA, VEN, and the combination. Red-colored bars indicate no statistical significance. (B) Scatter and boxplots of sensitivities with respect to CD14 surface expression for matched samples from 105 AML unique patient samples displayed as AUC (% of maximum) for DORA, VEN, and the combination. (C) Normalized RNAseq-based gene expression levels for BCL2 and MAPK14 relative to surface expression of the monocytic marker CD14. Boxplots indicate the interquartile range. (D) Bar plot depicting log2 mean fold-change in expression for cell differentiation gene sets comparing sensitive (lowest quintile) and resistant (upper quintile) patient samples according to AUC distributions for DORA, VEN, and VEN+DORA. Significant false discovery rate–corrected P values for gene set enrichment are shown. BM, bone marrow; cDC, conventional dendritic cell; GMP, granulocyte-monocyte progenitor; HSC, hematopoietic stem cell; PB, peripheral blood; RBCs, red blood cells.
Concordant with drug sensitivities associating with CD14 status, expression levels of the gene targets of DORA (MAPK14) and VEN (BCL2) were significantly higher in CD14+ (P = .0084) and CD14− AML samples (P < .0001), respectively (Figure 2C). Similar findings were observed when comparing by FAB designation (supplemental Figure 5). Consistent with previous studies, increased levels of BCL2 are associated with greater sensitivity to VEN; DORA sensitivity was less variable in relation to MAPK14 expression (supplemental Figure 6). However, several p38MAPK-regulated genes showed significantly different expression between CD14+ and CD14− patient samples (supplemental Figure 7). Furthermore, although sensitivity to the combination was not strongly associated with transcriptomic signatures for cell differentiation states representative of AML,19 DORA sensitivity was associated with promonocyte-like, monocyte-like, and conventional dendritic cell–like signatures, whereas VEN sensitivity tracked with progenitor-like signatures. In contrast, promonocyte-like, monocyte-like, and conventional dendritic cell–like differentiation states were enriched for VEN resistance (Figure 2D). As recent studies of VEN sensitivity show reduced efficacy in differentiated leukemias,14-16 combining VEN with an agent that targets this limitation may extend VEN utility and response duration. The enhanced efficacy of the VEN+DORA combination may result from inhibiting p38 MAPK-mediated phosphorylation of BCL2. As phosphorylated BCL2 impedes VEN binding, DORA may increase the abundance of nonphosphorylated BCL2, thereby enhancing VEN sensitivity in a tumor-intrinsic manner.11-13
These results highlight the possibility of leveraging complementary sensitivity profiles of targeted therapies and clinical features obtained as part of standard of care to inform optimal drug combinations. Thus, characterizing critical, targetable pathways in AML may be augmented by consideration of agents that act in concert across the spectrum of leukemic differentiation states.
Acknowledgments
The authors thank the patients for the generous use of their tissue samples, the Massively Parallel Sequencing Shared Resource at Oregon Health & Science University for technical support, and Elie Traer, Jennifer Dunlap, and Marc Loriaux for guidance with FAB classifications.
This work was supported by the Drug Sensitivity and Resistance Network, National Institutes of Health (NIH), National Cancer Institute (NCI) grant U54CA224019, and the Cancer Target Discovery and Development Network grant U01CA217862. This work was additionally supported by the V Foundation for Cancer Research (J.W.T.), the Gabrielle’s Angel Foundation for Cancer Research (J.W.T.), the Anna Fuller Fund (J.W.T.), the Mark Foundation for Cancer Research (J.W.T.), and the Silver Family Foundation (J.W.T.), by grants from the NCI grant R01CA229875-01A1 (A.A.), National Heart, Lung, and Blood Institute grant R01HL155426-01 (A.A.), American Cancer Society RSG-17-187-01-LIB (A.A.), Alex Lemonade/Babich RUNX1 Foundation (A.A.), EvansMDS Foundation (A.A.), and a V Foundation Scholar award (A.A.).
The authors dedicate this study to the spirit of Jacqueline A. Kurtz, whose enduring support continues to inspire.
Authorship
Contribution: S.E.K., C.A.E., N.L., A.K., and B.H.C. performed the investigation; C.A.E., A.K., D.B., O.N., and S.K.M. performed the analysis; S.E.K., C.A.E., J.W.T., and A.A. wrote/edited the paper; J.W.T., B.J.D., and A.A. handled the acquisition of funding; and all authors reviewed the manuscript.
Conflict-of-interest disclosure: B.J.D. serves on scientific advisory boards for Aileron Therapeutics, Therapy Architects (ALLCRON), Cepheid, Vivid Biosciences, Celgene, RUNX1 Research Program, Novartis, Gilead Sciences (inactive), Monojul (inactive); serves on Scientific Advisory Board and receives stock from Aptose Biosciences, Blueprint Medicines, EnLiven Therapeutics, Iterion Therapeutics, Third Coast Therapeutics, GRAIL (inactive on scientific advisory board); is scientific founder of MolecularMD (inactive, acquired by ICON); serves on the board of directors and receives stock from Amgen, Vincera Pharma; serves on the board of directors for Burroughs Wellcome Fund, CureOne; serves on the joint steering committee for Beat AML LLS; is founder of VB Therapeutics; has a sponsored research agreement with EnLiven Therapeutics; receives clinical trial funding from Novartis, Bristol-Myers Squibb, Pfizer. J.W.T. receives research support from Agios, Aptose, Array, AstraZeneca, Constellation, Genentech, Gilead, Incyte, Janssen, Petra, Seattle Genetics, Syros, Tolero, and Takeda. The remaining authors declare no competing financial interests.
Correspondence: Anupriya Agarwal, Oregon Health & Science University, The Knight Cancer Institute, 3181 SW Sam Jackson Park Rd, L592, Portland, OR 97239; e-mail: agarwala@ohsu.edu.

