

Key Points
Induction of Sbds deficiency in recipient BM niche cells impairs efficient engraftment of healthy donor HSC after transplantation.
SBDS deficiency impairs multiple cellular signaling pathways in post-myeloablation marrow niches critical for restoration of hematopoiesis.

Abstract
Bone marrow (BM) niche-derived signals are critical for facilitating engraftment after hematopoietic stem cell (HSC) transplantation (HSCT). HSCT is required for restoration of hematopoiesis in patients with inherited BM failure syndromes (iBMFSs). Shwachman-Diamond syndrome (SDS) is a rare iBMFS associated with mutations in SBDS. Previous studies have demonstrated that SBDS deficiency in osteolineage niche cells causes BM dysfunction that promotes leukemia development. However, it is unknown whether BM niche defects caused by SBDS deficiency also impair efficient engraftment of healthy donor HSC after HSCT, a hypothesis that could explain morbidity noted after clinical HSCT for patients with SDS. Here, we report a mouse model with inducible Sbds deletion in hematopoietic and osteolineage cells. Primary and secondary BM transplantation (BMT) studies demonstrated that SBDS deficiency within BM niches caused poor donor hematopoietic recovery and specifically poor HSC engraftment after myeloablative BMT. We have also identified multiple molecular and cellular defects within niche populations that are driven by SBDS deficiency and are accentuated by or develop specifically after myeloablative conditioning. These abnormalities include altered frequencies of multiple niche cell subsets, including mesenchymal lineage cells, macrophages, and endothelial cells; disruption of growth factor signaling, chemokine pathway activation, and adhesion molecule expression; and p53 pathway activation and signals involved in cell cycle arrest. Taken together, this study demonstrates that SBDS deficiency profoundly impacts recipient hematopoietic niche function in the setting of HSCT, suggesting that novel therapeutic strategies targeting host niches could improve clinical HSCT outcomes for patients with SDS.
Introduction
Maintenance of hematopoietic stem cells (HSC) and downstream regulation of hematopoiesis rely upon tightly orchestrated signals generated from specialized bone marrow (BM) microenvironments known as niches. Studies over the past 2 decades have identified multiple BM niche cells that regulate HSC homeostasis, including mesenchymal stem cells (MSCs), osteolineage cells (OCs), endothelial cells (ECs), adipocytes, macrophages, megakaryocytes, and Schwann cells.1,2 These niche-derived signals not only are important for homeostatic hematopoiesis but also play critical roles in facilitating engraftment after HSC transplantation (HSCT). Murine models in which selected niche components are disrupted demonstrate impaired donor HSC engraftment after HSCT.3,4
Inherited BM failure syndromes (iBMFS) are caused by germline genetic mutations in genes long known to have cell autonomous impacts on HSC and progenitor (HSPC) function. Patients with iBMFS require HSCT for cure of BM failure (BMF) or hematopoietic lineage deficiency, or for prevention/treatment of myelodysplastic syndrome (MDS). Recently, studies using animal models of human iBMFSs have demonstrated that hematopoietic dysfunction may arise as a result of nonautonomous mechanisms resulting from impacts of the underlying germline mutation within BM niche cell populations.5-9 Our group has previously demonstrated that BM niche capacity to engraft healthy donor HSC after transplantation is impaired in some iBMFSs because of mutation effects within niche cells or preexistence of BMF.4,10
SDS is a rare iBMFS caused in most cases by biallelic loss-of-function mutations in genes associated with ribosome maturation, including SBDS (>90% of cases), DNAJC21, and EFL1, or by heterozygous mutations in SRP54.11-15 In addition to exocrine pancreatic dysfunction, patients with SDS develop hematopoietic abnormalities, including BM hypocellularity, neutropenia, and variable thrombocytopenia. Approximately 20% to 25% of patients will develop severe cytopenias associated with BM aplasia, and 36% of patients will develop MDS/leukemia by age 30,16,17 both requiring HSCT for cure. Unfortunately, HSCT for SDS is associated with significant rates of complications, including graft dysfunction, overt graft failure in up to 10% of patients,18 conditioning-associated organ failure, and, for patients with MDS/leukemia, high relapse risk estimated at 20% to 30%.19-21
Skeletal dysplasia and osteopenia are also frequent manifestations of SDS,22 suggesting that bone and OC dysfunction may be linked to hematopoietic dysfunction. Testing this hypothesis, previous studies in mouse models have shown that SBDS deficiency in osteolineage niche cells, but not hematopoietic cells, results in BM dysfunction, including myelodysplasia.5,6,23 No murine models or clinical data to date address whether SBDS deficiency causes BM niche dysfunction that contributes to poor donor engraftment outcomes after HSCT.
Herein we detail development of a mouse model defined by inducible Sbds deletion in BM hematopoietic cells and OCs. Primary and secondary BM transplantation (BMT) studies revealed that SBDS deficiency within BM niches results in poor hematopoietic recovery and specifically poor donor HSC engraftment after myeloablative BMT. We identified molecular and cellular abnormalities driven by SBDS deficiency within post-myeloablation niches associated with this poor engraftment phenotype. These post-BMT conditioning niche abnormalities include altered frequencies of mesenchymal lineage cells, macrophages, and ECs and disruption of molecular signals in the niche, including growth factor signaling, cell adhesion and homing pathways, and cell cycle/cell death pathways. Our study reveals that BMT using traditional myeloablative conditioning is associated with severe BM niche dysfunction in the setting of SBDS deficiency and identifies niche pathways altered by SBDS deficiency that are critical for efficient engraftment after BMT.
Materials and methods
Animals and in vivo treatment
Mouse colonies were maintained under pathogen-free conditions. All experiments were conducted following protocols approved by Children’s Hospital of Philadelphia Institutional Animal Care and Use Committee. Sbdsl/l mice (mice with 2 copies of the Sbdslox allele) were generously provided by Dr. Johanna Rommens (University of Toronto). Other strains were either obtained from public repositories or purchased from Jackson Laboratory and backcrossed onto C57BL/6 background. Mx1creSbdsl/l mice were generated by crossing Mx1cre mice and Sbdsl/l mice, confirming genotypes by polymerase chain reaction (PCR).24 To induce Sbds deletion, polyinosinic-polycytidylic acid (pIpC, Sigma) was injected intraperitoneally (300 μg/mouse) 3 times per week for a minimum of 2 weeks. For green fluorescent protein (GFP)+ donor BM for BMT, transgenic C57BL/6 mice expressing GFP under the H2K promoter (H2K-GFP) were used. Myeloablative total body irradiation (TBI) was performed using the X-RAD 320 (Precision X-ray) to deliver 1100 CGy in 2 fractions at least 3 hours apart.
Single-cell preparations from bone/BM
To prepare single BM cell suspensions, BM was flushed from leg bones, filtered (40-µm mesh) and subjected to red blood cell (RBC) lysis. To prepare single niche cell suspensions after BM flushing, leftover bones were cut into 1- to 2-mm pieces and digested at 37°C for 1 hour with collagenase P (Roche) or collagenase II (Gibco). Collected supernatants were filtered through 100-µm mesh. Cell counts were determined using a hematocytometer and Trypan Blue (Corning).
Quantitative PCR
To measure expression of Sbds transcripts, RNA was isolated from single cell suspensions using RNeasy Mini Kit (Qiagen). First-strand cDNA was synthesized by SuperScript III reverse transcription (Thermo Fisher Scientific). Quantitative PCR (qPCR) was performed on 7500 Fast Real-Time PCR System (Applied Biosystems) with SYBR Green PCR Master Mix (Applied Biosystems). Target-specific primers are described in supplemental Table 1.
Flow cytometry
Flow cytometry analysis was performed on FACSCalibur or FACSJazz (Becton Dickinson). Fluorophore-conjugated antibodies used are listed in supplemental Table 2.
BMT assays
In primary BMT assays, Mx1creSbdsl/l or Sbdsl/l recipients received 1100 cGy TBI followed by 106 GFP+ BM cells from H2K-GFP donors via retro-orbital injection. For competitive secondary BMT assays, 1 week after primary BMT, BM was collected from bilateral femorae/tibiae and pooled from ≥3 primary recipients per group. Pooled primary recipient BM (dose: one-fourth total BM volume collected from 1 primary recipient as detailed previously4,10 ) was injected into irradiated (1100 cGy) wild-type (WT) secondary recipients co-transplanted with GFPneg 2 × 10⁵ WT competitor BM cells. Secondary recipients were assessed 3 to 24 weeks after BMT for GFP+ cell reconstitution in peripheral blood lineages, including RBCs, platelets, Gr1+ myeloid cells, B220+ B cells, and CD3+ T cells.
Histology and immunohistochemistry analysis
Femora and tibiae were fixed in 10% formalin and decalcified by Regular-Cal ImmunoM (BBC Biomedicals). Samples were dehydrated before embedding in paraffin and cut into 5- to 6-µm sections. For general histology analysis, sections were stained with Harris hematoxylin and eosin (Sigma-Aldrich). Immunostaining of PPAR-γ, Caspase-3, and CXCL12 was performed using primary antibodies listed in supplemental Table 2, along with goat anti-rabbit antibody, avidin/biotin, Vector Elite ABC kit, and DAB Substrate (Vector Laboratory) according to manufacturer's instructions. Slides were examined with Zeiss AxioStar Plus and Olympus DP72 microscopic imaging.
Multiplex enzyme-linked immunosorbent assay
After flushing bilateral tibiae and femora in fixed volumes of phosphate-buffered saline (same volume for each sample to enable same dilution comparisons), samples were centrifuged at 400 × g for 5 minutes and BM plasma supernatants were separated. Cell fractions were lysed in phosphate-buffered saline containing 1% Nonidet-P40 (US Biological) and protease inhibitor (Roche). Lysates underwent 3 freeze-thaw cycles followed by centrifugation at 12 000 × g for 5 minutes. BM niche cell lysates were prepared after CD45+ leukocyte depletion using anti-CD45 Microbeads (Miltenyi Biotec). Expression levels of 80 niche proteins were detected by Mouse Cytokine Array Q4 Kit, Mouse Cytokine Array Q5 Kit, and custom-designed Quantibody Mouse Array Kits (RayBiotech).
RNA-seq and bioinformatics analysis
After nonadherent BM was removed by flushing, leg bones were digested by collagenase. The cell suspension from digested bones was pooled together with the BM fraction after CD45+ leukocyte depletion at baseline or after irradiation for RNA-sequencing (seq) analysis. The RNA was extracted from isolated BM and niche cell fractions using RNeasy Mini Kit (Qiagen), and DNA was removed using RNase-Free DNase Set (Qiagen). RNA-seq was performed by BGI Genomics (Hong Kong) on a BGISEQ-500 sequencer. Kallisto was used to perform pseudo-alignment and generated read counts defined as transcripts per million.25 Differential gene expression was analyzed by Deseq2.26 Gene set enrichment analysis (GSEA) (Broad Institute) was performed using MSigDB C2 CP27,28 and canonical pathway gene set collection (1027 gene sets). One thousand permutations were used to perform GSEA. GSEA plots were generated to provide a graphical view of enrichment scores.
Statistical analysis
Most statistical analyses were performed using GraphPad Prism 7.00. Student 2-tailed t-test or χ-squared tests were used to determine statistical significance of 2-group comparisons. For RNA-seq, statistical analysis was performed using the DEseq2 package. Statistical methods for GSEA were performed with GSEA software from Broad Institute, including enrichment score calculation, significance level estimation, and adjustments for multiple hypothesis testing.27 False-discovery rate <0.25 and P value <.05 were used as significance cutoff values.
Results
SBDS deficiency within BM niche cells impairs donor engraftment after BMT
A prior mouse model targeted Sbds deletion in Osterix-expressing osteolineage progenitors.5,6 However, those mice only had a 4-week lifespan because of severe growth/development impairment, preventing that model’s use for studying niche function during HSCT. We thus attempted to target Sbds in mature OCs by crossing previously described Sbdsl/l mice24 with Col1a1Cre+ mice. However, Col1a1CreSbdsExc progeny exhibited embryonic lethality (supplemental Figure 1). We next generated a conditional Sbds deletion mouse model by crossing Sbdsl/l mice with Mx1Cre+ mice and inducing Cre expression in BM hematopoietic cells and Mx1-inducible osteolineage niche cells29 using pIpC (Figure 1A). We first confirmed reduced, but not absent, Sbds gene expression in unsorted whole BM and isolated BM stromal cells from Mx1CreSbdsExc mice 4 weeks after pIpC initiation (Figure 1B; supplemental Figure 2A), similar to hypomorphic expression seen in clinical SDS.30 Compared with controls, pIpC-treated Mx1CreSbdsExc mice develop significantly decreased platelet counts and an inverted myeloid/lymphoid white blood cell ratio in peripheral blood (Figure 1C; supplemental Figure 2B), indicative of stress hematopoiesis. Upon examining BM, both lin-Sca1+cKit+ (LSK) progenitors and long-term (LT) HSC (lin-Sca1+cKit+CD48-CD150+) were markedly reduced within 4 weeks of SBDS deficiency induction by pIpC in Mx1CreSbdsExc mice (Figure 1D-E).
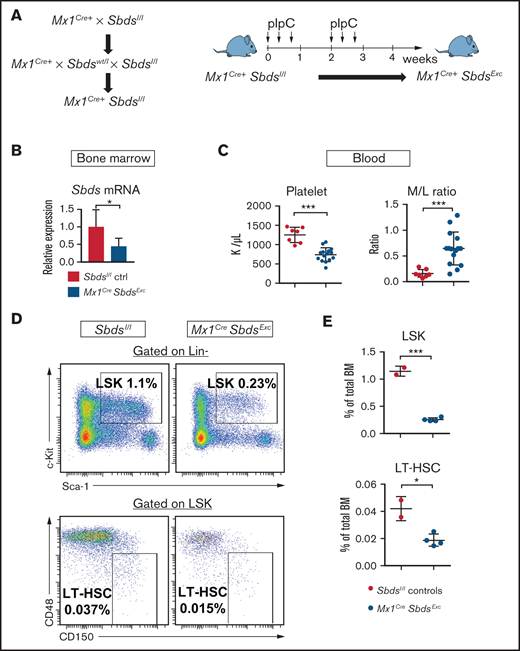
Mice with inducible SBDS deficiency in hematopoietic and osteolineage niche cells develop disrupted hematopoiesis consistent with BM failure. (A) Mx1CreSbdsExc mice were generated by crossing Mx1Cre+ mice with Sbdsl/l mice to generate Mx1Cre+Sbdsl/l mice. Cre expression and Sbds deletion were induced in hematopoietic and Mx1-inducible niche cells by pIpC treatment to create Mx1Cre+SbdsExc mice. (B) After 4 weeks of pIpC treatment, qPCR demonstrated reduced Sbds mRNA expression in flushed BM cells compared with pIpC-treated Sbdsl/l controls. (C) Compared with pIpC-treated control Sbdsl/l mice (n = 7), Mx1CreSbdsExc mice (n = 12) developed reduced platelet counts and an increased peripheral blood myeloid/lymphoid (M/L) cell ratio, consistent with stress hematopoiesis. (D) Representative dot plots showing decreased percentages of lin-Sca1+cKit+ (LSK) cells and CD48-CD150+ long-term HSC (LT-HSC) in total BM of Mx1CreSbdsExc vs control mice after 4 weeks of pIpC treatment. (E) Mx1CreSbdsExc BM (n = 2) shows severe reduction in percentages of LSK and LT-HSC compared with control BM (n = 4). *P < .05; ***P < .001; Student t test.
Mice with inducible SBDS deficiency in hematopoietic and osteolineage niche cells develop disrupted hematopoiesis consistent with BM failure. (A) Mx1CreSbdsExc mice were generated by crossing Mx1Cre+ mice with Sbdsl/l mice to generate Mx1Cre+Sbdsl/l mice. Cre expression and Sbds deletion were induced in hematopoietic and Mx1-inducible niche cells by pIpC treatment to create Mx1Cre+SbdsExc mice. (B) After 4 weeks of pIpC treatment, qPCR demonstrated reduced Sbds mRNA expression in flushed BM cells compared with pIpC-treated Sbdsl/l controls. (C) Compared with pIpC-treated control Sbdsl/l mice (n = 7), Mx1CreSbdsExc mice (n = 12) developed reduced platelet counts and an increased peripheral blood myeloid/lymphoid (M/L) cell ratio, consistent with stress hematopoiesis. (D) Representative dot plots showing decreased percentages of lin-Sca1+cKit+ (LSK) cells and CD48-CD150+ long-term HSC (LT-HSC) in total BM of Mx1CreSbdsExc vs control mice after 4 weeks of pIpC treatment. (E) Mx1CreSbdsExc BM (n = 2) shows severe reduction in percentages of LSK and LT-HSC compared with control BM (n = 4). *P < .05; ***P < .001; Student t test.
We next assessed whether SBDS deficiency within BM niche cell populations impacts capacity of pIpC-treated Mx1CreSbdsExc mice to engraft healthy donor BM and specifically LT-HSC during BMT. We transplanted GFP+ WT donor BM into pIpC-treated Mx1CreSbdsExc mice and Sbdsl/l controls at 24 hours after 1100 cGy myeloablative TBI (Figure 2A). Most (90%) Mx1CreSbdsExc BMT recipients died by day 9 after primary BMT, whereas all control recipients survived (Figure 2B). Inadequate engraftment appeared to be the cause of death in the Mx1CreSbdsExc recipients, demonstrated by the persistence of BM aplasia by histology (Figure 2C) and low BM cell counts (supplemental Figure 2C) at 1 week after BMT, compared with restored BM cellularity seen in control recipients. To test whether BM niche deficits caused by SBDS deficiency specifically impact engraftment of LT-HSC after BMT, we next performed competitive secondary BMT in which BM was harvested from Mx1CreSbdsExc and control primary BMT recipients at 7 days after the primary BMT and transplanted with a fixed dose of competitor WT BM into WT secondary recipients. Secondary recipients of Mx1CreSbdsExc vs littermate control primary recipient BM demonstrated decreased LT GFP+ reconstitution of peripheral blood lineages from 6 to 24 weeks after secondary BMT as well as decreased trilineage GFP+ BM hematopoiesis, indicating that engraftment of both hematopoietic progenitors and HSC was severely impaired in Mx1CreSbdsExc vs littermate control primary recipients (Figure 2D; supplemental Figure 2D).
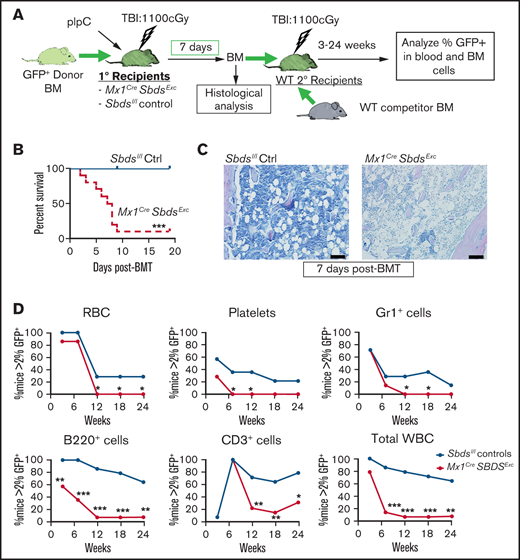
The BM niche of Mx1CreSbdsExc mice exhibits impaired capacity to engraft donor HSC after BMT. (A) Schematic of studies. Mx1CreSbdsExc mice and Sbdsl/l controls received BMT of 106 whole BM from GFP+ donor mice at 24 hours after receiving 1100 cGy of TBI. Donor engraftment in primary BMT recipients was assessed 1 week after primary BMT using histologic analysis and competitive secondary transplantation assays, in which defined volumes (25% of BM volume collected from bilateral hindleg bones) of whole BM from Mx1CreSbdsExc or Sbdsl/l control primary recipients were transplanted with 2 × 10⁵ WT competitor (GFPneg) whole BM cells into irradiated WT secondary recipients. (B) Cumulative survival curves showed increased mortality among Mx1CreSbdsExc recipients (n = 10) after BMT compared with controls (n = 8). ***P < .001; log-rank test. (C) Impaired donor engraftment was seen in Mx1CreSbdsExc primary recipients by hematoxylin and eosin staining at 1 week after BMT. Scale bar: 200 µm. (D) In competitive secondary BMT studies, donor engraftment efficiency in Mx1CreSbdsExc or control (Sbdsl/l) primary recipients (n = 4 mice per group) was assessed by competitive secondary BMT assay. HSC and hematopoietic progenitor engraftment in primary recipient Mx1CreSbdsExc mice was significantly impaired, as indicated by lower GFP+ reconstitution of secondary recipients (n = 14 mice per group) receiving Mx1CreSbdsExc vs control primary recipient BM in all blood lineages, including RBCs, platelets, Gr1+myeloid cells, B220+ B cells, CD3+ T cells, and total white blood cells (WBC). *P < .05; **P < .01; ***P < .001; χ-squared test.
The BM niche of Mx1CreSbdsExc mice exhibits impaired capacity to engraft donor HSC after BMT. (A) Schematic of studies. Mx1CreSbdsExc mice and Sbdsl/l controls received BMT of 106 whole BM from GFP+ donor mice at 24 hours after receiving 1100 cGy of TBI. Donor engraftment in primary BMT recipients was assessed 1 week after primary BMT using histologic analysis and competitive secondary transplantation assays, in which defined volumes (25% of BM volume collected from bilateral hindleg bones) of whole BM from Mx1CreSbdsExc or Sbdsl/l control primary recipients were transplanted with 2 × 10⁵ WT competitor (GFPneg) whole BM cells into irradiated WT secondary recipients. (B) Cumulative survival curves showed increased mortality among Mx1CreSbdsExc recipients (n = 10) after BMT compared with controls (n = 8). ***P < .001; log-rank test. (C) Impaired donor engraftment was seen in Mx1CreSbdsExc primary recipients by hematoxylin and eosin staining at 1 week after BMT. Scale bar: 200 µm. (D) In competitive secondary BMT studies, donor engraftment efficiency in Mx1CreSbdsExc or control (Sbdsl/l) primary recipients (n = 4 mice per group) was assessed by competitive secondary BMT assay. HSC and hematopoietic progenitor engraftment in primary recipient Mx1CreSbdsExc mice was significantly impaired, as indicated by lower GFP+ reconstitution of secondary recipients (n = 14 mice per group) receiving Mx1CreSbdsExc vs control primary recipient BM in all blood lineages, including RBCs, platelets, Gr1+myeloid cells, B220+ B cells, CD3+ T cells, and total white blood cells (WBC). *P < .05; **P < .01; ***P < .001; χ-squared test.
SBDS deficiency alters BM niche cellular composition and niche cell gene expression in response to myeloablative TBI
To define mechanisms by which SBDS deficiency in BM niches impairs HSCT donor engraftment, we compared niche cell populations and niche gene expression in Mx1CreSbdsExc mice vs Sbdsl/l controls after myeloablative TBI (experiment schema in supplemental Figure 3). We first investigated MSC-derived stromal compartments that contribute to BMF and MDS in other models,5,6,8 finding that BM of irradiated Mx1CreSbdsExc mice contains reduced osteoprogenitor cells (OPCs; CD45-TER119-CD31-CD51+Sca-1-) compared with controls (Figure 3A-B), although the OPC percentage was not significantly altered at baseline (supplemental Figure 4A). Percentages of MSC (CD45-TER119-CD31-CD51+Sca-1+) were similar between the two groups (data not shown). RNA-seq analysis revealed that BM stromal cells from irradiated Mx1CreSbdsExc mice and controls expressed similar levels of Runx2 (Figure 3C), which encodes the transcription factor that initially induces osteogenic differentiation of MSC. However, SBDS-deficient BM niche cells expressed higher levels of early osteoblast markers, including Sp7 (Osterix) and Alpl (alkaline phosphatase), as well as terminal osteoblast markers, including Dmp1 and Spp1 (Osteopontin) (Figure 3C-D), suggesting that terminal osteoblast maturation and function may not be impaired by induced SBDS deficiency. Enzyme-linked immunosorbent assay (ELISA) confirmed increased BM osteopontin expression in irradiated Mx1CreSbdsExc mice (Figure 3E). These results suggest that while signals driving osteolineage commitment of MSC remain intact and in some cases are upregulated in SBDS-deficient niches in response to myeloablative TBI, the ability to maintain populations of immature osteolineage-committed progenitor cells after TBI is severely impaired by SBDS deficiency, through either increased terminal differentiation or impaired survival.
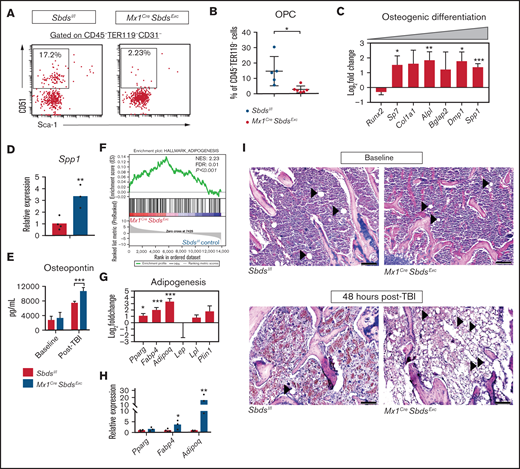
SBDS deficiency in BM niche cells results in decreased OPCs and increased adipocytes in BM after TBI. (A) Representative dot plots show gating strategies used to define CD31-CD51+Sca-1- OPCs in CD45-TER119- BM stromal cells. (B) Mx1CreSbdsExc mice (n = 5) show reduced percentages of OPCs in CD45-TER119- BM stromal cells compared with controls (n = 6) at 24 hours after 1100 cGy TBI. (C) RNA-seq analysis demonstrating changes of mRNA expression in genes critical for osteoblast differentiation in BM stromal cells of irradiated (24 hours after 1100 cGy TBI) Mx1CreSBDSExc vs control mice (n = 5 mice per group). A positive log-fold change in this plot indicates higher expression in Mx1CreSBDSExc stromal cells. (D) qPCR confirms higher expression of the terminal osteoblast marker Spp1 (Osteopontin) in BM niche cells from irradiated (24 hours after 1100 cGy TBI) Mx1CreSbdsExc mice (n = 3) compared with controls (n = 4). (E) ELISA demonstrating increased osteopontin expression in BM plasma supernatants harvested from Mx1CreSBDSExc vs control mice 48 hours after 1100 cGy TBI (n = 5 for Mx1CreSBDSExc group and n = 6 for control group), but similar expression in the two groups at baseline (n = 5 for Mx1CreSBDSExc group; n = 7 for control group). (F) GSEA plot shows upregulation of adipogenesis-related gene expression in the BM stromal cells of irradiated (24 hours after 1100 cGy TBI) Mx1CreSBDSExc mice vs controls (n = 5 mice per group). The green line in the GSEA plot represents the running enrichment score (ES) for the gene set within the ranked list of genes. The value at the peak of the green line is the final ES. The black bars in the middle of the GSEA plot represent where the genes in the gene set appear in the ranked list. NES, normalized enrichment score; FDR, false-discovery rate. (G) Increased mRNA expression of several genes related to adipogenesis, including Pparg, Fabp4, and Adipoq, in the BM stromal cells of irradiated (24 hours after 1100 cGy TBI) Mx1CreSBDSExc mice compared with controls. (H) qPCR confirmed that BM niche cells from irradiated Mx1CreSbdsExc mice (n = 3) exhibit higher expression of Fabp4 and Adipoq, which is critical for adipogenesis, compared with controls (n = 4) at 24 hours after 1100 cGy TBI. (I) Hematoxylin and eosin stains show increased adipocytes in BM from Mx1CreSBDSExc vs control mice at 48 hours after 1100 cGy TBI but not at baseline. Black arrowheads indicate adipocytes. Scale bar: 200 µm. *P < .05; **P < .01; ***P < .001; Student t-test or DESeq2 statistical test.
SBDS deficiency in BM niche cells results in decreased OPCs and increased adipocytes in BM after TBI. (A) Representative dot plots show gating strategies used to define CD31-CD51+Sca-1- OPCs in CD45-TER119- BM stromal cells. (B) Mx1CreSbdsExc mice (n = 5) show reduced percentages of OPCs in CD45-TER119- BM stromal cells compared with controls (n = 6) at 24 hours after 1100 cGy TBI. (C) RNA-seq analysis demonstrating changes of mRNA expression in genes critical for osteoblast differentiation in BM stromal cells of irradiated (24 hours after 1100 cGy TBI) Mx1CreSBDSExc vs control mice (n = 5 mice per group). A positive log-fold change in this plot indicates higher expression in Mx1CreSBDSExc stromal cells. (D) qPCR confirms higher expression of the terminal osteoblast marker Spp1 (Osteopontin) in BM niche cells from irradiated (24 hours after 1100 cGy TBI) Mx1CreSbdsExc mice (n = 3) compared with controls (n = 4). (E) ELISA demonstrating increased osteopontin expression in BM plasma supernatants harvested from Mx1CreSBDSExc vs control mice 48 hours after 1100 cGy TBI (n = 5 for Mx1CreSBDSExc group and n = 6 for control group), but similar expression in the two groups at baseline (n = 5 for Mx1CreSBDSExc group; n = 7 for control group). (F) GSEA plot shows upregulation of adipogenesis-related gene expression in the BM stromal cells of irradiated (24 hours after 1100 cGy TBI) Mx1CreSBDSExc mice vs controls (n = 5 mice per group). The green line in the GSEA plot represents the running enrichment score (ES) for the gene set within the ranked list of genes. The value at the peak of the green line is the final ES. The black bars in the middle of the GSEA plot represent where the genes in the gene set appear in the ranked list. NES, normalized enrichment score; FDR, false-discovery rate. (G) Increased mRNA expression of several genes related to adipogenesis, including Pparg, Fabp4, and Adipoq, in the BM stromal cells of irradiated (24 hours after 1100 cGy TBI) Mx1CreSBDSExc mice compared with controls. (H) qPCR confirmed that BM niche cells from irradiated Mx1CreSbdsExc mice (n = 3) exhibit higher expression of Fabp4 and Adipoq, which is critical for adipogenesis, compared with controls (n = 4) at 24 hours after 1100 cGy TBI. (I) Hematoxylin and eosin stains show increased adipocytes in BM from Mx1CreSBDSExc vs control mice at 48 hours after 1100 cGy TBI but not at baseline. Black arrowheads indicate adipocytes. Scale bar: 200 µm. *P < .05; **P < .01; ***P < .001; Student t-test or DESeq2 statistical test.
GSEA demonstrated that Sbds deletion in post-TBI BM niche cells caused upregulation in gene expression associated with adipogenesis, including upregulation of Pparg, Fabp4, and Adipoq (Figure 3F-H; supplemental Table 3). Notably, GSEA did not detect alteration of adipogenesis pathways in Mx1CreSbdsExc mice at baseline (supplemental Figure 4B), suggesting that TBI induced a proadipogenic state in Mx1CreSbdsExc mice. Indeed, we identified increased adipocytes in BM sections of Mx1CreSbdsExc mice at 48 hours after TBI but not at baseline (Figure 3I). Most adipocytes in irradiated Mx1CreSbdsExc BM are PPAR-γ-positive (supplemental Figure 4C). Because previous studies have implicated BM adipocytes as the negative regulators of HSC engraftment,31 increased adipogenic differentiation of BM niche MSC may contribute to poor niche-mediated donor engraftment resulting from SBDS deficiency.
In contrast, ECs comprised a significantly lower fraction of surviving niche cells in irradiated Mx1CreSbdsExc vs control BM (supplemental Figure 5A-B), notable because sinusoidal EC regeneration mediated by vascular endothelial growth factor receptor 2 (VEGFR2) signaling is essential for HSC engraftment after HSCT.32 While VEGF-A protein levels in BM plasma supernatants were increased after TBI compared with baseline in both groups, Mx1CreSbdsExc BM exhibited a trend (P = .15) toward less TBI-driven increase than seen in control BM (supplemental Figure 5C). GSEA of RNA-seq data showed that while at baseline VEGF signaling pathway genes are markedly upregulated in the BM of Mx1CreSbdsExc mice vs controls, BM stromal cells of irradiated Mx1CreSbdsExc mice exhibit overall downregulation of the VEGF signaling pathway compared with controls (supplemental Figure 5D; supplemental Table 3). However, when examining expression of individual VEGF pathway genes within niche cells after irradiation, SBDS deficiency appears to have a complex effect, increasing expression of genes such as Kdr, which encodes VEGFR2, while decreasing expression of other downstream mediators (supplemental Figure 5E).
BM niche macrophages also critically regulate HSC maintenance.33 CD11b+F4/80+Ly6G- macrophages were significantly increased in irradiated Mx1CreSbdsExc BM niches compared with controls, in contrast to decreased surviving granulocytes seen in Mx1CreSbdsExc BM 24 hours after TBI (supplemental Figure 6A-B). RNA-seq confirmed higher expression of niche macrophage markers, including Vcam-1, Slglec1 (CD169), and Ackr1 (CD234),33 in irradiated Mx1CreSbdsExc vs control niche cell populations (supplemental Figure 6C). Interestingly, despite increased expression of genes involved in phagocytic pathways at baseline and increased frequency of HSC niche macrophages after TBI in SBDS-deficient mice, GSEA of RNA-seq revealed significantly downregulated expression of FcγR-mediated phagocytosis pathway genes in irradiated Mx1CreSbdsExc BM niches (supplemental Figure 6D; supplemental Table 3) compared with controls, suggesting that SBDS deficiency alters functions of niche macrophages after TBI.
SBDS deficiency within BM niche cells diminishes gene expression downstream of IGF-1 signaling
Our previous studies demonstrated that BM niche insulin-like growth factor-1 receptor(IGF-1R) signaling is essential for osteolineage niche cell expansion after TBI and efficient donor HSC engraftment.34 IGF-1/IGF-2 signaling pathways in the BM microenvironment also regulate homeostatic HSC function,35,36 as prior studies have shown that IGFBP-2 and IGFBP-3 support HSC survival and inhibit OPC differentiation.37-39 Compared with controls, BM plasma supernatants from Mx1CreSbdsExc mice contained higher levels of IGF-1 at baseline but decreased levels of IGF-1 after TBI (Figure 4A). Protein levels of IGFBP-2 and IGFBP-3 were similar in Mx1CreSbdsExc mice vs controls at baseline, but Mx1CreSbdsExc BM exhibited increased levels of IGFBP-2 and IGFBP-3 after TBI (Figure 4A). Although baseline mRNA expression in IGF-1 pathway genes was similar with or without SBDS deficiency (supplemental Figure 7), RNA-seq analysis, GSEA, and qPCR of BM niche cells from irradiated Mx1CreSbdsExc vs control mice demonstrated upregulated mRNA expression of upstream IGF-1 pathway factors Igf1, Igfbp2, and Igfbp3 but downregulated expression of downstream IGF-1 pathway signaling factors (Figure 4B-D). This downregulation of downstream IGF-1 signaling genes after TBI suggests that SBDS deficiency may impair this survival signal critical for OPC niche functions after HSCT.
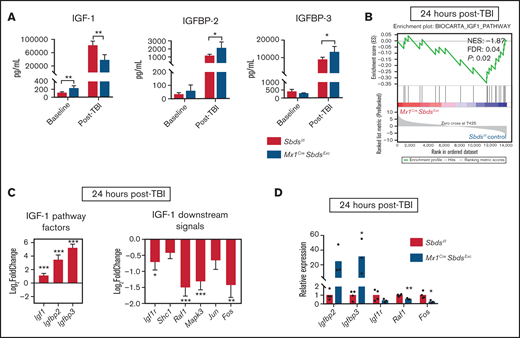
SBDS deficiency within BM niche cells diminishes gene expression downstream of IGF-1 signaling. (A) Protein expression of IGF-1, IGFBP-2, and IGFBP-3 in BM supernatants harvested from Mx1CreSBDSExc and control mice at baseline and 48 hours after 1100 cGy TBI (n ≥ 5 per group). *P < .05; **P < .01; Student t-test. (B) GSEA plot showing statistically significant alterations in IGF-1 signaling pathway gene expression in BM stromal cells from Mx1CreSBDSExc mice vs controls 24 hours after TBI (n = 5 per group). (C) Upregulation of upstream and downregulation of downstream signaling genes within the IGF-1 pathway in the BM stromal cells of irradiated Mx1CreSBDSExc mice compared with controls. *P < .05; **P < .01; ***P < .001; DESeq2 statistical test. (D) qPCR validation confirms that BM niche cells from Mx1CreSbdsExc mice (n = 3) at 24 hours after 1100 cGy TBI show increased expression of IGF-1 factor genes Igfbp2 and Igfbp3, along with decreased expression of downstream IGF-1 signaling pathway genes, including Raf1 and Fos, compared with irradiated controls (n = 4). *P < .05; **P < .01; Student t-test.
SBDS deficiency within BM niche cells diminishes gene expression downstream of IGF-1 signaling. (A) Protein expression of IGF-1, IGFBP-2, and IGFBP-3 in BM supernatants harvested from Mx1CreSBDSExc and control mice at baseline and 48 hours after 1100 cGy TBI (n ≥ 5 per group). *P < .05; **P < .01; Student t-test. (B) GSEA plot showing statistically significant alterations in IGF-1 signaling pathway gene expression in BM stromal cells from Mx1CreSBDSExc mice vs controls 24 hours after TBI (n = 5 per group). (C) Upregulation of upstream and downregulation of downstream signaling genes within the IGF-1 pathway in the BM stromal cells of irradiated Mx1CreSBDSExc mice compared with controls. *P < .05; **P < .01; ***P < .001; DESeq2 statistical test. (D) qPCR validation confirms that BM niche cells from Mx1CreSbdsExc mice (n = 3) at 24 hours after 1100 cGy TBI show increased expression of IGF-1 factor genes Igfbp2 and Igfbp3, along with decreased expression of downstream IGF-1 signaling pathway genes, including Raf1 and Fos, compared with irradiated controls (n = 4). *P < .05; **P < .01; Student t-test.
BM niche SBDS deficiency during myeloablative TBI induces chemokine and adhesion molecule expression that favors inflammatory cell homing and impairs HSPC trafficking to BM
Chemokines and adhesion molecules play critical roles in donor HSC homing and retention within BM niches after HSCT. Hypothesizing that engraftment deficits in Mx1CreSbdsExc mice may be due to impaired chemokine and adhesion molecule pathways, we tested the effect of SBDS deficiency on 20 BM chemokines levels before and after TBI using multiplex ELISA (Figure 5A-B; supplemental Table 4). Although baseline chemokine levels were not altered by SBDS deficiency, 48 hours after irradiation, Mx1CreSbdsExc vs control BM demonstrated markedly reduced levels of 4 chemokines, including CXCL1, CXCL9, CXCL12, and CCL22, and elevated expression of 3 proinflammatory chemokines: CXCL13, CCL3, and CCL9 (Figure 5A-B). The upregulation of proinflammatory chemokines, particularly CCL3, in BM of irradiated Mx1CreSbdsExc mice may drive recruitment of proinflammatory macrophages and promote an inflammatory state that impairs normal hematopoiesis.40-43 Notably, CXCL12 plays well-described critical roles driving engraftment of CXCR4-expressing donor HSC within BM niches after HSCT. CXCL12 is expressed by several cell populations within the marrow niche,2 including OCs and ECs that were reduced in Mx1CreSbdsExc BM after TBI (Figure 3; supplemental Figure 5). We assessed localization of BM CXCL12 expression changes caused by SBDS deficiency after TBI using immunohistochemistry (Figure 5C). Control mice exhibited foci of high CXCL12 levels, colocalizing with large cells possessing the morphologic appearance of megakaryocytes, which are CXCL12-responsive niche cells that survive TBI for several days and promote engraftment after BMT.4 In contrast, these clusters of high CXCL12 expression were absent in Mx1CreSbdsExc BM (Figure 5C), correlating with a trend toward reduction in surviving megakaryocytes in post-TBI Mx1CreSbdsExc BM (Figure 5D; P = .06). Reduced CXCL1 expression in post-TBI Mx1CreSbdsExc BM may also contribute to engraftment deficits. In a zebrafish model, CXCR1 ligands (of which mouse CXCL1 is a homolog44 ) play key supportive roles promoting donor HSPC engraftment.45,46
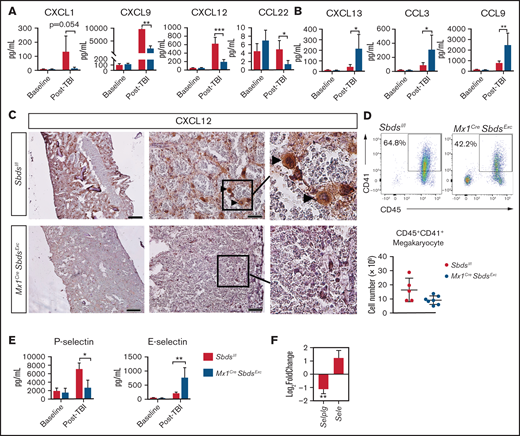
SBDS deficiency induces altered BM niche expression of chemokines and selectins after TBI that favor inflammatory cell recruitment. (A) CXCL1, CXCL9, CXCL12, and CCL22 expression by ELISA, demonstrating reductions in all 4 chemokines in BM plasma supernatants of Mx1CreSbdsExc (n = 5) vs control mice (n = 6) 48 hours after 1100-cGy TBI. (B) CXCL13, CCL3, and CCL9 expression by ELISA demonstrating increases in these proinflammatory chemokines in BM plasma harvested from Mx1CreSBDSExc (n = 5) vs controls (n = 6) at 48 hours after 1100-cGy TBI. (C) Immunohistochemistry staining demonstrates lower CXCL12 expression in BM from Mx1CreSbdsExc mice compared with controls at 48 hours after 1100-cGy TBI. Arrowheads indicate CXCL12-positivity surrounding megakaryocytes. Scale bar: 500 µm for the first column and 50 µm for the second column. (D) Representative dot plots (top) show gating strategies used to define CD45+CD41+ megakaryocytes in post-TBI BM. Mx1CreSBDSExc mice (n = 5) exhibit a trend toward decreased numbers of CD45+CD41+ megakaryocytes in the BM niche than controls (n = 7) at 24 hours after 1100-cGy TBI (bottom). P = 0.06; Student t-test. (E) P- and E-selectin levels by ELISA in BM cell lysates and BM supernatants, respectively, demonstrating lower P-selectin but higher E-selectin levels in Mx1CreSbdsExc (n = 5) vs control mice (n = 6) 48 hours after 1100-cGy TBI. (F) mRNA expression of Selplg (encodes P-selectin) and Sele (encodes E-selectin) in BM stromal cells of irradiated (24 hours after 1100-cGy TBI) Mx1CreSBDSExc mice compared with controls (n = 5 mice per group). *P < .05; **P < .01; ***P < .001; Student t-test used for ELISA data or DESeq2 statistical test for RNA-seq data.
SBDS deficiency induces altered BM niche expression of chemokines and selectins after TBI that favor inflammatory cell recruitment. (A) CXCL1, CXCL9, CXCL12, and CCL22 expression by ELISA, demonstrating reductions in all 4 chemokines in BM plasma supernatants of Mx1CreSbdsExc (n = 5) vs control mice (n = 6) 48 hours after 1100-cGy TBI. (B) CXCL13, CCL3, and CCL9 expression by ELISA demonstrating increases in these proinflammatory chemokines in BM plasma harvested from Mx1CreSBDSExc (n = 5) vs controls (n = 6) at 48 hours after 1100-cGy TBI. (C) Immunohistochemistry staining demonstrates lower CXCL12 expression in BM from Mx1CreSbdsExc mice compared with controls at 48 hours after 1100-cGy TBI. Arrowheads indicate CXCL12-positivity surrounding megakaryocytes. Scale bar: 500 µm for the first column and 50 µm for the second column. (D) Representative dot plots (top) show gating strategies used to define CD45+CD41+ megakaryocytes in post-TBI BM. Mx1CreSBDSExc mice (n = 5) exhibit a trend toward decreased numbers of CD45+CD41+ megakaryocytes in the BM niche than controls (n = 7) at 24 hours after 1100-cGy TBI (bottom). P = 0.06; Student t-test. (E) P- and E-selectin levels by ELISA in BM cell lysates and BM supernatants, respectively, demonstrating lower P-selectin but higher E-selectin levels in Mx1CreSbdsExc (n = 5) vs control mice (n = 6) 48 hours after 1100-cGy TBI. (F) mRNA expression of Selplg (encodes P-selectin) and Sele (encodes E-selectin) in BM stromal cells of irradiated (24 hours after 1100-cGy TBI) Mx1CreSBDSExc mice compared with controls (n = 5 mice per group). *P < .05; **P < .01; ***P < .001; Student t-test used for ELISA data or DESeq2 statistical test for RNA-seq data.
Endothelial expression of selectins also regulates HSC and inflammatory cell homing to BM niches.2 After TBI, Mx1CreSbdsExc BM niche cells exhibited lower P-selectin and higher E-selectin protein and mRNA expression vs controls (Figure 5E-F). Because P-selectin expression on BM ECs is critical for constitutive HSPC homing47 but endothelial E-selectin promotes homing of inflammatory cells and increases HSC proliferation at the expense of self-renewal,48 dysregulated selectin expression in BM niche cells caused by SBDS deficiency may synergize with alterations in chemokine expression (Figure 5A-B) to promote inflammatory cell recruitment to BM at the expense of hematopoietic engraftment.
BM niche cells from Mx1CreSbdsExc mice demonstrate dysregulated ribosomal protein gene expression and P53 pathway activation after TBI
Multiple studies have demonstrated that aberrant p53 activation caused by ribosomal protein mutations is a critical driver of lineage-specific cell dysfunction in SDS and other ribosomopathies.6,49 GSEA detected an overall downregulation in expression of genes critical for ribosomal biogenesis and protein translation in Mx1CreSbdsExc vs BM niche cells after myeloablative TBI (Figure 6A) but not in unirradiated BM stromal cells (supplemental Figure 8A). However, expression differences caused by SBDS deficiency in individual ribosomal genes after irradiation were in most cases not statistically significant (supplemental Figure 8B-C). Increased activation of p53 signaling pathways and upregulated expression of p53 target genes were seen in BM niche cells from Mx1CreSbdsExc vs control mice after TBI (Figure 6B-D; supplemental Table 3). In contrast, GSEA did not reach statistical significance comparing overall p53 pathway expression activation in unirradiated Mx1CreSbdsExc vs control niche cells at baseline (supplemental Figure 8D). SBDS deficiency caused downregulation of genes involved in G1/S transition and DNA synthesis in S-phase in the BM niche of Mx1CreSbdsExc mice both after radiation and at baseline (supplemental Figure 8E-F). These results suggest that baseline impairment in cell cycle transition within SBDS-deficient BM niche cells is exacerbated by ribosomal dysfunction-induced upregulation of p53 pathways after myeloablative conditioning. Higher percentages of apoptotic cells (Caspase-3+) were also seen in the irradiated Mx1CreSbdsExc BM niche environment 48 hours after TBI (supplemental Figure 8G). Thus, cell cycle arrest and increased apoptosis within stromal cell populations may consequently impair niche capacity to efficiently engraft HSC after BMT.
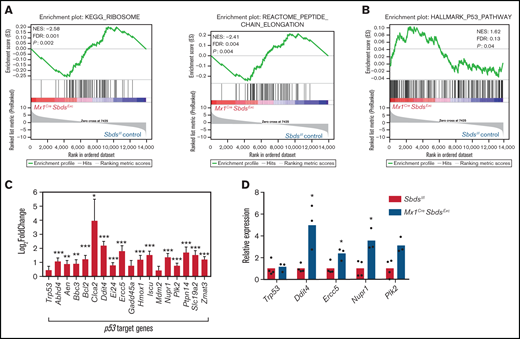
SBDS deficiency increases activation of p53 pathways in BM niche cells after myeloablative TBI. (A) GSEA plot showing overall downregulated expression of ribosomal proteins (left) and genes associated with peptide chain elongation (right) in BM stromal cells from irradiated (24 hours after 1100-cGy TBI) Mx1CreSBDSExc mice vs irradiated controls. (B) GSEA plot shows overall increased activation of the p53 pathway in BM niches of irradiated Mx1CreSBDSExc vs control mice (n = 5 mice per group). (C) Expression of individual p53 target genes is upregulated in BM niches of irradiated Mx1CreSBDSExc vs control mice (n = 5 mice per group). FDR, false-discovery rate; NES, normalized enrichment score. *P < .05; **P < .01; ***P < .001; DESeq2 statistical test. (D) qPCR confirms upregulation of these p53 target genes in BM niche cells taken from irradiated Mx1CreSBDSExc (n = 3) vs control mice (n = 4) at 24 hours after 1100-cGy TBI. *P < .05; Student t-test.
SBDS deficiency increases activation of p53 pathways in BM niche cells after myeloablative TBI. (A) GSEA plot showing overall downregulated expression of ribosomal proteins (left) and genes associated with peptide chain elongation (right) in BM stromal cells from irradiated (24 hours after 1100-cGy TBI) Mx1CreSBDSExc mice vs irradiated controls. (B) GSEA plot shows overall increased activation of the p53 pathway in BM niches of irradiated Mx1CreSBDSExc vs control mice (n = 5 mice per group). (C) Expression of individual p53 target genes is upregulated in BM niches of irradiated Mx1CreSBDSExc vs control mice (n = 5 mice per group). FDR, false-discovery rate; NES, normalized enrichment score. *P < .05; **P < .01; ***P < .001; DESeq2 statistical test. (D) qPCR confirms upregulation of these p53 target genes in BM niche cells taken from irradiated Mx1CreSBDSExc (n = 3) vs control mice (n = 4) at 24 hours after 1100-cGy TBI. *P < .05; Student t-test.
Discussion
Although BMF in iBMFSs has long been attributed to HSPC-intrinsic impacts of causative germline gene mutations, increasing evidence suggests that impacts of these mutations on cells comprising BM microenvironmental niches also contribute to BMF.4-9 Because SDS and other iBMFSs require HSCT to cure hematologic aspects of these diseases and because cytotoxic conditioning may exacerbate niche dysfunction caused by iBMFS-associated gene mutations, it is critical to understand pathophysiologic mechanisms by which BM niche capacity to engraft donor HSC is disrupted in iBMFSs. Because gene therapy approaches and novel nongenotoxic conditioning approaches are under development for iBMFSs,50-52 better understanding of BM niche function intrinsic to certain gene mutations is critical for identifying optimal curative therapy approaches for iBMFSs.
We developed a murine model of SDS through conditional knockout of Sbds in Mx1-inducible hematopoietic and osteolineage niche cells to study SBDS-deficient BM niche function during HSCT. We demonstrated that SBDS-deficient BM niches possess reduced capacity to engraft healthy donor HSC after transplantation. SBDS deficiency during myeloablative TBI led to marked alterations of BM niche cell composition, including increased adipocytes and macrophages and reduced OPCs and ECs. After myeloablative TBI, SBDS deficiency in BM niche cells disrupted IGF-1 signaling needed for OC remodeling of endosteal niches, decreased expression of chemokines and adhesion molecules known to drive HSC and progenitor cell homing to BM, and produced gene expression changes associated with ribosomal dysfunction, p53 activation, and increased cell cycle arrest in niche cells. Although future functional studies are needed to define relative contributions of gene expression changes in each of these pathways to niche-mediated engraftment deficits in this model, the diversity of pathways disrupted suggests that targeted correction of just one of these pathways may not be sufficient to restore donor HSC engraftment efficiency.
We used an inducible SDS mouse model to study BM niche deficits during HSCT because constitutive Sbds knockout models, including the Col1a1CreSbdsExc model we initially attempted, have phenotypes too severe to allow for HSCT studies. This Mx1CreSbdsExc has limitations in recapitulating human SDS, including the lack of developmental effects of SBDS deficiency, given that Cre recombinase activity was not induced until 6 weeks of age. Mx1CreSbdsExc also did not develop neutropenia as is seen in human SDS, although absence of neutropenia has also been a feature of other murine SDS models.5
High mortality after receiving BMT in our SBDS-deficient mice may be fully explained by the graft failure phenotype we identified, but it is important to point out that we cannot exclude the possibility that alterations in other organ function after TBI could contribute to BMT-associated mortality in SBDS-deficient recipients.53 Whereas reduced intensity conditioning, and not myeloablative TBI, is typically used as conditioning for HSCT in patients with SDS,18 we chose myeloablative TBI as HSCT conditioning to define the maximal impact of conditioning on BM niche dysfunction in the setting of SBDS deficiency. Deficits seen in this study will serve as a benchmark for planned future studies to compare relative toxicities to BM niches induced by less intensive conditioning approaches, including non–TBI-based approaches.
Because of low survival rates of Mx1CreSbdsExc recipients beyond 1 week after BMT, we could not determine whether poor niche function would result in permanent graft failure or delayed engraftment were the mice to survive the short-term consequences of prolonged aplasia, including severe anemia, bleeding, and infections. Although rates of graft failure are significant in clinical HSCT for SDS, most patients ultimately do engraft, suggesting that if similar niche dysfunction exists in human SDS, supportive care enables survival until engraftment ultimately occurs.
Previous studies demonstrated that Mx1-induced cells in BM stroma are restricted to osteolineage progenitor cells.29 Therefore, targeting Sbds deletion using Mx1-Cre impacts niche function through cell autonomous function of osteolineage progenitors and nonautonomous effects on other niche cells. Our data indicate that Mx1CreSbdsExc niches contain decreased OPCs after TBI but, interestingly, increased expression of genes required for terminal OPC differentiation. Although terminally differentiated osteoblasts may negatively regulate HSC pool size through production of osteopontin,47,54 immature OPCs produce CXCL12 and other factors that promote HSC engraftment. The decrease in OCs after TBI caused by SBDS deficiency correlated with expansion of adipocytes known to inhibit efficient HSC engraftment,31 reduction in BM EC that may also impair HSC engraftment,32 and increased macrophages likely recruited through BM upregulation of proinflammatory chemokines (CCL3) and adhesion molecules (E-selectin) that may reduce survival and self-renewal of donor HSC.48
Finally, similar to the pathogenesis of BMF in SDS,6 we found that SBDS deficiency in BM niche cells after TBI led to increased p53 activation and cell cycle arrest gene expression. Downregulation of ribosomal protein expression caused by SBDS deficiency in Mx1-inducible OPCs was the likely trigger of p53 pathway upregulation. Ribosomal dysfunction caused by SBDS deficiency may also impair poor engraftment through reduced protein expression of niche factors, such as CXCL12, due to broadly impaired protein translation.55
Taken together, our study demonstrates that the cell autonomous defects induced by SBDS deficiency within osteolineage niche cells disrupt multiple cellular and molecular elements in the BM microenvironment (Figure 7), ultimately leading to reduced BM niche capacity to engraft donor HSC during HSCT. Further studies are needed to define the relative contribution of these multiple affected pathways toward impaired donor engraftment and develop therapeutic strategies that target these pathways to improve engraftment outcomes.
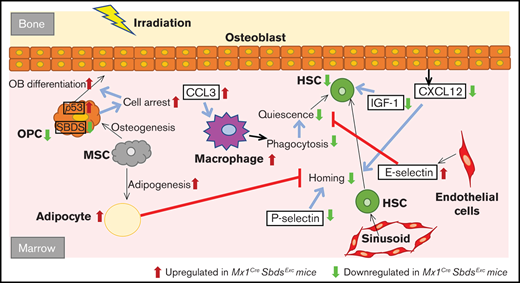
Schematic of how SBDS deficiency in the Mx1CreSBDSExc model impacts BM niche cell composition and gene expression in response to myeloablative irradiation, leading to impaired niche capacity to engraft donor HSC after HSCT. Our studies support a model by which Sbds knockdown in Mx1-inducible osteolineage niche cells impairs donor HSC engraftment after TBI. SBDS deficiency in osteoprogenitors causes ribosomal dysfunction, p53 pathway activation, and cell cycle arrest, which impairs the ability of these OCs to proliferate in response to IGF-1 and other growth factor signals after TBI and, consequently, to support donor hematopoiesis. Because of cell intrinsic or extrinsic mechanisms, SBDS deficiency in niche cells also increases adipocytes and decreases EC survival in the BM microenvironment after TBI, both of which may impair donor engraftment after HSCT. Decreased osteoprogenitor-derived CXCL12 and endothelial P-selectin expression may limit HSC homing and lodgment within BM niches after TBI. Elevation of CCL3 and endothelial E-selectin drives recruitment of inflammatory macrophages after TBI. The resulting proinflammatory environment may further disrupt engraftment and maintenance of donor HSPC.
Schematic of how SBDS deficiency in the Mx1CreSBDSExc model impacts BM niche cell composition and gene expression in response to myeloablative irradiation, leading to impaired niche capacity to engraft donor HSC after HSCT. Our studies support a model by which Sbds knockdown in Mx1-inducible osteolineage niche cells impairs donor HSC engraftment after TBI. SBDS deficiency in osteoprogenitors causes ribosomal dysfunction, p53 pathway activation, and cell cycle arrest, which impairs the ability of these OCs to proliferate in response to IGF-1 and other growth factor signals after TBI and, consequently, to support donor hematopoiesis. Because of cell intrinsic or extrinsic mechanisms, SBDS deficiency in niche cells also increases adipocytes and decreases EC survival in the BM microenvironment after TBI, both of which may impair donor engraftment after HSCT. Decreased osteoprogenitor-derived CXCL12 and endothelial P-selectin expression may limit HSC homing and lodgment within BM niches after TBI. Elevation of CCL3 and endothelial E-selectin drives recruitment of inflammatory macrophages after TBI. The resulting proinflammatory environment may further disrupt engraftment and maintenance of donor HSPC.
Acknowledgments
The authors gratefully acknowledge Johanna Rommens for providing Sbdslox/lox mice and Peter Kurre for collaborative intellectual contributions to experiment design and manuscript review.
This work was supported by the National Heart, Lung, and Blood Institute, National Institutes of Health (grant K08HL122306), the American Society of Hematology Scholar Award, the Hyundai Hope on Wheels Scholar Hope Award, the W.W. Smith Charitable Foundation (T.S.O.), the Cure Childhood Cancer Foundation Cure Research Grant (T.S.O. and J.Z.), and National Heart, Lung, and Blood Institute, National Institutes of Health (grant K08HL132101) (D.V.B.).
Authorship
Contribution: J.Z. and T.S.O. conceived the studies, oversaw and personally performed the experiments, analyzed data, and wrote the manuscript; L.K.K. oversaw animal husbandry and assisted in conducting experiments; Y.B.S., X.Q., and J.-M.F. provided critical technical assistance in conducting experiments; H.M.X. and B.E. helped design and perform analysis for RNA-seq expression data; and D.V.B. critically reviewed studies in progress, contributed to manuscript editing, and provided valuable intellectual input to troubleshoot experiments and experimental design.
Conflict-of-interest disclosure: The authors declare no competing financial interests.
Correspondence: Timothy S. Olson, Blood and Marrow Transplant Program, Cell Therapy and Transplant Section, Children’s Hospital of Philadelphia, Colket Translational Research Building, #3010, 3501 Civic Center Blvd, Philadelphia, PA 19104; e-mail: olsont@chop.edu.

