

Key Points
Talquetamab, the new GPRC5DxCD3 bispecific antibody, actively kills GPRC5D+ MM cell lines and primary MM cells in vitro.
Tumor and immune characteristics (eg, GPRC5D expression level, effector:target ratio, Treg count) are determinants of ex vivo response.

Abstract
Cell surface expression levels of GPRC5D, an orphan G protein–coupled receptor, are significantly higher on multiple myeloma (MM) cells, compared with normal plasma cells or other immune cells, which renders it a promising target for immunotherapeutic strategies. The novel GPRC5D-targeting T-cell redirecting bispecific antibody, talquetamab, effectively kills GPRC5D+ MM cell lines in the presence of T cells from both healthy donors or heavily pretreated MM patients. In addition, talquetamab has potent anti-MM activity in bone marrow (BM) samples from 45 patients, including those with high-risk cytogenetic aberrations. There was no difference in talquetamab-mediated killing of MM cells from newly diagnosed, daratumumab-naïve relapsed/refractory (median of 3 prior therapies), and daratumumab-refractory (median of 6 prior therapies) MM patients. Tumor cell lysis was accompanied by T-cell activation and degranulation, as well as production of pro-inflammatory cytokines. High levels of GPRC5D and high effector:target ratio were associated with improved talquetamab-mediated lysis of MM cells, whereas an increased proportion of T cells expressing PD-1 or HLA-DR, and elevated regulatory T-cell (Treg) counts were associated with suboptimal killing. In cell line experiments, addition of Tregs to effector cells decreased MM cell lysis. Direct contact with bone marrow stromal cells also impaired the efficacy of talquetamab. Combination therapy with daratumumab or pomalidomide enhanced talquetamab-mediated lysis of primary MM cells in an additive fashion. In conclusion, we show that the GPRC5D-targeting T-cell redirecting bispecific antibody talquetamab is a promising novel antimyeloma agent. These results provide the preclinical rationale for ongoing studies with talquetamab in relapsed/refractory MM.
Introduction
The introduction of proteasome inhibitors (PIs), immunomodulatory drugs (IMiDs) and CD38-targeting antibodies has substantially improved the outcome of multiple myeloma (MM) patients over the last two decades.1 However, patients who become refractory to these therapies (triple-class refractory) have a very poor outcome.2 New drugs, such as Selinexor and iberdomide, have shown activity in this extensively pretreated group of patients.3,4 Several other promising novel agents are targeting B-cell maturation antigen (BCMA), a member of the tumor necrosis factor (TNF) receptor superfamily that is highly and specifically expressed on plasma cells, including MM cells.5-8 Particularly, BCMA-specific T-cell redirecting therapies, such as chimeric antigen receptor (CAR) T cells, bispecific T-cell engagers (BiTEs), and bispecific antibodies, have shown encouraging results with marked activity in preclinical MM models and early phase clinical trials.7,9-12
Despite promising results with these BCMA-specific T-cell redirecting therapies, there is no plateau in the survival curves, and eventually most patients will develop progressive disease. Mechanisms underlying development of progressive disease include heterogeneity in BCMA expression and (partial) loss of BCMA on the MM cell surface levels during treatment.13-15 These observations, together with the increasing use of BCMA-targeting drugs, underscore the need for additional targets for T-cell redirection therapy in MM. Such proteins should be preferentially expressed on the tumor cells, and not on critical normal tissues to prevent “on-target/off-tumor” effects.
GPRC5D, an orphan G protein–coupled receptor of family C, group 5, member D, is a promising novel target for MM immunotherapy. This 7-segment transmembrane protein was identified as candidate target for anti-MM therapy by comparison of gene expression profiles in unsorted bone marrow (BM) samples from patients with hematological malignancies.16 GPRC5D is highly and selectively expressed in MM cells,17-21 whereas in normal tissues, it is only expressed in cells that produce hard keratin such as in hair follicles.19,20,22 Although GPRC5D was discovered in the beginning of this millennium,17 its endogenous ligand(s) and signaling mechanism, and thereby its physiological function and its role in cancer, remain unknown.
In this study, we aimed to further increase our understanding of GPRC5D expression by measuring GPRC5D cell surface expression on MM cells from patients in different stages of the disease, as well as on normal plasma cells and other immune cell subsets. Moreover, we evaluated the preclinical activity of talquetamab, a new humanized GPRC5DxCD3 bispecific antibody, in MM cell lines and in fully autologous BM samples obtained from MM patients. Importantly, the host immune system, including T-cell function, can be affected by prior therapies, advanced disease, and diverse components of the suppressive microenvironment, such as BM stromal cells and regulatory T cells (Tregs). Therefore, we specifically investigated the potential impact of previous therapy, as well as several host and tumor characteristics, on T-cell redirection therapy with talquetamab.
Materials and methods
Patients
Cell surface expression of GPRC5D was assessed in BM aspirates obtained from newly diagnosed MM (NDMM) patients, primary plasma cell leukemia patients (pPCL), daratumumab-naïve relapsed/refractory MM (RRMM) patients and daratumumab-refractory (DARA-R) MM patients. Normal BM was obtained from age-matched patients undergoing cardiothoracic surgery. In these samples, we concurrently evaluated several other tumor characteristics and immune cell composition. Ex vivo efficacy of talquetamab was assessed when BM samples contained at least 2% MM cells and sufficient material was available. The samples were analyzed within 24 hours after BM aspiration.
The study site ethics committee or institutional review board approved the protocols, which were conducted according to the principles of the Declaration of Helsinki, the International Conference on Harmonization, and the Guidelines for Good Clinical Practice. All patients provided written informed consent.
Details and additional methods are presented in the supplemental Data.
Results
Assessment of GPRC5D protein expression measured by flow cytometry
To gain deeper insight into GPRC5D cell surface expression (as determined by median fluorescence intensity [MFI]), we performed flow cytometry analysis on fresh BM samples from 74 MM patients (see Table 1 for patient characteristics). There was a marked heterogeneity in cell surface GPRC5D protein expression levels on MM cells among patients, without a significant difference in the extent of expression between NDMM (n = 27), daratumumab-naïve RRMM (n = 22), and daratumumab-refractory RRMM (n = 25) patients (Figure 1A). Although numbers are small, the expression of GPRC5D in pPCL samples (n = 3) was comparable to NDMM samples (data not shown). We also assessed GPRC5D expression on normal plasma cells (PCs) in 11 BM samples obtained from age-matched healthy donors (median age: 71 years old [range, 55-77]). Higher GPRC5D cell surface levels were detected on MM cells compared with normal PCs. GPRC5D levels on both normal and clonal PCs were significantly higher compared with other immune cells including B cells, T cells, natural killer (NK) cells, and NKT cells (Figure 1B-C). By analyzing 11 additional BM samples, we show that GPRC5D expression on MM cells as determined by MFI is highly correlated with GPRC5D antibody-binding capacity (r = 0.996, P < .0001; supplemental Figure 1). As expected, CD38 expression levels were higher on normal PCs when compared with MM cells,23 whereas similar expression was observed for BCMA (Figure 1D).
Characteristics of MM patients and controls (samples used for assessment of GPRC5D expression)
| HD (n = 11) | NDMM (n = 27) | RRMM (n = 22) | DARA-R MM (n = 25) | |
|---|---|---|---|---|
| Age, median (range), y | 71 (55-77) | 66 (49-86) | 67 (54-77) | 66 (50-80) |
| Male, n (%) | 9 (82) | 16 (59) | 13 (59) | 15 (60) |
| LDH, U/L | ||||
| Median (range) | 207 (111-490) | 212 (78-1505) | 195 (110-544) | |
| Unknown, n (%) | 10 (37) | 0 | 4 (16) | |
| Elevated, n (%) | 6 (35) | 6 (27) | 6 (29) | |
| eGFR, mL/min/1.73 m2 | ||||
| Median (range) | 80 (23-90) | 78 (42-90) | 78 (36-90) | |
| Unknown, n (%) | 6 (22) | 0 | 0 | |
| <60, n (%) | 2 (10) | 4 (18) | 6 (24) | |
| <30, n (%) | 1 (5) | 0 | 0 | |
| β2-microglobulin, median (range), mg/L | 3.2 (1.8-11.0) | 3.7 (2.0-12.0) | 4.4 (1.7-9.0) | |
| Unknown, n (%) | 4 (15) | 4 (18) | 13 (52) | |
| M protein, n (%) | ||||
| IgG | 9 (36) | 17 (77) | 16 (64) | |
| IgA | 5 (20) | 3 (14) | 4 (16) | |
| FLC only | 10 (40) | 2 (9) | 3 (12) | |
| Nonsecretor | 0 | 0 | 1 (4) | |
| Other | 1 (4): IgM | 0 | 1 (4): IgD | |
| Unknown | 2 (7) | 0 | 0 | |
| ISS score, n (%) | ||||
| 1 | 11 (46) | |||
| 2 | 8 (33) | |||
| 3 | 5 (21) | |||
| Unknown | 3 (11) | |||
| High-risk cytogenetics,* n (%) | 3 (12) | 7 (33) | 5 (36) | |
| Unknown | 1 (4) | 1 (5) | 11 (44) | |
| del(17p) | 1 (4) | 5 (24) | 4 (29) | |
| t(4;14) | 1 (4) | 1 (5) | 1 (7) | |
| t(14;16) | 1 (4) | 1 (5) | 0 | |
| Prior lines, median (range) | 0 | 3 (1-8) | 6 (1-16) | |
| Prior autologous SCT, n (%) | NA | 15 (68) | 15 (60) | |
| Single | 12 (55) | 11 (44) | ||
| Double | 3 (14) | 4 (16) | ||
| Prior allogeneic SCT, n (%) | NA | 0 | 1 (4) | |
| Lenalidomide, n (%) | NA | |||
| Exposed | 20 (91) | 24 (96) | ||
| Refractory† | 20 (91) | 24 (96) | ||
| Pomalidomide, n (%) | NA | |||
| Exposed | 9 (41) | 13 (52) | ||
| Refractory | 8 (36) | 12 (48) | ||
| Bortezomib, n (%) | NA | |||
| Exposed | 20 (91) | 23 (92) | ||
| Refractory | 5 (23) | 13 (52) | ||
| Carfilzomib, n (%) | NA | |||
| Exposed | 9 (41) | 10 (40) | ||
| Refractory | 6 (27) | 6 (24) | ||
| Ixazomib, n (%) | NA | |||
| Exposed | 1 (5) | 3 (12) | ||
| Refractory | 1 (5) | 2 (8) | ||
| Daratumumab, n (%) | NA | |||
| Exposed | 0 | 25 (100) | ||
| Refractory | 0 | 25 (100) | ||
| BCMAxCD3 antibody, n (%) | NA | |||
| Exposed | 0 | 2 (8) | ||
| Refractory | 0 | 2 (8) | ||
| IMiD,‡ n (%) | NA | |||
| Exposed | 20 (91) | 24 (96) | ||
| Refractory | 20 (91) | 24 (96) | ||
| PI,§ n (%) | NA | |||
| Exposed | 22 (100) | 24 (96) | ||
| Refractory | 11 (50) | 18 (72) | ||
| IMiD and PI, n (%) | NA | |||
| Exposed | 20 (91) | 24 (96) | ||
| Refractory | 11 (50) | 18 (72) | ||
| Triple class,|| n (%) | NA | |||
| Exposed | 0 | 24 (96) | ||
| Refractory | 0 | 18 (72) |
Based on the presence of del(17p), t(4;14), and/or t(14;16).
Refractory disease was defined as progressive disease during therapy, no response (less than partial response), or progressive disease within 60 days of stopping treatment, according to the International Uniform Response Criteria for Multiple Myeloma.
Lenalidomide and/or pomalidomide.
Bortezomib, carfilzomib, and/or ixazomib.
At least 1 IMiD plus 1 PI and CD38-targeting antibody.
eGFR; estimated glomerular filtration rate; FLC, free light chains; HD, healthy donor; Ig, immunoglobulin; ISS, International Staging System; LDH, lactate dehydrogenase; NA, not applicable; SCT, stem cell transplantation.
![GPRC5D protein and RNA expression levels in normal and clonal plasma cells. (A) Cell surface expression of GPRC5D, as determined by MFI, on plasma cells was assessed by flow cytometry in BM samples obtained from 27 NDMM, 22 daratumumab-naïve RRMM, and 25 daratumumab-refractory MM patients and in normal BM from 11 age-matched healthy donors. Groups were compared using Mann-Whitney U test. (B) GPRC5D cell surface protein expression on MM cells was compared with the expression on BM-localized immune cells in the same patient’s samples by Wilcoxon matched-pairs test. (C) The same analysis was performed in BM samples obtained from healthy donors (n = 11). (D) Cell surface expression of BCMA and CD38 on plasma cells in BM samples from the same patients and healthy donors. (E) Gene expression profiling was performed on purified CD138+ plasma cells, publicly available datasets were used. mRNA expression of GPRC5D was compared between normal plasma cells obtained from healthy donors and clonal plasma cells from MGUS, SMM and NDMM patients. GPRC5D mRNA expression is plotted as Log2 transformed, MAS5 normalized values. (F) In datasets from 5 large trials (HOVON65, TT2, TT3, MRC IX, and APEX, n = 1421), GPRC5D mRNA expression in MM cells was compared between patients with or without specific cytogenetic abnormalities (gain(1q), del(13q), del(17p), and IGH translocations [t(4;14), t(11;14), and t(MAF)]). Groups were compared using Wilcoxon rank-sum test. (A-F) Each dot represents an individual sample, with box and whiskers, representing median, 25th-75th percentile, and range. (G) Univariate Cox regression analysis was performed to evaluate the effect of GPRC5D expression on progression-free survival and overall survival. *P < .05; ***P < .001; ****P < .0001. ns, not significant.](https://ash.silverchair-cdn.com/ash/content_public/journal/bloodadvances/5/8/10.1182_bloodadvances.2020003805/1/m_advancesadv2020003805f1.png?Expires=1769103580&Signature=gJGAMMD3wHoxG~yIj1IHvphOQQ2j-IX-4CdjjnoAzOxGJ7l9WAHVOaOrmDRxiBz-LwP9YVun5jzh70uajuzWUK5dOw5pmidBNCTUvTJY~OSvOLOMnkAm-3IJiOdC2iDxT3NdYW5-9CJajcOxy8ZpL00qnjVTF7CsvJKps2iYjZmHmlp5vV~0ZB-kBzhtM--gEfaaMO2z2Ja-oipoOinbdzLU7sWCc9lzT9Kw5eMK53hbGkcXElxxCyb5-OOARcGP6AjETRElt9WMLNKCMLWWiuO6hLGCa8mWGqnDnbd2nbcJYpA55FKJl-IKh9pEATjRWAwOHny~OgkMIn4RxHsrPA__&Key-Pair-Id=APKAIE5G5CRDK6RD3PGA)
GPRC5D protein and RNA expression levels in normal and clonal plasma cells. (A) Cell surface expression of GPRC5D, as determined by MFI, on plasma cells was assessed by flow cytometry in BM samples obtained from 27 NDMM, 22 daratumumab-naïve RRMM, and 25 daratumumab-refractory MM patients and in normal BM from 11 age-matched healthy donors. Groups were compared using Mann-Whitney U test. (B) GPRC5D cell surface protein expression on MM cells was compared with the expression on BM-localized immune cells in the same patient’s samples by Wilcoxon matched-pairs test. (C) The same analysis was performed in BM samples obtained from healthy donors (n = 11). (D) Cell surface expression of BCMA and CD38 on plasma cells in BM samples from the same patients and healthy donors. (E) Gene expression profiling was performed on purified CD138+ plasma cells, publicly available datasets were used. mRNA expression of GPRC5D was compared between normal plasma cells obtained from healthy donors and clonal plasma cells from MGUS, SMM and NDMM patients. GPRC5D mRNA expression is plotted as Log2 transformed, MAS5 normalized values. (F) In datasets from 5 large trials (HOVON65, TT2, TT3, MRC IX, and APEX, n = 1421), GPRC5D mRNA expression in MM cells was compared between patients with or without specific cytogenetic abnormalities (gain(1q), del(13q), del(17p), and IGH translocations [t(4;14), t(11;14), and t(MAF)]). Groups were compared using Wilcoxon rank-sum test. (A-F) Each dot represents an individual sample, with box and whiskers, representing median, 25th-75th percentile, and range. (G) Univariate Cox regression analysis was performed to evaluate the effect of GPRC5D expression on progression-free survival and overall survival. *P < .05; ***P < .001; ****P < .0001. ns, not significant.
GPRC5D protein and RNA expression levels in normal and clonal plasma cells. (A) Cell surface expression of GPRC5D, as determined by MFI, on plasma cells was assessed by flow cytometry in BM samples obtained from 27 NDMM, 22 daratumumab-naïve RRMM, and 25 daratumumab-refractory MM patients and in normal BM from 11 age-matched healthy donors. Groups were compared using Mann-Whitney U test. (B) GPRC5D cell surface protein expression on MM cells was compared with the expression on BM-localized immune cells in the same patient’s samples by Wilcoxon matched-pairs test. (C) The same analysis was performed in BM samples obtained from healthy donors (n = 11). (D) Cell surface expression of BCMA and CD38 on plasma cells in BM samples from the same patients and healthy donors. (E) Gene expression profiling was performed on purified CD138+ plasma cells, publicly available datasets were used. mRNA expression of GPRC5D was compared between normal plasma cells obtained from healthy donors and clonal plasma cells from MGUS, SMM and NDMM patients. GPRC5D mRNA expression is plotted as Log2 transformed, MAS5 normalized values. (F) In datasets from 5 large trials (HOVON65, TT2, TT3, MRC IX, and APEX, n = 1421), GPRC5D mRNA expression in MM cells was compared between patients with or without specific cytogenetic abnormalities (gain(1q), del(13q), del(17p), and IGH translocations [t(4;14), t(11;14), and t(MAF)]). Groups were compared using Wilcoxon rank-sum test. (A-F) Each dot represents an individual sample, with box and whiskers, representing median, 25th-75th percentile, and range. (G) Univariate Cox regression analysis was performed to evaluate the effect of GPRC5D expression on progression-free survival and overall survival. *P < .05; ***P < .001; ****P < .0001. ns, not significant.
We also explored possible associations between GPRC5D cell surface expression and several tumor and patient characteristics. Tumor load, effector:target (E:T) ratio, age, sex, β2-microglobulin levels, and lactate dehydrogenase levels did not affect GPRC5D expression on MM cells. There was a weak positive correlation between GPRC5D and estimated glomerular filtration rate (r = 0.37; P = .0018) as well as BCMA expression levels (r = 0.29; P = .014), whereas there was no correlation with CD38 and PD-L1 expression (supplemental Figure 2).
GPRC5D gene expression
We next evaluated GPRC5D messenger RNA (mRNA) expression in normal PCs from healthy controls and clonal PCs from patients with monoclonal gammopathy of undetermined significance (MGUS), smoldering MM (SMM), and newly diagnosed MM, through the analysis of publicly available data sets. In agreement with cell surface expression levels measured by flow cytometry, gene expression levels of GPRC5D were significantly higher in MM patients as compared with healthy controls. Intermediate GPRC5D expression was observed in MGUS and SMM patients (Figure 1E).
To evaluate potential associations between GPRC5D mRNA expression and clinical parameters, we analyzed mRNA data sets derived from a total of 1421 MM patients who participated in 5 different prospective clinical studies. GPRC5D gene expression levels were highly variable and independent of age and International Staging System score (data not shown). Significantly higher GPRC5D levels were observed in patients with t(4;14) and gain 1q, and significantly lower levels in patients with t(11;14) (Figure 1F). Although not significant, a similar trend for GPRC5D cell surface protein expression was observed in in our smaller cohort of 60 patients with available flow cytometry and cytogenetic data (supplemental Figure 3). We found no association between other cytogenetic abnormalities and GPRC5D expression. Univariate Cox regression analysis showed that GPRC5D expression levels were not associated with progression-free survival or overall survival (Figure 1G).
Talquetamab is effective in GPRD5D+ MM cell lines
The selective expression of GPRC5D on MM cells renders GPRC5D a potential immunotherapeutic target for the treatment of MM. We therefore analyzed the activity of the novel GPRC5DxCD3 bispecific antibody, talquetamab, in 4 MM cell lines (U266, RPMI-8226, MM.1S, and UM9) with different expression levels of GPRC5D, and in a GPRC5D-negative lymphoma cell line (Raji), by using a bioluminescence imaging (BLI)-based cytotoxicity assay. These cell lines were incubated with serial concentrations of talquetamab for 48 hours in the presence of healthy donor–derived peripheral blood mononuclear cells (PB-MNCs). As expected, talquetamab did not affect the viability of GPRC5D− U266 or Raji cells, but there was dose-dependent lysis of the 3 GPRC5D+ cell lines, with near-complete elimination of MM cells starting at 0.16 µg/mL talquetamab (Figure 2A-B). The most sensitive cell lines, UM9 and MM.1S, had highest GPRC5D expression. Additional experiments showed that cytolysis increased in an E:T ratio and time-dependent manner (Figure 2C; supplemental Figure 4). Consistent with a T cell–dependent mode of action, talquetamab treatment led to a dose-dependent activation and degranulation of both CD4+ and CD8+ T cells, as evidenced by the increased cell surface expression of CD25 and CD107a, respectively (Figure 2D). T-cell activation was accompanied by increased secretion of interferon (IFN)-γ; TNF-α; interleukin-2 (IL-2), IL-4, IL-6, IL-10, IL-17A; and granzyme B, as shown in Figure 2E for RPMI-8226. Similar data were obtained with MM.1S cells (data not shown).
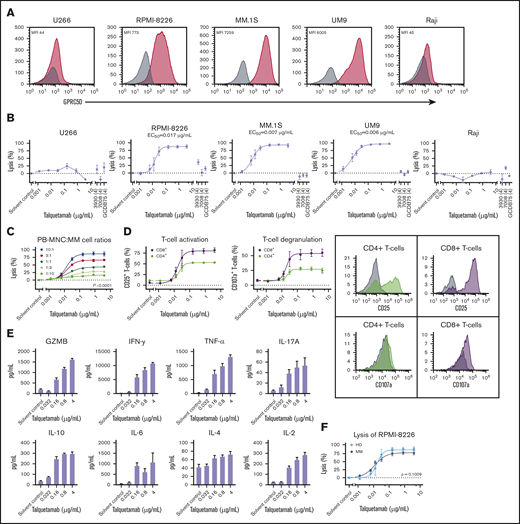
Talquetamab-mediated lysis of cell lines. (A) GPRC5D protein expression on cell lines was assessed by flow cytometry. Representative overlay histograms depict GPRC5D cell surface expression (red histogram) on 4 luciferase-transduced (LUC+) MM cell lines (U266, RPMI-8226, MM.1S, UM9) and the LUC+ Burkitt lymphoma cell line Raji, compared with isotype control (gray histogram). GPRC5D MFI is provided. (B) These cell lines were incubated with solvent control, serial dilutions of talquetamab (0.00128-4.0 µg/mL), or control antibodies, together with PB-MNCs obtained from healthy donors as effector cells, at an E:T ratio of 10:1 for 48 hours. Tumor cell lysis was assessed by using a BLI-based cytotoxicity assay. Data represent mean MM lysis ± standard error of mean (SEM) of 3 to 5 independent experiments, performed in duplicate. Half maximal effective concentration (EC50) values are provided. (C) LUC+ RPMI-8226 cells were incubated for 48 hours with solvent control or serial dilutions of talquetamab (0.00128-4.0 µg/mL), and PB-MNCs obtained from healthy donors as effector cells at different E:T ratios (10:1, 3:1, 1:1, 1:3, and 1:10). MM cell lysis was determined by using a BLI-based cytotoxicity assay. Data represent mean MM lysis ± SEM of 3 independent experiments, performed in duplicate. (D) Talquetamab-mediated activation and degranulation of healthy CD4+ and CD8+ T cells were assessed by flow cytometric analysis of CD25 and CD107a cell-surface expression, respectively (n = 3). Representative flow cytometry histogram overlays depict cell surface expression of CD25 and CD107a on CD4+ (green) and CD8+ (purple) T cells treated with talquetamab (4.0 µg/mL) or solvent control (gray). (E) Pro-inflammatory cytokines and granzyme B were measured in cell-culture supernatants from RPMI-8226 cells treated with talquetamab (0.032-4.0 μg/mL) in the presence of PB-MNCs obtained from healthy donors for 48 hours, by using a flow cytometry-based assay and an enzyme-linked immunosorbent assay, respectively. Bars represent mean ± SEM of 3 independent experiments, performed in triplicate. (F) RPMI-8226 cells were incubated with solvent control or serial dilutions of talquetamab (0.00128-4.0 µg/mL), and PB-MNCs derived from 4 healthy donors or from 9 RRMM patients (median of 3 prior lines of therapy, 66% refractory for both IMiD and PI; PB was obtained at the time of progression during last line of therapy) at an E:T ratio of 10:1. After a 48 hour-incubation, lysis of RPMI-8826 cells was determined by BLI. Data represent mean MM lysis ± SEM; each individual experiment was performed in duplicate. Differences in talquetamab-mediated tumor cell lysis in the presence of PB-MNCs from healthy donors or MM patients were calculated using nonlinear regression analysis.
Talquetamab-mediated lysis of cell lines. (A) GPRC5D protein expression on cell lines was assessed by flow cytometry. Representative overlay histograms depict GPRC5D cell surface expression (red histogram) on 4 luciferase-transduced (LUC+) MM cell lines (U266, RPMI-8226, MM.1S, UM9) and the LUC+ Burkitt lymphoma cell line Raji, compared with isotype control (gray histogram). GPRC5D MFI is provided. (B) These cell lines were incubated with solvent control, serial dilutions of talquetamab (0.00128-4.0 µg/mL), or control antibodies, together with PB-MNCs obtained from healthy donors as effector cells, at an E:T ratio of 10:1 for 48 hours. Tumor cell lysis was assessed by using a BLI-based cytotoxicity assay. Data represent mean MM lysis ± standard error of mean (SEM) of 3 to 5 independent experiments, performed in duplicate. Half maximal effective concentration (EC50) values are provided. (C) LUC+ RPMI-8226 cells were incubated for 48 hours with solvent control or serial dilutions of talquetamab (0.00128-4.0 µg/mL), and PB-MNCs obtained from healthy donors as effector cells at different E:T ratios (10:1, 3:1, 1:1, 1:3, and 1:10). MM cell lysis was determined by using a BLI-based cytotoxicity assay. Data represent mean MM lysis ± SEM of 3 independent experiments, performed in duplicate. (D) Talquetamab-mediated activation and degranulation of healthy CD4+ and CD8+ T cells were assessed by flow cytometric analysis of CD25 and CD107a cell-surface expression, respectively (n = 3). Representative flow cytometry histogram overlays depict cell surface expression of CD25 and CD107a on CD4+ (green) and CD8+ (purple) T cells treated with talquetamab (4.0 µg/mL) or solvent control (gray). (E) Pro-inflammatory cytokines and granzyme B were measured in cell-culture supernatants from RPMI-8226 cells treated with talquetamab (0.032-4.0 μg/mL) in the presence of PB-MNCs obtained from healthy donors for 48 hours, by using a flow cytometry-based assay and an enzyme-linked immunosorbent assay, respectively. Bars represent mean ± SEM of 3 independent experiments, performed in triplicate. (F) RPMI-8226 cells were incubated with solvent control or serial dilutions of talquetamab (0.00128-4.0 µg/mL), and PB-MNCs derived from 4 healthy donors or from 9 RRMM patients (median of 3 prior lines of therapy, 66% refractory for both IMiD and PI; PB was obtained at the time of progression during last line of therapy) at an E:T ratio of 10:1. After a 48 hour-incubation, lysis of RPMI-8826 cells was determined by BLI. Data represent mean MM lysis ± SEM; each individual experiment was performed in duplicate. Differences in talquetamab-mediated tumor cell lysis in the presence of PB-MNCs from healthy donors or MM patients were calculated using nonlinear regression analysis.
Similar talquetamab-mediated MM cell lysis using T cells obtained from MM patients or healthy controls
It is currently unknown whether T cells from MM patients have similar cytotoxic activity compared with healthy donor-derived T cells. We therefore evaluated whether talquetamab is also capable of killing MM cells in the presence of PB-MNCs obtained from heavily pretreated daratumumab-naïve RRMM patients (median of 3 prior lines of therapy [range, 2-7]; 66% IMiD and PI refractory). Importantly, there was no significant impairment in talquetamab-mediated killing when using patient-derived PB-MNCs when compared with healthy donor PB-MNCs (Figure 2F).
Impact of stromal cells on the efficacy of talquetamab
BM stromal cells (BMSCs) contribute to resistance of MM cells against several therapies, including daratumumab24 and MM-reactive T cells.25,26 We therefore evaluated the impact of BMSCs obtained from MM patients on the efficacy of talquetamab. In 2 of the 3 GPRC5D-positive MM cell lines, BMSCs significantly impaired talquetamab-mediated lysis, whereas the activity of talquetamab against UM9 cells was not affected (Figure 3A).
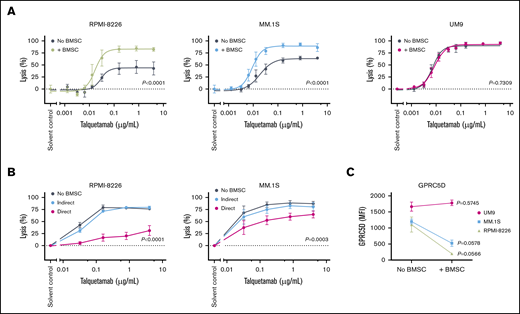
Talquetamab-mediated lysis is hampered by the presence of BMSCs in 2 of 3 cell lines. (A) Luciferase-transduced cell lines RPMI-8226, MM.1S, and UM9 were incubated with solvent control, serial dilutions of talquetamab (0.00128-4.0 µg/mL), or control antibodies, and with PB-MNCs obtained from healthy donors at an E:T ratio of 10:1, in the absence or presence of BMSCs (ratio of BMSCs to MM cells was 2:1). After a 48-hour incubation, MM cell lysis was assessed using a BLI-based cytotoxicity assay. Data represent mean MM lysis ± SEM of 3 to 4 independent experiments performed in duplicate. Differences in talquetamab-mediated tumor cell lysis in the presence or absence of BMSCs were calculated using nonlinear regression analysis; P values are provided. (B) The indirect or direct impact of BMSCs on talquetamab-mediated lysis was evaluated by performing transwell experiments in which MM cells (RPMI-8226 or MM.1S cells) and PB-MNCs obtained from healthy donors were placed in the lower chambers, and no cells (medium alone) or BMSCs (indirect contact) were placed in the upper chambers. To study direct cell contact, all cell types were combined in the lower chambers. Cells were incubated with serial dilutions of talquetamab (0.032-4.0 µg/mL) or control antibodies for 48 hours. Lysis of MM cells was assessed using a BLI assay. Data represent mean lysis ± SEM of 3 independent experiments, performed in duplicate or triplicate. The impact of direct or indirect contact with BMSCs was calculated using nonlinear regression analysis and 2-way analysis of variance test; P values are provided. (C) GPR5D expression on MM cells was assessed by flow cytometry after a 48-hour incubation in the presence or absence of BMSCs. Paired Student t test was used to evaluate significance between both groups.
Talquetamab-mediated lysis is hampered by the presence of BMSCs in 2 of 3 cell lines. (A) Luciferase-transduced cell lines RPMI-8226, MM.1S, and UM9 were incubated with solvent control, serial dilutions of talquetamab (0.00128-4.0 µg/mL), or control antibodies, and with PB-MNCs obtained from healthy donors at an E:T ratio of 10:1, in the absence or presence of BMSCs (ratio of BMSCs to MM cells was 2:1). After a 48-hour incubation, MM cell lysis was assessed using a BLI-based cytotoxicity assay. Data represent mean MM lysis ± SEM of 3 to 4 independent experiments performed in duplicate. Differences in talquetamab-mediated tumor cell lysis in the presence or absence of BMSCs were calculated using nonlinear regression analysis; P values are provided. (B) The indirect or direct impact of BMSCs on talquetamab-mediated lysis was evaluated by performing transwell experiments in which MM cells (RPMI-8226 or MM.1S cells) and PB-MNCs obtained from healthy donors were placed in the lower chambers, and no cells (medium alone) or BMSCs (indirect contact) were placed in the upper chambers. To study direct cell contact, all cell types were combined in the lower chambers. Cells were incubated with serial dilutions of talquetamab (0.032-4.0 µg/mL) or control antibodies for 48 hours. Lysis of MM cells was assessed using a BLI assay. Data represent mean lysis ± SEM of 3 independent experiments, performed in duplicate or triplicate. The impact of direct or indirect contact with BMSCs was calculated using nonlinear regression analysis and 2-way analysis of variance test; P values are provided. (C) GPR5D expression on MM cells was assessed by flow cytometry after a 48-hour incubation in the presence or absence of BMSCs. Paired Student t test was used to evaluate significance between both groups.
Next, we examined whether BMSCs protect MM cells against talquetamab-mediated lysis through cell-derived soluble factors or direct cell–cell contact by performing transwell experiments. BMSCs significantly inhibited talquetamab-mediated MM cell lysis in cocultures where they were in direct contact with MM cells. However, when BMSCs were separated from MM cells by microporous membrane inserts (indirect contact), the inhibitory capacity was substantially diminished (Figure 3B). This indicates that cell–cell contact is required to reduce talquetamab-mediated MM cell lysis, whereas BMSC-derived soluble factors alone do not impair the activity of talquetamab.
The protection conferred by BMSCs against talquetamab-mediated lysis may be due to acquired resistance of MM cells (eg, altered target expression following adhesive interactions) and/or T-cell suppression. Additional experiments showed that contact with BMSCs resulted in reduced expression of GPRC5D on RPMI-8226 and MM.1S cells, but not on UM9 cells, correlating with BMSC-mediated talquetamab resistance of RPMI-8226 and MM.1S, but not of UM9 (Figure 3C). However, talquetamab-mediated lysis was inhibited by BMSCs without a reduction in T-cell activation and degranulation, indicating the induction of cell intrinsic resistance mechanisms against the cytotoxic machinery of T cells by BMSCs (supplemental Figure 5). Similar results were obtained when CD4+ and CD8+ T cells were analyzed separately.
Talquetamab induces T-cell activation and T-cell degranulation and kills primary MM cells obtained from NDMM and RRMM patients
To evaluate the efficacy of talquetamab against primary MM cells, we treated BM mononuclear cells (BM-MNCs; containing tumor cells, as well as autologous effector cells and immune suppressor cells) from 45 patients with talquetamab for 48 hours, after which survival of MM cells was determined by enumeration of viable CD138+ cells by flow cytometry (see Table 2 for patient characteristics). Talquetamab effectively induced MM cell lysis (mean lysis with 4.0 μg/mL talquetamab [dose whereby a plateau in MM cell lysis was observed]: 61%; range: −5% to 97%; Figure 4A; supplemental Figure 6A-B), whereas there was a modest increase in NK cells and a small decrease in T-cell counts (Figure 4B). The control antibodies (immunoglobulin G1 isotype control, CD3xnull, and GPRC5Dxnull) showed significantly lower anti-MM activity in these patient samples, confirming the requirement for cross-linking of target cells and T cells, and ruling out a direct effect of GPRC5D targeting. Importantly, there was no difference in talquetamab-mediated killing of MM cells from NDMM (n = 13; mean lysis at 4.0 µg/mL: 59%), daratumumab-naïve RRMM (n = 17; median of 3 prior lines of therapy; 88% lenalidomide-refractory and 24% bortezomib-refractory; mean lysis: 63%), or daratumumab-refractory MM patients (n = 15; median of 6 prior lines of therapy; 100% lenalidomide-refractory and 60% bortezomib-refractory; mean lysis: 64%) (Figure 4C). The daratumumab-refractory status of the latter group of patients was confirmed by their low ex vivo daratumumab sensitivity, when compared with daratumumab-naïve patients (supplemental Figure 6C). Furthermore, talquetamab was also effective in 1 of 2 samples obtained from patients who progressed during treatment with a BCMA-targeting bispecific antibody. The nonresponding patient had low GPRC5D expression on MM cells (supplemental Figure 7A). We also observed high activity in 2 samples obtained from pPCL patients (supplemental Figure 7B).
Characteristics of MM patients (samples used in cytotoxicity assays)
| NDMM (n = 13) | RRMM (n = 17) | DARA-R MM (n = 15) | |
|---|---|---|---|
| Age, median (range), y | 63 (49-86) | 68 (54-77) | 68 (57-80) |
| Male, n (%) | 8 (62) | 12 (71) | 11 (73) |
| LDH, U/L | |||
| Median (range) | 223 (156-490) | 217 (78-1505) | 209 (110-544) |
| Unknown, n (%) | 4 (31) | 0 | 1 (7) |
| Elevated, n (%) | 4 (44) | 6 (35) | 4 (27) |
| eGFR, mL/min/1.73 m2 | |||
| Median (range) | 85 (23-90) | 69 (42-90) | 78 (43-90) |
| Unknown, n (%) | 3 (23) | 0 | 0 |
| <60, n (%) | 1 (10) | 1 (6) | 4 (27) |
| <30, n (%) | 1 (10) | 0 | 0 |
| β2-microglobulin, median (range), mg/L | 3.3 (1.8-10.0) | 4.1 (2.0-6.2) | 4.0 (1.7-7.9) |
| Unknown, n (%) | 1 (8) | 2 (12) | 9 (60) |
| M protein, n (%) | |||
| IgG | 7 (58) | 13 (76) | 9 (60) |
| IgA | 2 (17) | 3 (18) | 3 (20) |
| FLC only | 3 (25) | 1 (6) | 2 (13) |
| Nonsecretor | 0 | 0 | 1 (7) |
| Unknown | 1 (8) | 0 | 0 |
| ISS score, n (%) | |||
| 1 | 6 (50) | ||
| 2 | 4 (33) | ||
| 3 | 2 (17) | ||
| Unknown | 1 (8) | ||
| High-risk cytogenetics,* n (%) | 1 (8) | 6 (38) | 3 (33) |
| Unknown | 0 | 1 (6) | 6 (40) |
| del (17p) | 0 | 4 (25) | 3 (33) |
| t (4;14) | 0 | 2 (13) | 0 |
| t (14;16) | 1 (8) | 0 | 0 |
| Prior lines, median (range) | 0 | 3 (1-8) | 6 (3-16) |
| Prior autologous SCT, n (%) | NA | 11 (65) | 9 (60) |
| Single | 8 (47) | 5 (33) | |
| Double | 3 (18) | 4 (27) | |
| Lenalidomide, n (%) | NA | ||
| Exposed | 15 (88) | 15 (100) | |
| Refractory† | 15 (88) | 15 (100) | |
| Pomalidomide, n (%) | NA | ||
| Exposed | 7 (41) | 7 (47) | |
| Refractory | 6 (35) | 7 (47) | |
| Bortezomib, n (%) | NA | ||
| Exposed | 16 (94) | 14 (93) | |
| Refractory | 4 (24) | 9 (60) | |
| Carfilzomib, n (%) | NA | ||
| Exposed | 5 (29) | 7 (46) | |
| Refractory | 2 (12) | 4 (27) | |
| Ixazomib, n (%) | NA | ||
| Exposed | 1 (6) | 0 | |
| Refractory | 1 (6) | 0 | |
| Daratumumab, n (%) | NA | ||
| Exposed | 0 | 15 (100) | |
| Refractory | 0 | 15 (100) | |
| BCMAxCD3 antibody, n (%) | NA | ||
| Exposed | 0 | 2 (13) | |
| Refractory | 0 | 2 (13) | |
| IMiD,‡ n (%) | NA | ||
| Exposed | 15 (88) | 15 (100) | |
| Refractory | 15 (88) | 15 (100) | |
| PI,§ n (%) | NA | ||
| Exposed | 17 (100) | 15 (100) | |
| Refractory | 6 (35) | 11 (73) | |
| IMiD and PI, n (%) | NA | ||
| Exposed | 15 (88) | 15 (100) | |
| Refractory | 6 (35) | 11 (73) | |
| Triple class,|| n (%) | NA | ||
| Exposed | 0 | 15 (100) | |
| Refractory | 0 | 11 (73) |
Based on the presence of del(17p), t(4;14), and/or t(14;16).
Refractory disease was defined as progressive disease during therapy, no response (less than partial response), or progressive disease within 60 days of stopping treatment, according to the International Uniform Response Criteria for Multiple Myeloma.
Lenalidomide and/or pomalidomide.
Bortezomib, carfilzomib, and/or ixazomib.
At least 1 IMiD plus 1 PI and CD38-targeting antibody.
![Talquetamab-mediated lysis of primary MM cells. BM-MNCs obtained from 13 NDMM, 17 daratumumab-naïve RRMM, and 15 daratumumab-refractory RRMM patients were incubated with solvent control, serial dilutions of talquetamab (0.00128-4.0 µg/mL), and control antibodies (4.0 µg/mL) for 48 hours, after which surviving CD138+ MM cells (A), as well as T and NK cells (B), were enumerated using flow cytometric analysis. Lysis (y-axis) of MM cells (red), T cells (orange) and NK cells (gray) is depicted in the graphs. Negative lysis values indicate that cell numbers are higher when compared with solvent control. (C) Talquetamab-mediated tumor cell lysis in samples obtained from NDMM (lime green), daratumumab-naïve RRMM (light blue), and daratumumab-refractory RRMM (magenta) patients was compared using nonlinear regression analysis. EC50 values are provided for each patient category. (D) Talquetamab-mediated activation and degranulation of CD4+ T cells, CD8+ T cells, and NK cells were assessed after a 48-hour culture in all 45 patient samples by flow cytometric analysis of CD25 and CD107a cell surface expression, respectively. Data represent mean ± SEM; experiments performed in duplicate. Representative flow cytometry histogram overlays depict cell surface expression of CD25 (green) and CD107a (purple) on CD4+ and CD8+ T cells treated with talquetamab (4.0 µg/mL) for 48 hours, compared with solvent control (gray). (E) T-cell activation and T-cell degranulation were also assessed per patient category (NDMM [lime green], daratumumab-naïve RRMM [light blue], and daratumumab-refractory RRMM [magenta]), and compared using nonlinear regression analysis. (F) Granzyme B and cytokines were measured in the cell-culture supernatants of BM-MNCs treated with solvent control or talquetamab for 48 hours. BM-MNCs were obtained from 5 daratumumab-naïve RRMM and 1 daratumumab-refractory RRMM patient. Data are depicted as different symbols, representing the mean of 4 measurements per patient, with box and whiskers, representing median values, 25th-75th percentile, and range. Data were normalized to solvent control. GZMB, granzyme B.](https://ash.silverchair-cdn.com/ash/content_public/journal/bloodadvances/5/8/10.1182_bloodadvances.2020003805/1/m_advancesadv2020003805f4.png?Expires=1769103580&Signature=XF1BGQKjU3ueXkO3WWsCxI9yLYv4raX8a9mrI1x7Zxtjb8kXcZJ--mvmhscAKQWnBjOnlXBnZ4noftWUw~Drp6CHFeYoJslt~aEemLTP8HCTyX91zVCfscHcjE02iSNhuLq-A~tK7BOYMxF2b4T9QNrFIj9pGsCVljvW2FPNP4gwFrh8asvC4JQPS25toi~bVlliCsFx9t-NzUWHr~Jq12p0ntqi0J4xSlqG~KrH6WfpzaXvQis7z2qkINSXw9ng9wLsT8qRP0q1ggMHEqxMNwTxCBJNzv~pSlB6fXUU7QrRrxZQNL2EJKAe-lbFVKH3AnEeExw3LoDGsVm22RiQog__&Key-Pair-Id=APKAIE5G5CRDK6RD3PGA)
Talquetamab-mediated lysis of primary MM cells. BM-MNCs obtained from 13 NDMM, 17 daratumumab-naïve RRMM, and 15 daratumumab-refractory RRMM patients were incubated with solvent control, serial dilutions of talquetamab (0.00128-4.0 µg/mL), and control antibodies (4.0 µg/mL) for 48 hours, after which surviving CD138+ MM cells (A), as well as T and NK cells (B), were enumerated using flow cytometric analysis. Lysis (y-axis) of MM cells (red), T cells (orange) and NK cells (gray) is depicted in the graphs. Negative lysis values indicate that cell numbers are higher when compared with solvent control. (C) Talquetamab-mediated tumor cell lysis in samples obtained from NDMM (lime green), daratumumab-naïve RRMM (light blue), and daratumumab-refractory RRMM (magenta) patients was compared using nonlinear regression analysis. EC50 values are provided for each patient category. (D) Talquetamab-mediated activation and degranulation of CD4+ T cells, CD8+ T cells, and NK cells were assessed after a 48-hour culture in all 45 patient samples by flow cytometric analysis of CD25 and CD107a cell surface expression, respectively. Data represent mean ± SEM; experiments performed in duplicate. Representative flow cytometry histogram overlays depict cell surface expression of CD25 (green) and CD107a (purple) on CD4+ and CD8+ T cells treated with talquetamab (4.0 µg/mL) for 48 hours, compared with solvent control (gray). (E) T-cell activation and T-cell degranulation were also assessed per patient category (NDMM [lime green], daratumumab-naïve RRMM [light blue], and daratumumab-refractory RRMM [magenta]), and compared using nonlinear regression analysis. (F) Granzyme B and cytokines were measured in the cell-culture supernatants of BM-MNCs treated with solvent control or talquetamab for 48 hours. BM-MNCs were obtained from 5 daratumumab-naïve RRMM and 1 daratumumab-refractory RRMM patient. Data are depicted as different symbols, representing the mean of 4 measurements per patient, with box and whiskers, representing median values, 25th-75th percentile, and range. Data were normalized to solvent control. GZMB, granzyme B.
Talquetamab-mediated lysis of primary MM cells. BM-MNCs obtained from 13 NDMM, 17 daratumumab-naïve RRMM, and 15 daratumumab-refractory RRMM patients were incubated with solvent control, serial dilutions of talquetamab (0.00128-4.0 µg/mL), and control antibodies (4.0 µg/mL) for 48 hours, after which surviving CD138+ MM cells (A), as well as T and NK cells (B), were enumerated using flow cytometric analysis. Lysis (y-axis) of MM cells (red), T cells (orange) and NK cells (gray) is depicted in the graphs. Negative lysis values indicate that cell numbers are higher when compared with solvent control. (C) Talquetamab-mediated tumor cell lysis in samples obtained from NDMM (lime green), daratumumab-naïve RRMM (light blue), and daratumumab-refractory RRMM (magenta) patients was compared using nonlinear regression analysis. EC50 values are provided for each patient category. (D) Talquetamab-mediated activation and degranulation of CD4+ T cells, CD8+ T cells, and NK cells were assessed after a 48-hour culture in all 45 patient samples by flow cytometric analysis of CD25 and CD107a cell surface expression, respectively. Data represent mean ± SEM; experiments performed in duplicate. Representative flow cytometry histogram overlays depict cell surface expression of CD25 (green) and CD107a (purple) on CD4+ and CD8+ T cells treated with talquetamab (4.0 µg/mL) for 48 hours, compared with solvent control (gray). (E) T-cell activation and T-cell degranulation were also assessed per patient category (NDMM [lime green], daratumumab-naïve RRMM [light blue], and daratumumab-refractory RRMM [magenta]), and compared using nonlinear regression analysis. (F) Granzyme B and cytokines were measured in the cell-culture supernatants of BM-MNCs treated with solvent control or talquetamab for 48 hours. BM-MNCs were obtained from 5 daratumumab-naïve RRMM and 1 daratumumab-refractory RRMM patient. Data are depicted as different symbols, representing the mean of 4 measurements per patient, with box and whiskers, representing median values, 25th-75th percentile, and range. Data were normalized to solvent control. GZMB, granzyme B.
Talquetamab-mediated lysis of MM cells was accompanied by a significant increase in the proportion of activated CD4+ and CD8+ T cells, as evidenced by CD25 induction on the cell surface (Figure 4D). Talquetamab treatment also resulted in a significant degranulation of CD4+ and CD8+ T cells, as determined by induction of cell surface CD107a expression. At higher concentrations, talquetamab-mediated T-cell activation was significantly higher in NDMM compared with RRMM patient samples, whereas there was no difference in extent of T-cell degranulation among the 3 patient groups (Figure 4E). As expected, no activation or degranulation of NK cells was observed (Figure 4D). We also evaluated cytokine and granzyme B levels in supernatants from 6 RRMM patients. Talquetamab treatment resulted in a dose-dependent increase in levels of granzyme B and cytokines (in particular IL-6, IL-8, TNF-α, and IFN-γ) (Figure 4F).
Effect of talquetamab on normal PCs
Because normal PCs expressed significantly lower GPRC5D, but higher CD38 levels, compared with malignant PCs, we also assessed to what extent talquetamab and daratumumab eliminate normal PCs. To this end, BM-MNCs obtained from age-matched healthy controls were incubated with these antibodies for 48 hours. Talquetamab-mediated lysis of normal PCs was significantly lower compared with daratumumab (supplemental Figure 8).
Impact of tumor and host characteristics on talquetamab-mediated MM cell lysis
Because extent of prior therapy does not explain the variability in sensitivity, we examined whether baseline tumor characteristics have an impact on the susceptibility of MM cells toward talquetamab. To this end, patients were divided into 2 groups according to whether the value of a continuous variable was above or below the median value of all tested samples (see supplemental Figure 9A for the distribution of each variable), and dose-response curves were compared between both groups (Figure 5A). Across BM samples, the efficacy of talquetamab was superior in patients with higher than median cell surface expression levels of GPRC5D, when compared with patients with lower expression (P < .0001). T-cell activation and degranulation were both significantly higher in samples from patients with high GPRC5D expression, compared with those with low expression, reflecting the higher efficacy of talquetamab against MM cells with high GPRC5D expression. As expected, talquetamab activity was not associated with cell surface expression levels of BCMA and CD38. Importantly, the presence of high-risk cytogenetic abnormalities (del(17p), t(4;14), and/or t(14;16)) did not impair talquetamab activity. Similar results were obtained when chromosome 1 abnormalities were included in the definition of high-risk disease. Because aging is accompanied by a decline in immune function, we also assessed the effect of age on talquetamab-mediated tumor cell lysis. In samples derived from older patients (age >67 years), talquetamab activity was impaired, which was accompanied by inferior T-cell activation and degranulation.

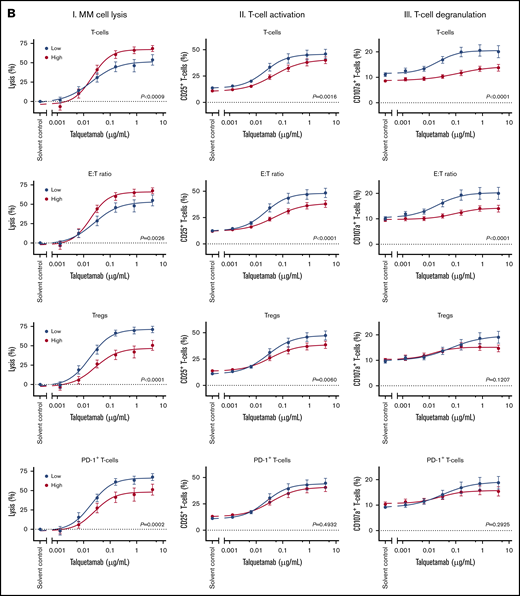
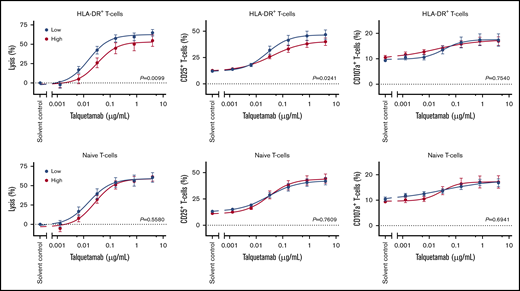
Impact of tumor, patient and immune characteristics on talquetamab-mediated lysis, T-cell activation, and degranulation. The impact of tumor and patient characteristics (A) and immune characteristics (B) on talquetamab-mediated activity was assessed by constructing dose-response curves for talquetamab-mediated MM cell lysis (panels I), talquetamab-mediated T-cell activation based on frequency of CD25+ T cells (panels II), and talquetamab-mediated T-cell degranulation based on frequency of CD107a+ T cells (panels III), according to median expression levels (GPRC5D, BCMA), median percentage of immune cell subsets (T cells, Tregs, PD-1+ T cells, HLA-DR+ T cells, naïve T cells), median E:T ratio, median age, as well as presence of high-risk cytogenetic aberrations. Patient samples were obtained from 13 NDMM, 17 daratumumab-naïve RRMM, and 15 daratumumab-refractory RRMM patients. Data represent mean ± SEM, samples with a value ≤ median value of all tested samples are depicted in blue and > median value in red. Groups were compared by nonlinear regression analysis. P values are provided.
Impact of tumor, patient and immune characteristics on talquetamab-mediated lysis, T-cell activation, and degranulation. The impact of tumor and patient characteristics (A) and immune characteristics (B) on talquetamab-mediated activity was assessed by constructing dose-response curves for talquetamab-mediated MM cell lysis (panels I), talquetamab-mediated T-cell activation based on frequency of CD25+ T cells (panels II), and talquetamab-mediated T-cell degranulation based on frequency of CD107a+ T cells (panels III), according to median expression levels (GPRC5D, BCMA), median percentage of immune cell subsets (T cells, Tregs, PD-1+ T cells, HLA-DR+ T cells, naïve T cells), median E:T ratio, median age, as well as presence of high-risk cytogenetic aberrations. Patient samples were obtained from 13 NDMM, 17 daratumumab-naïve RRMM, and 15 daratumumab-refractory RRMM patients. Data represent mean ± SEM, samples with a value ≤ median value of all tested samples are depicted in blue and > median value in red. Groups were compared by nonlinear regression analysis. P values are provided.
Impact of immune characteristics on talquetamab-mediated MM cell lysis
Next, we assessed whether the variability in response to talquetamab could be explained by naturally occurring differences in the composition of the immune system in these BM samples. Because the patients’ samples contained variable amounts of T cells and MM cells, we first analyzed the impact of T-cell frequency and E:T ratio in the BM-MNCs on talquetamab-mediated MM cell lysis. The dose-response curves show that talquetamab is significantly less effective in patients with a low T-cell frequency or low E:T ratio (≤ median), when compared with patients with a high T-cell frequency or high E:T ratio (Figure 5B). Furthermore, the proportions of activated and degranulated T-cells induced in response to talquetamab treatment were significantly lower in patients with high T-cell frequency or E:T ratio, when compared with a T-cell frequency or E:T ratio below the median. Similar observations were made when CD4+ T cells and CD8+ T cells were analyzed separately (data not shown). The CD4:CD8 ratio had no impact on talquetamab activity (data not shown). In contrast, a high frequency of Tregs (> median) impaired talquetamab-mediated lysis of MM cells, and this was accompanied by inferior T-cell activation and trend toward diminished T-cell degranulation (Figure 5B; supplemental Figure 9A-B for distribution of variables and Treg gating strategy). A high frequency of PD-1+ T cells (> median) was also associated with reduced activity of talquetamab, but not with a significant difference in T-cell activation or degranulation. A lower frequency of activated T cells (defined by the expression of HLA-DR) at baseline resulted in more effective talquetamab-mediated lysis, accompanied by higher percentages of activated T cells. The frequencies of T-cell memory subsets (naive, central memory, effector memory, or terminally differentiated effector memory) were not associated with response to talquetamab or differences in T-cell activation or degranulation (Figure 5B shows data for naive T cells).
Tregs impair lysis of MM cells
Because Tregs have a negative impact on talquetamab-mediated killing of primary MM cells, we performed additional experiments to analyze the killing capacity of Tregs in response to talquetamab, and whether Tregs impair the cytotoxic activity of effector T cells. To this end, we isolated Tregs according to phenotypic CD4+CD25+CD127−/low expression, and conventional CD4+CD25− T cells as control from buffy coats obtained from healthy donors (Figure 6A). To confirm that these CD4+CD25+CD127−/low cells exhibit the functional characteristics of Tregs, we first performed coculture experiments with autologous CD4+CD25− T cells to examine the suppressive capacity of the Tregs. Stimulation of CD4+CD25− T cells with anti-CD3/CD28-coated beads resulted in a strong proliferative response, which was inhibited in the presence of Tregs (Figure 6B). Next, RPMI-8226 cells were treated with talquetamab in the presence of purified Tregs and/or CD4+CD25− T cells as effector cells. After 48 hours of coculture, we demonstrate the ability of Tregs to directly eliminate MM cells in the presence of talquetamab. However, MM cell lysis mediated by redirected Tregs was significantly lower than what was observed with redirected CD4+CD25− T cells. Moreover, the addition of Tregs to CD4+CD25− T cells significantly impaired lysis of RPMI-8226 cells, compared with CD4+CD25− T cells alone (Figure 6C). Accordingly, talquetamab-induced production of pro-inflammatory cytokines (IFN-γ, TNF-α, IL-2) was lower in the presence of Tregs alone, and in the combination of Tregs plus CD4+CD25− T cells, compared with CD4+CD25− T cells alone (Figure 6D). Although not significant, a similar trend was observed for granzyme B release (Figure 6D).
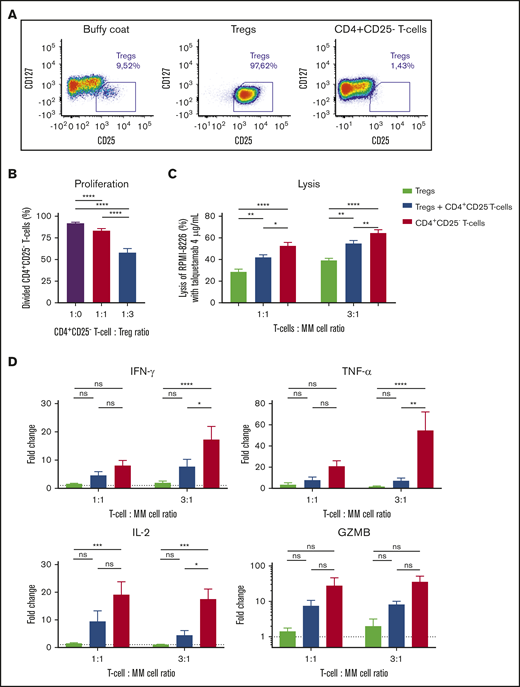
Tregs suppress the proliferation and killing capacity of CD4+CD25-effector Tcells. (A) Tregs and CD4+CD25− effector T cells were isolated from healthy donor-derived buffy coats by using an immune-magnetic cell isolation kit. Baseline immune cell frequencies and purity of isolated fractions were determined by flow cytometry, representative density plots are depicted. (B) Effector cells were labeled with violet tracer and incubated with or without Tregs in the presence of anti-CD3/CD28-coated beads. Proliferation was measured by flow cytometry after 5 days. (C) RPMI-8226 cells were incubated with Tregs and/or effector cells for 48 hours at an E:T ratio of 1:1 and 3:1, with solvent control or talquetamab (4.0 µg/mL). In combination experiments, Tregs and effector T cells were combined in a 1:1 ratio. Lysis of MM cells was determined using a BLI-based cytotoxicity assay. (D) Cytokine and granzyme B concentrations in cell-culture supernatants were measured using flow cytometry, and concentrations in talquetamab-treated conditions are depicted as fold change compared with solvent control. Data represent mean ± SEM of 3 independent experiments, performed in triplicate. Groups were compared using ANOVA with Tukey’s posttest. *P < .05; **P < .01; ***P < .001; ****P < .0001.
Tregs suppress the proliferation and killing capacity of CD4+CD25-effector Tcells. (A) Tregs and CD4+CD25− effector T cells were isolated from healthy donor-derived buffy coats by using an immune-magnetic cell isolation kit. Baseline immune cell frequencies and purity of isolated fractions were determined by flow cytometry, representative density plots are depicted. (B) Effector cells were labeled with violet tracer and incubated with or without Tregs in the presence of anti-CD3/CD28-coated beads. Proliferation was measured by flow cytometry after 5 days. (C) RPMI-8226 cells were incubated with Tregs and/or effector cells for 48 hours at an E:T ratio of 1:1 and 3:1, with solvent control or talquetamab (4.0 µg/mL). In combination experiments, Tregs and effector T cells were combined in a 1:1 ratio. Lysis of MM cells was determined using a BLI-based cytotoxicity assay. (D) Cytokine and granzyme B concentrations in cell-culture supernatants were measured using flow cytometry, and concentrations in talquetamab-treated conditions are depicted as fold change compared with solvent control. Data represent mean ± SEM of 3 independent experiments, performed in triplicate. Groups were compared using ANOVA with Tukey’s posttest. *P < .05; **P < .01; ***P < .001; ****P < .0001.
Combination therapy with daratumumab and pomalidomide
Because failure of immunotherapy may be caused by antigen loss, the simultaneous targeting of multiple antigens can be a new therapeutic approach to improve clinical outcome. To investigate whether the direct combination of talquetamab with the CD38-targeting antibody daratumumab enhanced tumor cell lysis, BM-MNCs from 25 MM patients were incubated with serial dilutions of talquetamab and with daratumumab (0.1 µg/mL) for 48 hours. Cotreatment with daratumumab enhanced talquetamab-mediated lysis of primary MM cells (n = 8 NDMM, n = 11 RRMM, and n = 6 DARA-R MM) in an additive fashion (Figure 7A; supplemental Figure 10A). Because activated T cells have increased CD38 expression, we also evaluated the impact of daratumumab on the proportion of CD38+ T cells and on T-cell numbers. Talquetamab treatment resulted in an increased frequency of CD38+ T cells, which was almost completely abrogated by daratumumab (Figure 7B). Daratumumab also reduced the proportion of activated and degranulated T cells, but had no effect on T-cell numbers (Figure 7C). In additional MM cell line experiments, we observed that daratumumab did enhance talquetamab-mediated MM cell lysis in the presence of PB-MNCs, but not in the presence of purified T cells (>99% purity). This indicates that next to T cells, other cells such as Fc-receptor-bearing NK cells, are essential to obtain additivity between both immunotherapeutic agents in these short-term experiments (supplemental Figure 11).
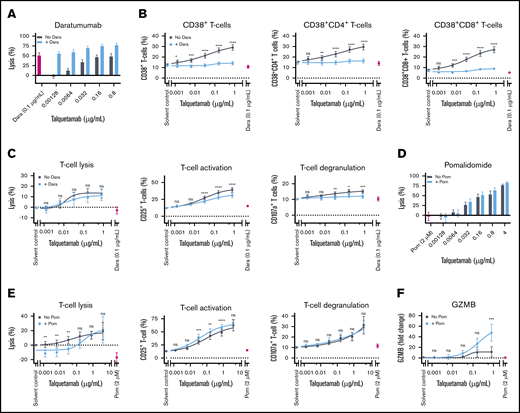
Co-incubation with daratumumab (DARA) or pomalidomide (POM) enhances talquetamab-mediated lysis. (A) BM-MNCs obtained from 8 NDMM, 11 daratumumab-naïve RRMM. and 6 daratumumab-refractory RRMM patients were incubated for 48 hours with serial dilutions of talquetamab (0.00128-0.8 µg/mL) with or without daratumumab 0.1 µg/mL. Surviving MM cells were enumerated using flow cytometry. (B) The effect of talquetamab with or without daratumumab on the frequency of CD38+ T cells, CD38+ CD4+ T cells, and CD38+ CD8+ T cells was assessed by flow cytometric analysis. (C) The impact of talquetamab with or without daratumumab on T-cell lysis, T-cell activation (CD25 positivity), and T-cell degranulation (CD107a positivity) was determined by flow cytometry. (D) For pomalidomide experiments, BM-MNCs obtained from 5 NDMM, 1 RRMM, and 7 DARA-R MM patients were incubated for 48 hours with serial dilutions of talquetamab (0.00128-4.0 µg/mL) with or without pomalidomide (2 µM). MM cell lysis was assessed by flow cytometry. (E) T-cell lysis, T-cell activation (CD25 positivity) and T-cell degranulation (CD107a positivity) were measured by flow cytometry. (F) Granzyme B concentration was measured in the cell-culture supernatants of BM-MNCs, obtained from 5 patients, treated for 48 hours with serial dilutions of talquetamab (0.00128-0.8 µg/mL) with or without pomalidomide (2 µM). Granzyme B concentrations are depicted as fold change compared with solvent control. (B-C,E-F) Results of talquetamab monotherapy were compared with combinatorial treatment by nonlinear regression analysis with matched 2-way ANOVA and Sidak’s posttest. (A-F) Data are depicted as mean ± SEM of individual experiments, performed in duplicate. *P < .05; **P < .01; ***P < .001; ****P < .0001.
Co-incubation with daratumumab (DARA) or pomalidomide (POM) enhances talquetamab-mediated lysis. (A) BM-MNCs obtained from 8 NDMM, 11 daratumumab-naïve RRMM. and 6 daratumumab-refractory RRMM patients were incubated for 48 hours with serial dilutions of talquetamab (0.00128-0.8 µg/mL) with or without daratumumab 0.1 µg/mL. Surviving MM cells were enumerated using flow cytometry. (B) The effect of talquetamab with or without daratumumab on the frequency of CD38+ T cells, CD38+ CD4+ T cells, and CD38+ CD8+ T cells was assessed by flow cytometric analysis. (C) The impact of talquetamab with or without daratumumab on T-cell lysis, T-cell activation (CD25 positivity), and T-cell degranulation (CD107a positivity) was determined by flow cytometry. (D) For pomalidomide experiments, BM-MNCs obtained from 5 NDMM, 1 RRMM, and 7 DARA-R MM patients were incubated for 48 hours with serial dilutions of talquetamab (0.00128-4.0 µg/mL) with or without pomalidomide (2 µM). MM cell lysis was assessed by flow cytometry. (E) T-cell lysis, T-cell activation (CD25 positivity) and T-cell degranulation (CD107a positivity) were measured by flow cytometry. (F) Granzyme B concentration was measured in the cell-culture supernatants of BM-MNCs, obtained from 5 patients, treated for 48 hours with serial dilutions of talquetamab (0.00128-0.8 µg/mL) with or without pomalidomide (2 µM). Granzyme B concentrations are depicted as fold change compared with solvent control. (B-C,E-F) Results of talquetamab monotherapy were compared with combinatorial treatment by nonlinear regression analysis with matched 2-way ANOVA and Sidak’s posttest. (A-F) Data are depicted as mean ± SEM of individual experiments, performed in duplicate. *P < .05; **P < .01; ***P < .001; ****P < .0001.
Because of the immunomodulatory effects of pomalidomide, we also evaluated combination treatment with talquetamab and pomalidomide (2 µM) in 13 BM samples. We selected pomalidomide for these experiments because it has superior immune stimulatory activity, when compared with other approved IMiDs.27 Direct co-incubation with pomalidomide moderately enhanced talquetamab-mediated lysis of MM cells in an additive fashion, which was associated with increased T-cell numbers at suboptimal talquetamab concentrations, superior T-cell activation, and increased granzyme B secretion (Figure 7D-F; supplemental Figure 10B). We next cocultured pomalidomide-pretreated PB-MNCs and RPMI-8226 target cells with talquetamab, with or without pomalidomide for 4 days, and observed improved MM cell lysis with both drugs through additive effects (supplemental Figure 12A). With combined talquetamab-pomalidomide treatment, there was no significant change in the proportions of T-cell differentiation subsets, compared with what was observed with talquetamab alone. However, there was a trend toward a lower Treg frequency with combination treatment (supplemental Figure 12B).
Discussion
Our gene expression profiling and flow cytometry data show that MM cells express significantly higher levels of GPRC5D mRNA and protein when compared with normal plasma cells. In addition, our data complement the findings of Kodama et al20 that GPRC5D protein expression in the BM is restricted to plasma cells. Outside the BM, the GPRC5D gene is only expressed in differentiating cells that produce hard keratin.19,20,22 Importantly, heavily pretreated patients continue to express GPRC5D, indicating that IMiDs, PIs, and CD38-targeting antibodies do not markedly affect the expression of GPRC5D on MM cells.
The high expression in MM cells, across all stages of the disease, with no or only limited expression in normal tissues, renders GPRC5D a promising target for anti-MM immunotherapy. Indeed, our data show that talquetamab redirects T cells to MM cells by cross-linking the activating receptor CD3 on T cells and GPRC5D on the cell surface of the tumor cells. Talquetamab-mediated killing of MM cells occurs via the coupling of both CD4+ and CD8+ T cells with GPRC5D+ MM cells, which is followed by T-cell activation, pro-inflammatory cytokine secretion, and T-cell degranulation with release of cytotoxic molecules such as granzyme B.
Data on the efficacy of GPRC5D-bispecific antibodies against primary MM cells in patient samples are very limited. Activity of a GPRC5D bispecific antibody was only evaluated in MM cell lines in 1 study,20 whereas another report assessed activity in MM cell lines and only 4 thawed BM samples supplemented with exogenous T cells from healthy donors.28 We therefore evaluated talquetamab-mediated killing of MM cells in a large number of fresh patient samples (n = 45). To this end, we used mononuclear cells isolated from fresh BM aspirates obtained from patients, which not only contain MM cells but also autologous effector cells, stromal cells, and immune suppressor cells. This extensive analysis of ex vivo sensitivity to talquetamab, showed that the GPRC5D bispecific antibody effectively induced MM cell death without a difference in activity between samples obtained from newly diagnosed MM or heavily pretreated, double- or triple-class, refractory MM patients. In accordance with these results, we demonstrate in a MM cell line model that T cells from heavily pretreated patients had similar cytotoxic activity after stimulation with talquetamab, compared with T cells from healthy donors. These observations are remarkable because RRMM patients have a more immunosuppressive microenvironment.29,30 Furthermore, cumulative exposure to immunosuppressive therapies, such as dexamethasone and proteasome inhibitors, also contributes to impaired T-cell function during disease evolution.31,32 In addition, our data indicate that mechanisms of resistance to prior therapies such as IMiDs, PIs, and daratumumab do not result in reduced susceptibility to talquetamab-mediated lysis. Importantly, talquetamab triggers MM cell death regardless of presence of high-risk cytogenetic abnormalities. Even in samples obtained from patients with pPCL, which is considered the most aggressive plasma cell disorder, talquetamab exhibited substantial ex vivo activity.9,33 Furthermore, we show high antitumor activity of talquetamab against MM cells from a patient, who progressed during BCMA bispecific antibody treatment. More data are needed on the value of GPRC5D-targeting T-cell redirecting therapies after failure of BCMA-targeted therapy.
Talquetamab-mediated tumor cell lysis was variable across patient samples, with a significant positive association between GPRC5D expression on MM cells and the capability of talquetamab to kill MM cells. In addition, superior T-cell activation and degranulation was observed in samples with GPRC5D expression levels above the median. Importantly, the variability in response could not be solely explained by differential expression of GPRC5D. Indeed, we show that variability in the BM immune microenvironment also contributes to the differential ex vivo therapeutic efficacy of talquetamab. First, in experiments with MM cell lines and samples from MM patients, we demonstrate that higher E:T ratios at baseline are associated with improved elimination of MM cells by talquetamab. In samples with high E:T ratio, the relative abundance of T cells also resulted in reduced proportion of activated and degranulated T cells following talquetamab treatment. Second, a high proportion of T cells expressing PD-1 or HLA-DR at baseline negatively affected talquetamab activity. A possible explanation might be that exhausted or already activated T cells cannot adequately kill MM cells upon redirection. Furthermore, inferior anti-MM activity of talquetamab was observed in samples derived from elderly patients, which was accompanied by impaired T-cell activation and degranulation. These findings are in accordance with other studies showing an age-related decline of the immune system.34 Third, we observed decreased talquetamab-induced MM cell lysis and diminished T-cell activation in BM samples with high Treg counts, compared with samples with low Treg counts. In additional experiments, we show that Tregs can be redirected to MM cells in the presence of talquetamab. However, the cytotoxic capacity of redirected Tregs was significantly lower compared with conventional CD4+CD25− T cells, which was reflected by reduced production of IFN-γ, TNF-α, and IL-2. Our data are in line with a previous study showing that Tregs are capable of killing tumor cells through the granzyme/perforin pathway upon redirection with an EGFRvIII-specific bispecific antibody.35 In fact, Tregs also suppress immune responses via direct killing of effector T cells through release of perforin/granzyme effector molecules.36 Moreover, we show that Tregs impaired the ability of conventional T cells to kill MM cells. It is currently unknown to what extent Tregs will affect clinical outcome with bispecific antibodies in MM, but a high frequency of Tregs was associated with impaired response to the CD19xCD3 BiTE blinatumomab in patients with acute lymphoblastic leukemia.37 Additional studies are warranted to clarify the role of other immune suppressor cells, such as regulatory B cells and myeloid-derived suppressor cells, in modulating the ability of talquetamab to kill MM cells. Finally, similar to cell adhesion-mediated drug resistance, direct contact of MM cells with BMSCs contributed to the induction of talquetamab resistance, at least in part through reducing GPRC5D expression on MM cells. Additional studies are needed to fully elucidate how the BMSC-MM cell interaction in the microenvironment contributes to resistance against talquetamab.
Improved understanding of mechanisms that contribute to innate resistance to talquetamab may result in the rational design of new talquetamab-based combinations. Pending validation of our results in clinical studies, patients with high Treg counts may benefit from Treg depletion strategies, such as low-dose cyclophosphamide.38-40 In addition, combination strategies with established anti-MM agents could improve the efficacy of GPRC5D-targeting bispecific antibodies. We show that addition of the immunostimulatory drug pomalidomide or the CD38-targeting antibody daratumumab to talquetamab enhanced lysis of primary MM cells in an additive fashion. Coculture with pomalidomide increased talquetamab-mediated T-cell activation and granzyme B secretion. In additional cell line experiments, we showed that pomalidomide and talquetamab combination treatment was also associated with a trend toward a lower Treg frequency compared with talquetamab alone. This is in accordance to what was observed by Cho et al with the combination of pomalidomide and the BCMA-targeting bispecific antibody AMG-701.41 Daratumumab almost completely abrogated the talquetamab-mediated upregulation of CD38, but this had no negative impact on T-cell numbers. In fact, reduced CD38 expression on T cells may have beneficial immunomodulatory effects, because NADase activity of CD38 has been proposed to contribute to the development of T-cell exhaustion via reducing nicotinamide adenine dinucleotide levels.42 Indeed, CD38-targeting antibodies increase nicotinamide adenine dinucleotide levels in T cells, which leads to an enhanced antitumor T-cell immune response in mouse models.42 Daratumumab also moderately reduced the proportion of activated and degranulated T cells, which may be explained by our findings that besides T cells, also other cell types (eg, NK cells) are involved in killing MM cells with the combination of daratumumab and talquetamab.
The restricted GPRC5D expression profile indicates that the potential for undesired on target/off tumor effects is small. We hypothesized that GPRC5D-based therapy would have less impact on GPRC5Dlow normal PCs and thereby may lead to a lower frequency of hypogammaglobulinemia, which is frequently observed with CD38-targeted therapies23 and contributes to development of infections. Although at a low dose of talquetamab, lysis of normal PCs was modest; a higher dose resulted in substantial elimination of normal PCs. Ongoing clinical studies will demonstrate whether the relatively low GPRC5D expression on normal PCs translates into a lower frequency of hypogammaglobulinemia and infections.
In conclusion, we have confirmed the high expression of GPRC5D on malignant PCs and have demonstrated that talquetamab, a bispecific antibody that engages T cells to cells that express GPRC5D, has substantial activity against MM cell lines and primary MM cells. We show in ex vivo experiments that tumor-related factors, as well as differences in the composition of the BM microenvironment, including the frequency of effector cells (T cells) and immune suppressor cells (Tregs), contribute to the variability in response to talquetamab. Our data strengthen the preclinical rationale for the ongoing clinical trials evaluating talquetamab alone or in combination with daratumumab or pomalidomide in heavily pretreated MM patients43 (NCT03399799, NCT04634552, NCT04108195).
Parts of this manuscript were presented in abstract form at the 24th annual congress of the European Hematology Association, Amsterdam, The Netherlands, 13-16 June 2019; at the 17th biennial International Myeloma Workshop, Boston, MA, 12-15 September 2019; and at the 62nd annual meeting of the American Society of Hematology (virtual), 5-8 December 2020.
For original data, please contact n.vandedonk@amsterdamumc.nl.
Acknowledgments
The authors thank the International Myeloma Society for financial support (Young Investigator Award).
The studies presented here were supported by research funding by Janssen Research and Development.
Authorship
Contribution: C.P.M.V., M.E.C.B., K.A.F., A.V.d.J., R.B., and J.S. executed the experiments and analyzed and interpreted the results; A.A., A.W., R.I.V., and H.C.A. provided investigational antibodies; S.Z., M.K., G.M., P.S., and N.W.C.J.v.d.D. provided patient material; M.v.D. and R.K. analyzed and interpreted the results; S.Z., T.M., H.C.A., R.I.V., and N.W.C.J.v.d.D. designed the study and interpreted the results; C.P.M.V. and N.W.C.J.v.d.D. wrote the first draft of the manuscript; and all authors helped critically review the manuscript and checked the final version of it.
Conflict-of-interest disclosure: R.K. is currently employed by Skyline Dx. M.K. has received research support to his institution from Celgene/BMS, Janssen, and Karyopharm; reports advisory board/consultancy roles for Abbvie, Amgen, BMS/Celgene, GSK, Janssen, Karyopharm, and Takeda; and honoraria from BMS/Celgene, Janssen, and Takeda. P.S. has received honoraria from Amgen, BMS, Celgene, Janssen, Karyopharm, and Takeda and research funding from Amgen, Celgene, Janssen, Karyopharm, SkylineDx, and Takeda. S.Z. has received research funding from Celgene, Takeda, and Janssen Pharmaceuticals and serves on advisory boards for Janssen Pharmaceuticals, Sanofi, Celgene, Takeda, and Oncopeptides. T.M. has received research support from Janssen Pharmaceuticals, Genmab, Takeda, Onkimmune, and Gadeta. A.A., R.B., J.S., and A.W. are employees of Janssen Research and Development. R.I.V. is an employee of Johnson & Johnson (J&J) and has ownership interests (including stock, patents, etc) in J&J. A.A. and H.C.A. are former employees of Janssen and report equity ownership in J&J. N.W.C.J.v.d.D. has received research support from Janssen Pharmaceuticals, AMGEN, Celgene, Novartis, and BMS and serves on advisory boards for Janssen Pharmaceuticals, AMGEN, Celgene, BMS, Takeda, Roche, Novartis, Bayer, and Servier. The remaining authors declare no competing financial interests.
Correspondence: Niels W. C. J. van de Donk, Amsterdam UMC, Vrije Universiteit Amsterdam, Department of Hematology, Cancer Center Amsterdam, De Boelelaan 1117, 1081 HV Amsterdam, The Netherlands; e-mail: n.vandedonk@amsterdamumc.nl.

