

Key Points
Lenalidomide induces early T-cell activation and reprogramming, and restores long-term immune synapse formation in vivo in FL patients.
Preexisting effector T-cell and regulatory T-cell signatures may hamper response to lenalidomide-obinutuzumab combination in FL patients.

Abstract
The immunomodulatory drug lenalidomide is used in patients with follicular lymphoma (FL) with the aim of stimulating T-cell antitumor immune response. However, little is known about the effects of lenalidomide on T-cell biology in vivo in patients with FL. We thus undertook an extensive longitudinal immunologic study, including phenotypic, transcriptomic, and functional analyses, on 44 first-line and 27 relapsed/refractory patients enrolled in the GALEN trial (Obinutuzumab Combined With Lenalidomide for Relapsed or Refractory Follicular B-Cell Lymphoma) to test the efficacy of lenalidomide and obinutuzumab combination in patients with FL. Lenalidomide rapidly and transiently induced an activated T-cell phenotype, including HLA-DR, Tim-3, CD137, and programmed cell death protein 1 (PD-1) upregulation. Furthermore, sequential RNA-sequencing of sorted PD-1+ and PD-1– T-cell subsets revealed that lenalidomide triggered a strong enrichment for several gene signatures related to effector memory T-cell features, including proliferation, antigen receptor signaling, and immune synapse restoration; all were validated at the phenotypic level and with ex vivo functional assays. Correlative analyses pinpointed a negative clinical impact of high effector T-cell and regulatory T-cell percentages before and during treatment. Our findings bring new insight in lenalidomide mechanisms of action at work in vivo and will fuel a new rationale for the design of combination therapies.
Introduction
Follicular lymphoma (FL) is characterized by an indolent but heterogeneous clinical course.1 Numerous studies have shown that FL prognosis is tightly linked to the composition of its Janus-faced tumor microenvironment,2-4 with T-cell infiltration initially reported to be positively associated with good prognosis as opposed to macrophages.5 Subsequently, the heterogeneity of intratumoral T-cell composition and localization, including CD8+,6 programmed cell death protein-1 positive (PD-1+),7-11 or FoxP3+12-14 subsets, was variably associated with treatment efficacy. Another level of complexity was added when the prognostic value of some of these T cell–related parameters was found to depend on the therapeutic regimens.11 It is thus important to better understand the specific impact of any given therapy on FL T cells to fully harness its antitumor potential.
Within the developing armamentarium against FL, lenalidomide proved its efficacy as a single agent in relapsed/refractory (R/R) patients, which was further enhanced when combined with rituximab.15,16 This combination was reported to offer a promising therapeutic option for FL front-line therapy in three phase 2 studies,17-19 and it was subsequently reported in the phase 3 RELEVANCE (Rituximab Lenalidomide Versus Any Chemotherapy) trial to yield a response rate and progression-free survival (PFS) similar to those of the standard rituximab-chemotherapy regimen.20 The immunomodulatory activities of lenalidomide have been mostly described in multiple myeloma (MM) and chronic lymphocytic leukemia (CLL) and involved natural killer cells21-24 and T cells. In particular, lenalidomide was reported to activate CD8 T cells, inhibit regulatory T cells (Treg), restore T-cell immune synapse formation,25 and downregulate T-cell PD-1 expression.26,27 However, to what extent these properties are effective in vivo in patients with FL, especially in the context of a combination with anti-CD20 antibodies, remains unclear.
We sought to address this question in the GALEN clinical trial (Obinutuzumab Combined to Lenalidomide for Treatment of Relapsed/Refractory Follicular and Aggressive B-Cell Lymphoma; #NCT01582776) evaluating the efficacy of obinutuzumab combined with lenalidomide in first-line and R/R patients with FL.28,29 A phase 1b trial has previously shown that R/R patients with FL exhibited HLA-DRhi activated T-cell phenotype28 and restoration of natural killer cytotoxic functions22 under this association. In addition, CD20 expression on FL cells, unlike CLL cells,30 was unaltered by lenalidomide, which was introduced 1 week before the first obinutuzumab infusion.29 In the current work, we further investigated, based on thorough phenotypic, transcriptomic, and functional studies, the lenalidomide-dependent T-cell activation in R/R patients as well as first-line patients with FL included in the phase 2 part of the GALEN trial.
Materials and methods
Patient cohort and samples
Two independent cohorts from the GALEN trial were evaluated here. Immune parameters were studied in 27 unselected patients (of 86 evaluable for efficacy) from the published R/R cohort28 and 44 unselected patients (of 100) from the first-line FL cohort. Of note, baseline characteristics of the biologically evaluated patients were similar to the whole R/R cohort, except that age at inclusion was lower (supplemental Table 1). Patients received: (1) oral lenalidomide once daily at 20 mg on days 0 to 20 of a 28-day cycle for the first cycle and on days 1 to 21 of a 28-day cycle for cycles 2 to 6; and (2) obinutuzumab at a flat dose of 1000 mg on day 7 (D7), D14, and D21 of the first cycle and at D0 of cycles 2 to 6 (total of 8 infusions). Thus, the 1-week delay before the first obinutuzumab infusion allowed for the analysis of changes in immune parameters induced by lenalidomide alone. Heparinized blood was drawn at D0 before lenalidomide intake, D7 before first obinutuzumab infusion, D28 after 1 week off lenalidomide at the end of the first cycle of treatment, and at the end of the sixth cycle of the induction phase (end). Peripheral blood mononuclear cells (PBMCs) were obtained after density gradient centrifugation (lymphocyte separation medium; Eurobio) and immediately used for flow cytometry analysis, immune synapse formation, Treg functional assays, and RNA-sequencing (RNA-seq) study. The research protocol was conducted under French legal guidelines and was approved by the local ethics committee.
Flow cytometry analyses
PBMCs were stained with the fluorochrome-conjugated monoclonal antibodies listed in supplemental Table 2 and analyzed with Kaluza software (Beckman Coulter). For Treg determination and Ki-67 staining, cells were fixed and permeabilized by using the Foxp3/Transcription Factor Staining Buffer Set (eBioscience). Ki-67, PD-1, Tim-3, and CD137 expression were expressed as the percentage of positive events compared with isotype controls. For HLA-DR expression, brightly fluorescent events were gated. CD4 and CD8 T-cell subsets were defined among viable CD45+/CD3+ cells as CCR7+/CD45RAhi naive T cells, CCR7+/CD45–/lo central memory (CM) T cells, CCR7–/CD45RA– effector memory (EM) T cells, and CCR7–/CD45RA+ terminally differentiated T cells. Treg were gated as CD45+/CD3+/CD4+/CD25hi/FoxP3+ events. Malignant B cells were gated as CD19+/low/CD10+ or CD19+/low/CD38low/CD44– events harboring light chain isotypic restriction (>90% κ or λ).
RNA-seq analysis of sorted T cells
RNA-seq was performed on paired samples collected at D0 and D7 from 6 patients with FL. For each sample, T-cell subsets were sorted as CD3+/CD4+/CD8–/PD-1–, CD3+/CD4+/CD8–/PD-1+, CD3+/CD4–/CD8+/PD-1–, and CD3+/CD4–/CD8+/PD-1+ events on a BD FACS Aria IIu (Becton Dickinson) (supplemental Figure 1). RNA processing and RNA-seq analysis are detailed in the supplemental Methods.
Proliferation assay
PBMCs were labeled with 0.2 μM carboxyfluorescein succinimidyl ester (CFSE; Interchim) and subsequently stimulated for 6 days by using agonistic 0.5 µg/mL anti-CD3 and 0.0325 µg/mL anti-CD28 antibodies (Sanquin) as described elsewhere.31 Proliferation was evaluated by CFSE dilution assessed on CD4 and CD8 T cells gated by flow cytometry and quantified with the proliferation index calculated by using the ModFit LT software (Verity Software House).
Immune synapse assay
For a subset of first-line patients with FL, T cells were purified with Pan T Cell Isolation Kit II (Miltenyi Biotec) at various time points and used in an immune synapse assay as previously described.32,33 Briefly, CFSE-labeled B cells purified from healthy donor peripheral blood using B-cell Isolation Kit (Miltenyi Biotec) were incubated for 30 minutes at 37°C with a cocktail of superantigens (Staphylococcus Enterotoxin A and B, Toxic Shock Syndrome Toxin-1, 2 µg/mL each; all from Toxin Technology). FL T cells were then pelleted with B cells at a 1:1 ratio, and cells were coincubated for 5 minutes at 37°C. The cell pellet was gently resuspended and deposited on a polylysine slide in a 1.5-cm diameter spot for another 10-minute round of incubation before fixation for 15 minutes with 4% paraformaldehyde and permeabilization for 5 minutes with Triton 0.3%. Actin network was stained overnight with phalloidin conjugated to Alexa Fluor 546. After a final washing step, slides were mounted with Mowiol mounting medium (Sigma-Aldrich), and T/B conjugates were analyzed by confocal microscopy by an operator blinded to patient identity. At least 50 conjugates per slides were scored for actin distribution at the T-cell surface, creating a mean synapse score. Conjugates showing a distinct polymerized actin band at the T-cell contact site were scored at 1, conjugates lacking actin polarization were attributed a score = 0, and intermediate patterns showing weak protein polymerization were given a score = 0.5.
Statistical methods
Comparisons of data between groups were conducted by using the nonparametric Wilcoxon test for matched pairs or the nonparametric Mann-Whitney U test, as appropriate. Response to treatment was evaluated based on Cheson 1999 morphologic criteria after 3 cycles of treatment. Responders corresponded to patients in complete response, unconfirmed complete response, and partial response. Nonresponders included patients with stable disease or progressive disease. Cox proportional hazards model was used to determine hazard ratios, confidence intervals (CIs) at the 95th confidence level, and P values. All statistical tests were two-sided, and P values <.05 were considered statistically significant. Analysis of flow cytometry data was performed by using GraphPad Prism version 5.00 (GraphPad Software Inc.) and R version 3.6.0 (www.R-project.org; R Foundation for Statistical Computing). RNA-seq data were analyzed with DESeq2, DOSE, factoextra, ggplot2, ggrepel, grid, gridExtra, prcomp, scales, survival, survminer, and vennDiagram R packages. Gene Set Enrichment Analysis (GSEA) evaluations were performed with the GSEA version 4.1.0 application.34,35
Results
Lenalidomide induces an activated phenotype in vivo in FL patient T cells
We queried whether T-cell activation reported in patients with MM and CLL occurred in FL patients upon lenalidomide treatment and if it was influenced by disease course. We thus evaluated in 2 cohorts of 44 first-line patients and 27 R/R patients with FL the expression of a panel of activation and/or exhaustion markers, including HLA-DR, CD137, PD-1, and Tim-3, on peripheral blood T cells before treatment (D0), after 1 week of lenalidomide alone (D7), after the first cycle of treatment by lenalidomide and obinutuzumab (D28), and at the end of induction (end). All these markers were significantly increased on CD4 and CD8 T cells within 1 week of lenalidomide treatment alone in both the first-line cohort (Figure 1A) and the R/R FL cohort (supplemental Figure 2). However, these changes were transient, as respective expression of almost all markers returned to baseline levels at the end of the first cycle of treatment. Interestingly, a majority of PD-1+ CD4 and CD8 T cells coexpressed Tim-3+ and high levels of HLA-DR at D7, contrary to D0 (supplemental Figure 3A). In agreement, we found in the first-line FL cohort no strong correlation between PD-1 and Tim-3 or between PD-1 and HLA-DR expression at D0, irrespective of the T-cell subtype, whereas expression of PD-1 and CD137 were correlated for CD8 but not for CD4 T cells (Figure 1B-C). Conversely, after 1 week of lenalidomide treatment, PD-1 expression was tightly correlated with Tim-3, HLA-DR, and CD137 in both CD4 and CD8 T cells, suggesting that PD-1+ T cells corresponded to functionally different T-cell subsets at D0 vs D7. Similar observations were made in the R/R cohort (supplemental Figure 3B-C). In summary, lenalidomide triggers, in both untreated and chemoimmunotherapy-pretreated patients with FL, a peculiar activated T-cell phenotype characterized by upregulation of PD-1 expression together with Tim-3 induction and HLA-DR increase.
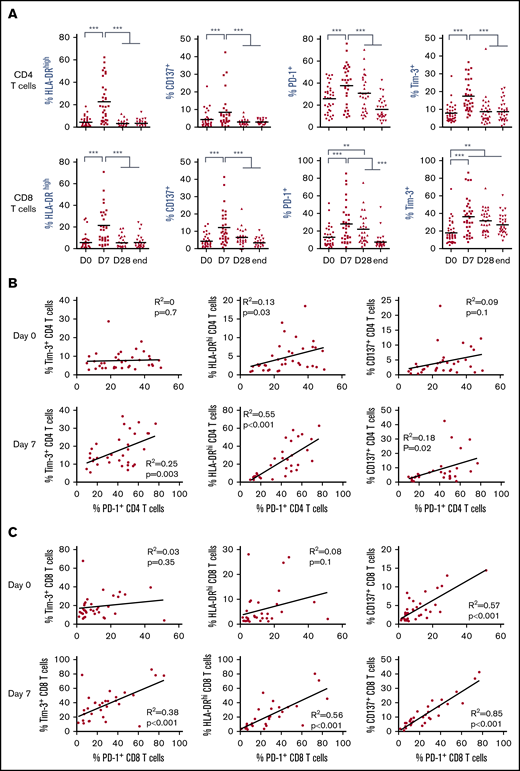
Lenalidomide activates FL patient T cells in vivo. (A) Expression of HLA-DR, CD137, PD-1, and Tim-3 by circulating CD4 and CD8 T cells measured by flow cytometry at the indicated time points. D0, first day of the first cycle of treatment (before lenalidomide intake); D7, seventh day of the first cycle (before obinutuzumab infusion); D28, first day of the second cycle (before lenalidomide intake); end, end of induction. Median values are depicted as red lines. **P < .01, ***P < .001, multiple paired samples Wilcoxon tests. (B) Correlations between PD-1 and Tim-3 expression (left panels), PD-1 and HLA-DR expression (middle panels), and PD-1 and CD137 expression (right panels) on CD4 T cells at D0 (upper row) and D7 (lower row). (C) Correlations between PD-1 and Tim-3 expression (left panels), PD-1 and HLA-DR expression (middle panels), and PD-1 and CD137 expression (right panels) on CD8 T cells at D0 (upper row) and D7 (lower row).
Lenalidomide activates FL patient T cells in vivo. (A) Expression of HLA-DR, CD137, PD-1, and Tim-3 by circulating CD4 and CD8 T cells measured by flow cytometry at the indicated time points. D0, first day of the first cycle of treatment (before lenalidomide intake); D7, seventh day of the first cycle (before obinutuzumab infusion); D28, first day of the second cycle (before lenalidomide intake); end, end of induction. Median values are depicted as red lines. **P < .01, ***P < .001, multiple paired samples Wilcoxon tests. (B) Correlations between PD-1 and Tim-3 expression (left panels), PD-1 and HLA-DR expression (middle panels), and PD-1 and CD137 expression (right panels) on CD4 T cells at D0 (upper row) and D7 (lower row). (C) Correlations between PD-1 and Tim-3 expression (left panels), PD-1 and HLA-DR expression (middle panels), and PD-1 and CD137 expression (right panels) on CD8 T cells at D0 (upper row) and D7 (lower row).
Lenalidomide-induced PD-1+ T cells have a specific gene expression profile
Owing to the ambiguous nature of PD-1 as an activation and exhaustion marker,36,37 we then decided to determine a better picture of lenalidomide-induced PD-1+ T cells. For this purpose, we sorted fresh PD-1+ and PD-1– subsets of CD4 and CD8 T cells from the blood of 6 first-line patients with FL at D0 and D7 (before any obinutuzumab infusion) and submitted them to RNA-seq. Unsupervised principal component analysis segregated samples following CD4 vs CD8 T-cell identity along the PC2 axis (Figure 2A), whereas the PC1 axis reflected a composite signature related to PD-1 status and proliferation-related genes (supplemental Figure 4). Interestingly, the vectors summarizing gene expression profile modifications between D0 and D7 suggested that the PC1 axis also highlighted lenalidomide impact, in particular for PD-1–expressing T-cell subsets. In agreement, the comparison of D7 vs D0 gene expression profiles identified 341 differentially expressed genes for PD-1– CD4 T cells, 2297 for PD-1+ CD4 T cells, 191 for PD-1– CD8 T cells, and 859 for PD-1+ CD8 T cells (supplemental Table 3). When inferring canonical pathways and biological processes using GSEA, we found no downregulated pathway in either PD-1– or PD-1+ subsets after 1 week of lenalidomide compared with before therapy. More importantly, the vast majority of upregulated Reactome pathways after 1 week of lenalidomide were found in both PD-1+ T-cell subsets (214 and 199 for CD4 and CD8 T cells, respectively) with 63% overlap (P = 9.10−59 in a hypergeometric test (Figure 2B; supplemental Figure 5). Of the top upregulated biological processes in PD-1+ T cells, some of obvious relevance for lenalidomide activity, such as “Cell Cycle,” “Signal Transduction,” and “Immune System” (Figure 2C; supplemental Table 4), comprised nearly one-half of the total number of significantly upregulated pathways for PD-1+ CD4 and CD8 T-cell subsets. Taken together, these results highlight a specific pattern of transcriptomic modifications induced in vivo by lenalidomide in PD-1+ FL T cells.
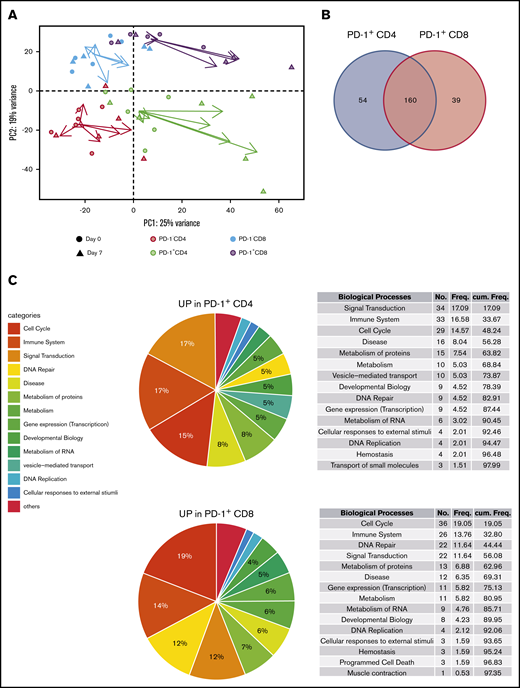
Lenalidomide-induced PD-1+T cells display a specific transcriptomic profile. (A) Principal component analysis of PD-1– CD4 T cells (salmon symbols), PD-1+ CD4 T cells (green symbols), PD-1– CD8 T cells (blue symbols), and PD-1+ CD8 T cells (purple symbols), collected before and after 1 week of lenalidomide. For each cell subset, the vector directed from D0 to D7 is reported, starting from the centroid of the corresponding T-cell subset and colored accordingly. (B) Venn diagram of the Reactome pathways upregulated by lenalidomide in PD-1+ CD4 T cells and PD-1+ CD8 T cells. (C) Pie charts and ranked list of the top 15 biological processes activated by 1 week of lenalidomide treatment in PD-1+ CD4 (upper row) and PD-1+ CD8 T cells (lower row).
Lenalidomide-induced PD-1+T cells display a specific transcriptomic profile. (A) Principal component analysis of PD-1– CD4 T cells (salmon symbols), PD-1+ CD4 T cells (green symbols), PD-1– CD8 T cells (blue symbols), and PD-1+ CD8 T cells (purple symbols), collected before and after 1 week of lenalidomide. For each cell subset, the vector directed from D0 to D7 is reported, starting from the centroid of the corresponding T-cell subset and colored accordingly. (B) Venn diagram of the Reactome pathways upregulated by lenalidomide in PD-1+ CD4 T cells and PD-1+ CD8 T cells. (C) Pie charts and ranked list of the top 15 biological processes activated by 1 week of lenalidomide treatment in PD-1+ CD4 (upper row) and PD-1+ CD8 T cells (lower row).
Lenalidomide triggers T-cell proliferation in vivo in patients with FL
To confirm our findings, we decided to validate some relevant pathways at the functional level. Several were linked to the regulation of various steps of cell cycle, mitosis, or DNA replication (Figure 3A). When we quantified peripheral blood T-cell proliferation by Ki-67 staining, a dramatic but transient increase after 1 week of lenalidomide was noted in both the first-line and the R/R FL samples (Figure 3B). Based on previous studies performed in CLL and MM patients,38 we queried whether this strong increase of T-cell proliferation could be ascribed to a blockade of Treg immunosuppressive properties by lenalidomide. Treg proliferation was induced by 1 week of lenalidomide and returned to baseline upon cessation of the drug at the end of the first treatment cycle (supplemental Figure 6A). In agreement, Treg absolute count showed a minor and transient increase after 1 cycle in both the first-line and the R/R cohort (supplemental Figure 6B).
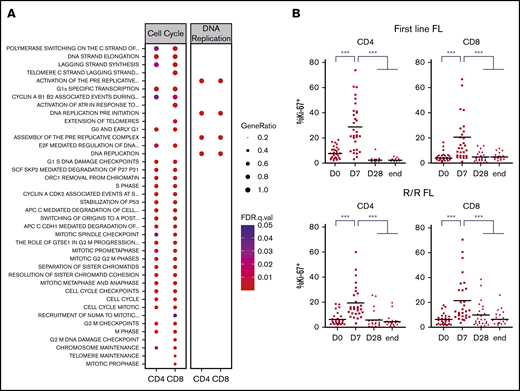
Lenalidomide triggers T-cell proliferation in vivo in first-line and R/R patients with FL. (A) List of canonical pathways related to cell cycle and DNA replication upregulated in PD-1+ T cells. (B) Ki-67 expression by circulating CD4 and CD8 memory T cells in first-line (upper row) or R/R patients with FL (lower row) measured by flow cytometry at the indicated time points. D0, first day of the first cycle of treatment (before lenalidomide intake); D7, seventh day of the first cycle (before obinutuzumab infusion); D28, first day of the second cycle (before lenalidomide intake); end, end of induction. Median values are depicted as red lines. ***P < .001, multiple paired samples Wilcoxon tests. FDR, false discovery rate; .q.val, q-value.
Lenalidomide triggers T-cell proliferation in vivo in first-line and R/R patients with FL. (A) List of canonical pathways related to cell cycle and DNA replication upregulated in PD-1+ T cells. (B) Ki-67 expression by circulating CD4 and CD8 memory T cells in first-line (upper row) or R/R patients with FL (lower row) measured by flow cytometry at the indicated time points. D0, first day of the first cycle of treatment (before lenalidomide intake); D7, seventh day of the first cycle (before obinutuzumab infusion); D28, first day of the second cycle (before lenalidomide intake); end, end of induction. Median values are depicted as red lines. ***P < .001, multiple paired samples Wilcoxon tests. FDR, false discovery rate; .q.val, q-value.
In addition to this quantitative analysis, we evaluated their immunosuppressive potential by comparing T-cell proliferation ex vivo with or without Treg depletion39 (supplemental Figure 6C). Before lenalidomide, CD4 and CD8 T-cell proliferation was not significantly increased when Treg were removed. Conversely, after 1 week of lenalidomide, T-cell proliferative capacity was enhanced in the absence of Treg, showing that Treg were still suppressive under lenalidomide treatment. As a whole, this functional evaluation indicates that lenalidomide triggers T-cell proliferation without abrogating Treg activity.
Lenalidomide shifts T cells toward EM subset
Induction of T-cell proliferation can occur upon cytokine stimulation and/or encounter of the T-cell receptor (TCR) cognate antigen, the latter being a prerequisite to become memory cells. In this line, many pathways relevant for T-cell activation were found upregulated by lenalidomide such as cytokine or TCR signaling, and antigen presentation (Figure 4A). In particular, several pathways linked to interferon-γ production and activity, such as interleukin-12 signaling, were found significantly upregulated in PD-1+ CD4 and CD8 T cells (supplemental Table 4), in line with the identification of interferon-γ signatures in patients with CLL treated with lenalidomide alone.40 Interestingly, other pathways more specific to effector T-cell metabolism could be identified,41 including pathways linked to citric acid cycle and adenosine triphosphate production. Hence, we quantified naive and memory T-cell subsets in the blood of GALEN patients (Figure 4B). One week of lenalidomide decreased the percentage of naive and CM CD4 and CD8 T cells, and conversely increased that of EM T cells without affecting terminally differentiated T cells. This switch to effector T cells occurred in first-line and R/R patients with FL (supplemental Figure 7) and seemed to be transient, resolving after 1 week off lenalidomide at the end of the first cycle of treatment. In agreement, the coexpression of PD-1 and Tim-3 was primarily found on EM and terminally differentiated CD4 T-cell subsets, and on EM CD8 T cells (supplemental Figure 8). Moreover, at the end of the induction course, the percentages of naive and CM CD8 T cells were higher than before treatment. Similar results were obtained when considering cell counts instead of cell percentages (supplemental Figure 9). Lastly, we supported our immunophenotyping results with relevant functional data. By definition, memory T cells are endowed with quicker and higher immune responses upon re-encounter with their cognate antigens. We thus restimulated patient T cells ex vivo with agonistic anti-CD3 and anti-CD28 antibodies and found that the resulting proliferation was statistically increased after 1 week of lenalidomide but returned to the basal level at the end of the first cycle (Figure 4C). These multiple lines of evidence indicate that lenalidomide triggers transient T-cell commitment into proliferative EM cells.
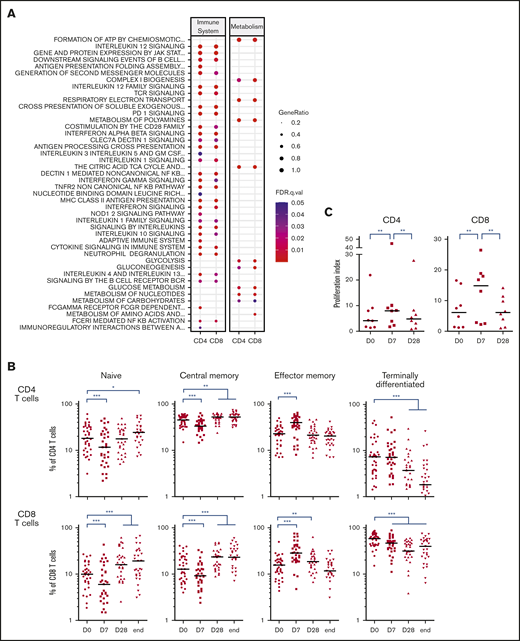
Lenalidomide shifts T-cell populations toward effector subset. (A) List of canonical pathways related to immune system and metabolism upregulated in PD-1+ T cells. (B) Percentages of naive, CM, EM, and terminally differentiated effector T cells assessed by flow cytometry in circulating CD4 (upper row) and CD8 T cells (lower row) of first-line patients with FL. (C) Proliferation index of CD4 and CD8 T cells stimulated ex vivo by CD3 and CD28 cross-linking at the indicated time points. D0, first day of the first cycle of treatment (before lenalidomide intake); D7, seventh day of the first cycle (before obinutuzumab infusion); D28, first day of the second cycle (before lenalidomide intake). *P < .05, **P < .01, ***P < .001, multiple paired samples Wilcoxon tests.
Lenalidomide shifts T-cell populations toward effector subset. (A) List of canonical pathways related to immune system and metabolism upregulated in PD-1+ T cells. (B) Percentages of naive, CM, EM, and terminally differentiated effector T cells assessed by flow cytometry in circulating CD4 (upper row) and CD8 T cells (lower row) of first-line patients with FL. (C) Proliferation index of CD4 and CD8 T cells stimulated ex vivo by CD3 and CD28 cross-linking at the indicated time points. D0, first day of the first cycle of treatment (before lenalidomide intake); D7, seventh day of the first cycle (before obinutuzumab infusion); D28, first day of the second cycle (before lenalidomide intake). *P < .05, **P < .01, ***P < .001, multiple paired samples Wilcoxon tests.
Lenalidomide plus obinutuzumab combination triggers long-term T-cell immune synapse repair
Multiple canonical pathways related to cell migration, cell adhesion, and cytoskeleton multifaceted activities were upregulated at 1 week of lenalidomide (Figure 5A). This prompted us to monitor how lenalidomide affected in vivo T-cell capacity to form an immune synapse with B cells. We performed this assay in 7 first-line and 2 R/R patients with FL before and during the course of treatment. The synapse score, evaluating semi-quantitatively the recruitment of actin protein to the immune synapse (Figure 5B), was increased in all 9 patients as early as D7. Interestingly, this synapse score remained stable afterward, even following the lenalidomide off-period at the end of cycles 1 and 6 (Figure 5C-D). Of note, the 2 patients presenting with detectable circulating FL B cells did not display a lower initial synapse score, which was increased to a similar extent as nonleukemic patients by 1 week of lenalidomide. These data reveal that T-cell immune synapse can be repaired by lenalidomide in vivo in patients with FL and that this effect is not antagonized, or even prolonged, by obinutuzumab.
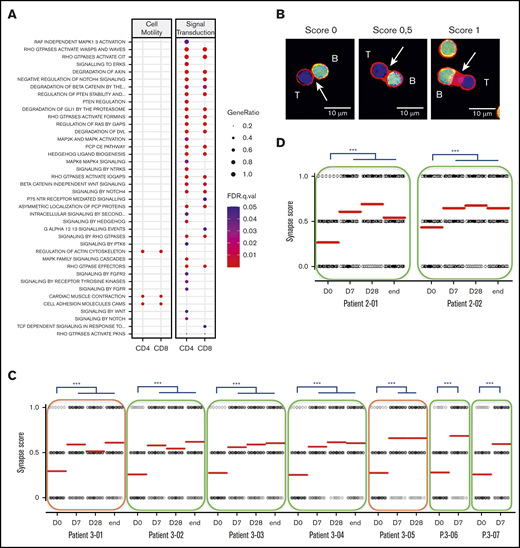
Lenalidomide repairs immune synapse on the long term. (A) List of canonical pathways related to cell motility and signal transduction upregulated in PD-1+ T cells. (B) Individual conjugates from mixed experiments using purified patient T cells (blue) with healthy allogeneic B cells (green) were selected at random for imaging and scored semi-quantitatively for accumulation of F-actin (red) at the immune synapse. Synapse score measured in an ex vivo immune synapse assay in 7 first-line patients (C) and in 2 R/R patients with FL (D). Each dot relates to a single immune synapse, and at least 50 T/B conjugates were scored for each sample. Median values are depicted as red lines; green rectangles indicate patients with no detectable circulating lymphoma cells; and orange rectangles highlight 2 patients presenting with leukemic-phase disease. D0, first day of the first cycle of treatment (before lenalidomide intake); D7, seventh day of the first cycle (before obinutuzumab infusion); D28, first day of the second cycle (before lenalidomide intake); end, end of induction. ***P < .001, Dunn multiple comparisons test.
Lenalidomide repairs immune synapse on the long term. (A) List of canonical pathways related to cell motility and signal transduction upregulated in PD-1+ T cells. (B) Individual conjugates from mixed experiments using purified patient T cells (blue) with healthy allogeneic B cells (green) were selected at random for imaging and scored semi-quantitatively for accumulation of F-actin (red) at the immune synapse. Synapse score measured in an ex vivo immune synapse assay in 7 first-line patients (C) and in 2 R/R patients with FL (D). Each dot relates to a single immune synapse, and at least 50 T/B conjugates were scored for each sample. Median values are depicted as red lines; green rectangles indicate patients with no detectable circulating lymphoma cells; and orange rectangles highlight 2 patients presenting with leukemic-phase disease. D0, first day of the first cycle of treatment (before lenalidomide intake); D7, seventh day of the first cycle (before obinutuzumab infusion); D28, first day of the second cycle (before lenalidomide intake); end, end of induction. ***P < .001, Dunn multiple comparisons test.
Preexisting effector T-cell signature may hamper response to lenalidomide and obinutuzumab combination in patients with FL
We wondered whether these immune parameters would affect early clinical response to the lenalidomide plus obinutuzumab combination, based on computed tomography scan evaluation after 3 cycles of treatment. Nonresponders (ie, experiencing stable disease or progression) presented at baseline with significantly higher percentages of CD4 EM (median, 37.3% vs 15.4%; P = .016) and CD8 EM T cells (median, 11.5% vs 6.3%; P = .040) compared with responder patients (complete or partial response) (Figure 6A). In addition, univariate Cox model analysis also highlighted an association of the percentages of CD4 EM T cells and Treg before treatment with PFS (hazard ratios, 1.51 and 3.55; P = .016 and .005, respectively) (Figure 6B), which was retained at all later time points (D7, D28, and end of induction) (supplemental Figure 10A). Interestingly, the percentage and the number of Treg, unlike any other T cell–related parameter, were correlated with the number of circulating malignant FL B cells (data not shown), a parameter already associated with poor prognosis in the rituximab era.42-44

Overrepresentation of effector T cells at presentation may affect clinical response to lenalidomide and obinutuzumab treatment. (A) CD4 and CD8 EM T-cell percentages at baseline for responder (R) and nonresponder (NR) patients, as assessed by computed tomography scanning after 3 cycles of treatment. *P < .05, Mann-Whitney U test. (B) Forest plot of hazard ratios (HRs) based on PFS. The forest plot indicates the HRs with 95% confidence intervals and P values according to each variable.
Overrepresentation of effector T cells at presentation may affect clinical response to lenalidomide and obinutuzumab treatment. (A) CD4 and CD8 EM T-cell percentages at baseline for responder (R) and nonresponder (NR) patients, as assessed by computed tomography scanning after 3 cycles of treatment. *P < .05, Mann-Whitney U test. (B) Forest plot of hazard ratios (HRs) based on PFS. The forest plot indicates the HRs with 95% confidence intervals and P values according to each variable.
We then queried whether these results translated into discrete immunologic profiles that could be identified in blood at presentation. An unsupervised hierarchical clustering was performed on the 15 immunologic parameters available at presentation for the 27 R/R patients with FL, expressed as percentages of T-cell subsets. Three clusters could be identified containing 4, 13, and 10 patients, respectively (supplemental Figure 10B). Cluster 1 was characterized by high percentages of CD4 and CD8 EM T cells. Interestingly, these patients also had an overrepresentation of Treg. Conversely, patients of cluster 3 presented with high percentages of CD4 and CD8 naive and CM T cells and low expression of T-cell activation markers. Cluster 2 displayed a mixed profile. Survival analysis revealed cluster 1 to have a trend toward shorter median PFS (supplemental Figure 10C), but the difference did not reach statistical significance owing to the small number of patients (P = .09).
Discussion
The current study provides a detailed analysis of lenalidomide immunomodulatory effects on T cells through extensive phenotypic and functional evaluation of a large cohort of first-line and R/R patients with FL enrolled in the GALEN clinical trial. We found that lenalidomide induced early CD4 and CD8 T-cell activation characterized by Tim-3, HLA-DR, PD-1, and CD137 upregulation that translated into a rapid increase of effector T cells at the expense of naive and CM subsets. In addition, we showed for the first time in FL that lenalidomide improves in vivo T-cell ability to proliferate and mount an immune synapse in patients.
Many clinical studies previously reported on T-cell immunomodulation induced by lenalidomide in various hematologic malignancies, revealing a broad T-cell activation in virtually all tested patients. However, response rates widely differ across cancer types and between patients, emphasizing the need for more refined analysis of T cells under lenalidomide treatment to exploit its full clinical potential. In FL, analysis of immune cell subsets in the peripheral blood of 27 patients treated with lenalidomide plus rituximab as first-line therapy revealed an increase of CD4 and CD8 circulating memory T-cell counts after 1 cycle of treatment, simultaneously with increased expression of PD-1 on CD8 T cells.17 However, lenalidomide and rituximab were initiated together in this trial, making it impossible to delineate their respective contribution to immune phenotype modulation. In addition, no early assessment of immune parameters was performed in this work, and it remains unclear whether immunophenotypes assessed at late time points reflect immunomodulation induced by lenalidomide plus rituximab combination or are merely the consequence of tumor shrinkage, as recently suggested in patients with FL treated by rituximab alone.45
Our current work shows that lenalidomide rather induces an early decrease of CM and naive T cells in line with a surge of EM T cells. We also observed an increase of CM T cells starting after 1 cycle of treatment that could be related to anti-CD20 activity and/or to lenalidomide cessation. Finally, we reported an increased expression of PD-1 but also Tim-3 by CD4 and CD8 T cells under lenalidomide treatment, raising the concern that this drug could induce T-cell exhaustion. However, although PD-1 and Tim-3 are pivotal immune checkpoints, they were originally reported to be induced after TCR activation.46,47 In this line, we did not find any enrichment in public signature of T-cell exhaustion in our set of genes differentially expressed by PD-1+ T cells under lenalidomide treatment (data not shown). Rather, these cells upregulated pathways associated with effector functions such as proliferation, anabolic metabolism, and cytoskeleton dynamics and thus may be considered as activated. Further studies are needed to rule out exhaustion at later time points and consider therapeutic combination with immune checkpoint blockers on a rational basis. Indeed, PD-1 blockade has led to low and nondurable responses in patients with FL,48 and association with lenalidomide would be interesting to alleviate the inhibitory signal delivered by PD-L1+ tumor-associated macrophages.10,49
A major limitation of our study is the lack of in situ analysis. Interestingly, a recent study proposed that lenalidomide overcomes the adverse prognostic value of tumor-infiltrating PD-1+ T cells and T helper 17 cells found in patients treated with rituximab only, whereas high amounts of GATA-3+ T helper 2 cells were associated with better PFS in patients receiving the lenalidomide and rituximab combination.50,51 Further analyzing such parameters in the obinutuzumab/lenalidomide area would be of utmost interest.
Another FL study recently reported that in vitro exposure to lenalidomide could enhance T-cell proliferation in response to TCR activation.22 Our ex vivo assays confirmed and extended this observation, showing that it occurred in vivo in patients treated with lenalidomide. The follow-up of Ki-67 proliferation marker further supported the lenalidomide potential to directly trigger T-cell proliferation in vivo.
FL B cells can develop immune escape mechanisms to avoid activated T-cell cytotoxicity, including, among others, immunologic synapse dysfunction.33 This can be ascribed to a defective recruitment of critical signaling proteins to the T-cell synapse, as reported in vitro with FL B cells and in vivo in patients with CLL, and is supposedly induced by inhibitory ligands expressed by tumor cells. This defect could be corrected by lenalidomide treatment in vitro.22,27,32,33 Our results extend these reports by showing that T-cell immune synapse can be repaired in vivo in patients with FL treated by lenalidomide and that this restoration persists after off-periods of the drug, unlike immunophenotypic or cell proliferation changes. As recently reported with rituximab,22 obinutuzumab is unlikely to have any significant direct role in T-cell immune synapse, suggesting that lenalidomide is responsible on its own for this long-lasting improvement. Experiments are underway to decipher the molecular determinants of lenalidomide’s short- and long-term effects.
The association of EM subsets and Treg overrepresentation is reminiscent of the known tumor escape mechanism represented by Treg amplification blunting the effector T-cell attack.52-54 The lack of Treg inhibition that we observed in the GALEN trial argues against Treg being a significant target of lenalidomide. Rather, it opens a new avenue for improvement of lenalidomide-based regimens with Treg-depleting agents, as has been exemplified in the REPEAT (Revlimid, Endoxan, Prednisone Evaluation After Prior Revlimid Treatment) study, in which lenalidomide refractoriness in patients with MM was rescued by low-dose cyclophosphamide.55
In summary, we showed that lenalidomide activates T-cell effector functions in first-line and R/R patients with FL. These important new findings regarding lenalidomide’s basic mechanisms in vivo may provide new rationale for lenalidomide-based combinations, especially in a chemotherapy-free perspective.56
RNA-sequencing data are available via the National Center for Biotechnology Information Gene Expression Omnibus repository (https://www.ncbi.nlm.nih.gov/geo/; accession number GSE158438).
Acknowledgments
The authors thank the patients and their families, the Lymphoma Academic Research Organization team for the management of the study, and the reviewers at the Lymphoma Study Association. They acknowledge the GenOuest bioinformatics core facility (https://www.genouest.org) for providing the computing infrastructure. The authors acknowledge their use of the GSEA software and the Molecular Signature Database (MSigDB) (PMID, 16199517) (http://www.broad.mit.edu/gsea).
This study was supported by investigator-initiated study grants from Celgene and Roche. F.M. has received honoraria from Celgene Research & Development.
Authorship
Contribution: C.M. designed and performed experiments, analyzed data, and wrote the paper; D.R. analyzed data and contributed writing; J.D., T.-T.N., M.L., N.B., I.B., M.C., and I.P. performed experiments; R.H. designed the clinical study; F.M. designed the clinical study and contributed to the funding of the biological study; K.T. designed and supervised research, analyzed data, and wrote the paper; and all authors participated in the manuscript development process and provided final approval of the manuscript for submission.
Conflict-of-interest disclosure: C.M. has received research funding from Celgene and honoraria from Celgene and Bristol Myers Squibb. K.T. has received research funding from Celgene and honoraria from Celgene and Roche. The remaining authors declare no competing financial interests.
Correspondence: Karin Tarte, INSERM, UMR U1236, Faculté de Médecine, 2 Avenue du Pr Léon Bernard, F-35043 Rennes; e-mail: karin.tarte@univ-rennes1.fr; or Cédric Ménard, SITI Laboratory, Centre Hospitalier Universitaire Pontchaillou, 2 rue Henri Le Guilloux, 35033 Rennes, France; e-mail: cedric.menard@chu-rennes.fr.

