

Key Points
The spleen is a sanctuary site for residual disease after monotherapy ABT-199 treatment in ETP-ALL.
Single-cell RNA-sequencing identifies induction of T-cell differentiation genes in the spleen after ABT-199 treatment.

Abstract
B-cell lymphoma 2 (BCL-2) has recently emerged as a therapeutic target for early T-cell progenitor acute lymphoblastic leukemia (ETP-ALL), a high-risk subtype of human T-cell ALL. The major clinical challenge with targeted therapeutics, such as the BCL-2 inhibitor ABT-199, is the development of acquired resistance. We assessed the in vivo response of luciferase-positive LOUCY cells to ABT-199 monotherapy and observed specific residual disease in the splenic microenvironment. Of note, these results were confirmed by using a primary ETP-ALL patient-derived xenograft. Splenomegaly has previously been associated with poor prognosis in diverse types of leukemia. However, the exact mechanism by which the splenic microenvironment alters responses to specific targeted therapies remains largely unexplored. We show that residual LOUCY cells isolated from the spleen microenvironment displayed reduced BCL-2 dependence, which was accompanied by decreased BCL-2 expression levels. Notably, this phenotype of reduced BCL-2 dependence could be recapitulated by using human splenic fibroblast coculture experiments and was confirmed in an in vitro chronic ABT-199 resistance model of LOUCY. Finally, single-cell RNA-sequencing was used to show that ABT-199 triggers transcriptional changes in T-cell differentiation genes in leukemic cells obtained from the spleen microenvironment. Of note, increased expression of CD1a and sCD3 was also observed in ABT199-resistant LOUCY clones, further reinforcing the idea that a more differentiated leukemic population might display decreased sensitivity toward BCL-2 inhibition. Overall, our data reveal the spleen as a site of residual disease for ABT-199 treatment in ETP-ALL and provide evidence for plasticity in T-cell differentiation as a mechanism of therapy resistance.
Introduction
T-cell acute lymphoblastic leukemia (T-ALL) is an aggressive hematologic malignancy arising from immature T-lymphoid cells.1 Importantly, although T-ALL initially develops in the thymus, it spreads via the blood to diverse sites, including bone marrow, lymph nodes, liver, spleen, and the central nervous system. Different microenvironments can provide essential growth and survival signals to leukemic cells and can contribute to therapy resistance.2,3
A T-ALL subtype derived from the early T-cell precursors (ETPs) was originally identified based on immunophenotype and gene expression and was characterized with poor prognosis, with a high risk of relapse.4 Intensifying chemotherapy based on evidence of residual disease has improved the outcome of patients with ETP-ALL, with recent evidence of overall survival similar to that of other subtypes of T-ALL.5,6 However, intensified treatment is highly aggressive and is associated with many long-term toxic side effects, especially for young children.7 In addition, relapse cases are often refractory to treatment, and therefore alternative and less toxic therapeutic strategies are needed.8
Previous work from our laboratories and others showed that ETP-ALL is dependent on the antiapoptotic protein B-cell lymphoma 2 (BCL-2) for survival and is sensitive to the BH3 mimetic ABT-199.9-12 Of clinical importance, ABT-199 is the first BH3 mimetic to be approved by the US Food and Drug Administration for the treatment of chronic lymphocytic leukemia (CLL)13 and acute myelogenous leukemia14 combined with demethylating agents.15,16 A recent case report also described the first response of a patient with ETP-ALL to ABT-199.17
One of the challenges with targeted therapeutics such as ABT-199 is the development of acquired resistance. Numerous cell-autonomous mechanisms of resistance to ABT-199 have recently been described.18-20 The goal of the current study was to identify sites of residual disease in vivo after ABT-199 treatment. Here, we show an important and previously undescribed function for the spleen as a potential site of disease relapse after ABT-199 treatment in T-ALL. The spleen reduces BCL-2 dependence in ETP-ALL and evokes a distinct dynamic transcriptional program, potentially driving plasticity in T-cell differentiation during ABT-199 treatment.
Materials and methods
Cell lines
The LOUCY cell line was a kind gift from Alejandro Gutierrez, and the human bone marrow stroma cell line (HS-5 CRL-11882) was purchased from the ATCC. Human splenic fibroblasts (HSF; #5530) were purchased from ScienCell Research Laboratories. The ASN_R LOUCY cell line was generated in mice in the laboratory of Arnon Lavie. Details on growth conditions and treatments are provided in the supplemental Materials and methods.
BH3 profile
For BH3 profiling, 2 million cells were suspended in 100 µL of fluorescence-activated cell sorter buffer (1% fetal bovine serum, 0.4% EDTA [2 mM] in phosphate-buffered saline, final pH 7.4). Details on the methods are provided in the supplemental Materials and methods.
In vivo establishment of LOUCY xenograft and ABT-199 treatment regimen
Luciferase-positive LOUCY cells were generated as previously described.10 Mice experiments were conducted in Ghent University Hospital. The ethical committee on animal welfare at Ghent University Hospital approved all animal experiments.
After 4 weeks’ engraftment, mice were treated daily by oral gavage with 50 mg/kg ABT-199 or control for 2 weeks. For the 2-week LOUCY xenograft study, ABT-199 was resuspended in 2.5% dimethyl sulfoxide, 50% polyethylene glycol 300, 5% Tween 80, and 42.5% of 0.5% methyl cellulose in water. For the 3-week LOUCY xenograft study and ETP-ALL_PDX-1, ABT-199 was resuspended in 60% Phosal 50 propylene glycol, 30% polyethylene glycol 400, and 10% ethanol.
10X library preparation and sequencing
Isolated cells from bone marrow and spleen of vehicle and ABT-199 mice after 11 days of treatment were centrifuged at 4°C at 400g and resuspended in phosphate-buffered saline with 0.5 mM EDTA and 2% fetal calf serum to yield an estimated concentration of 1000 cells/µL. Cellular suspensions were loaded on a GemCode Single Cell 3′ Gel Bead and Library Kit (v2/v3 chemistry; 10x Genomics) according to the manufacturer’s instructions. Sequencing libraries were loaded on 2 lanes of an Illumina HiSeq4000 and sequenced following recommendations of 10v Genomics version 3 at the VIB Nucleomics Core (VIB). Further information is provided in the supplemental Materials and methods.
Statistical analysis
GraphPad Prism 8.0 software (GraphPad Software) was used for all statistical analyses. The flow cytometry data were analyzed by using either FACSDiva (BD Biosciences) or FlowJo (FlowJo LLC) software.
Results
Evidence of residual disease in the spleen of a LOUCY xenograft model after ABT-199 treatment
Previously, we showed that the ETP-ALL–like cell line LOUCY is sensitive to ABT-199 treatment9-11 (supplemental Figure 1A-B). Using a green flourescent protein (GFP)/luciferase–labeled LOUCY (GFP+/LUC+) cell line, we aimed to assess the in vivo response to ABT-199 treatment and determine potential sites of residual disease. Upon establishment of leukemia, mice were randomized to receive vehicle control or 50 mg/kg ABT-199 daily for 2 weeks (Figure 1A). To monitor the in vivo response to ABT-199, leukemic burden was measured via bioluminescent imaging21 (Figure 1B). ABT-199 treatment caused a statistically significant reduction in the whole-body flux measurements (Figure 1C) and a reduction in hCD45+ leukocytes in the peripheral blood (Figure 1D). Notably, although the flux measurements were overall decreased in the ABT-199–treated mice, there seemed to be a selective increase in the flux of the spleen over time. To quantify this finding, we measured the bioluminescence in the spleen as a ratio to the bioluminescence in the hind legs. In the vehicle-treated mice, the flux of the hind legs and spleen increased proportionally over time (Figure 1E). However, during ABT-199 treatment, the bioluminescence signal in the hind leg bones decreased, whereas the signal in the spleen increased, causing an increase in the ratio of up to sixfold (in 5 of 7 mice). These data suggest that the spleen is a preferential site of residual disease after ABT-199 treatment. We next measured the percentage of hCD45+ cells; although there was a significant reduction in the blood and bone marrow, the reduction in the spleen was minor after ABT-199 treatment (Figure 1F). However, there was still a reduction in the spleen weight after ABT-199 treatment (Figure 1G).

Development of ABT-199 resistance in the splenic niche of ETP-ALL xenograft models. (A) Experimental design for in vivo study. Fourteen female nonobese diabetic/severe combined immunodeficient ϒ (NSG) mice were injected with luciferase-positive LOUCY cells (LOUCY GFP+ LUC+) by intravenous tail vein injection. After leukemia establishment, the mice were randomized to either vehicle or ABT-199 (50 mg/kg) treatment daily for 14 days. (B) The bioluminescence21 was recorded after injection of luciferin on days 0, 3, 7, 10, and 14. Each column of pictures represents 1 individual mouse. (C) The total bioluminescence signals (mean ± SEM) were plotted relative to the starting value at day 0 for each mouse. (D) Peripheral blood hCD45+ cells count measured weekly by flow cytometry. Mean ± SEM for each group were plotted. (E) The total bioluminescence imaging (BLI) signals (mean ± SEM) from the spleen and the hind legs during 14 days of treatment were measured and plotted as relative to the starting value at day 0 for each mouse. (F) Percentages of hCD45+ in blood, bone marrow, and spleen in mice given vehicle (n = 7) or ABT-199 (n = 7 for blood; n = 4 for bone marrow and spleen) at the end point treatment. (G) Spleen weight for mice treated with vehicle (n = 7) and ABT-199 (n = 4) were measured (right panel). Median values are indicated by horizontal bars (mean ± SEM). Two-way analysis of variance test was used to calculate P values. Statistically significant differences are indicated: **P ≤ .01, ***P ≤ .001, ****P ≤ .0001.
Development of ABT-199 resistance in the splenic niche of ETP-ALL xenograft models. (A) Experimental design for in vivo study. Fourteen female nonobese diabetic/severe combined immunodeficient ϒ (NSG) mice were injected with luciferase-positive LOUCY cells (LOUCY GFP+ LUC+) by intravenous tail vein injection. After leukemia establishment, the mice were randomized to either vehicle or ABT-199 (50 mg/kg) treatment daily for 14 days. (B) The bioluminescence21 was recorded after injection of luciferin on days 0, 3, 7, 10, and 14. Each column of pictures represents 1 individual mouse. (C) The total bioluminescence signals (mean ± SEM) were plotted relative to the starting value at day 0 for each mouse. (D) Peripheral blood hCD45+ cells count measured weekly by flow cytometry. Mean ± SEM for each group were plotted. (E) The total bioluminescence imaging (BLI) signals (mean ± SEM) from the spleen and the hind legs during 14 days of treatment were measured and plotted as relative to the starting value at day 0 for each mouse. (F) Percentages of hCD45+ in blood, bone marrow, and spleen in mice given vehicle (n = 7) or ABT-199 (n = 7 for blood; n = 4 for bone marrow and spleen) at the end point treatment. (G) Spleen weight for mice treated with vehicle (n = 7) and ABT-199 (n = 4) were measured (right panel). Median values are indicated by horizontal bars (mean ± SEM). Two-way analysis of variance test was used to calculate P values. Statistically significant differences are indicated: **P ≤ .01, ***P ≤ .001, ****P ≤ .0001.
To confirm the spleen as a site of residual disease, a longer term LOUCY xenograft study was created, and mice were treated for an extended period of 21 days with ABT-199 (supplemental Figure 1C). An increase in circulating hCD45+ cells was observed from day 13, further supporting the development of ABT-199 resistance in vivo (supplemental Figure 1D). Although there was a slight reduction in the percentage of hCD45+ cells (18.4%) in the bone marrow following ABT-199 treatment, it was not significant (supplemental Figure 1E). Notably, an increase in spleen weight was detected in the ABT-199 group compared with the vehicle group (supplemental Figure 1F), along with a higher percentage of hCD45+ cells in the spleen of the ABT-199 group compared with the vehicle group (supplemental Figure 1G). A caveat is that the control mice were culled on day 17, while the ABT-199–treated mice were not culled until day 21. Altogether, these data indicate that the spleen acts as a site of residual disease in vivo after ABT-199 treatment in the xenograft LOUCY animal models.
The mouse splenic microenvironment alters BCL-2 dependence
Given evidence of residual leukemic cells in the spleen after ABT-199 treatment, we subsequently investigated if the mouse splenic microenvironment altered BCL-2 dependence. Leukemic cells were isolated from the spleen of vehicle-treated and ABT-199–treated mice at the end of the 2-week treatment and were BH3 profiled, along with LOUCY cells grown in vitro. LOUCY cells from the spleen of both the vehicle and ABT-199 groups had reduced response to BAD BH3 peptide and ABT-199 (used directly on permeabilized cells like a peptide) compared with the LOUCY cell line, suggesting that the mouse splenic microenvironment reduced BCL-2 dependence in vivo (Figure 2A-B). The response to the HRK BH3 peptide (selective for B-cell lymphoma extra long [BCL-XL]) was significantly increased in the splenic LOUCY cells (vehicle and ABT-199) compared with the in vitro cell line. Unfortunately, we did not isolate enough viable cells from the bone marrow of ABT-199–treated mice to be able to perform BH3 profiling. Altogether, BH3 profiling suggested that a compensatory shifting from BCL-2 dependence may occur in the splenic microenvironment.
![Mouse splenic microenvironment alters BCL-2 dependency in LOUCY cells. (A) Representative flow cytometry plots of gating the hCD45+ phycoerythrin (PE) cells. Percentage of cytochrome c release is normalized to dimethyl sulfoxide (DMSO) as negative control and alamethicin (ALM) as positive control. (B) BH3 profile on LOUCY cells isolated from the spleen of vehicle- and ABT-199–treated mice (n = 3 mice each group; mean ± standard deviation [SD]). (C) The mRNA expression of BCL-2, BCL-XL, and MCL-1 in LOUCY cells isolated from the spleen of each mouse was measured by using quantitative reverse transcription polymerase chain reaction. The mRNA gene expression was normalized to HMBS, TBP, and UBC. n = 3 mice each group; mean ± SD. (D-E) Ex vivo sensitivity of hCD45+ sorted from the spleen of vehicle-treated and ABT-199–treated mice (n = 4 each group) to BH3 mimetics, as assessed by using CellTiter-Glo (Promega). (D) ABT-199 treatment for 16 hours. (E) WEHI-539 treated for 6 hours. The results represent the mean of 2 independent experiments, and error bars indicate ± SD. Two-way analysis of variance with Dunnett’s post hoc test was used for statistical analysis. *P ≤ .05, **P ≤ .01, ***P ≤ .001, ****P < .0001. APC, allophycocyanin; SSC-A, side-scattered light area.](https://ash.silverchair-cdn.com/ash/content_public/journal/bloodadvances/5/7/10.1182_bloodadvances.2021004177/2/m_advancesadv2021004177f2.png?Expires=1767989454&Signature=N-xVliAUsLY2gmrqZVydMvqkfApp7E2ttOfAZEvfD1E01sW24sZ0sK814E4Ip1umlimVzoMlLeuJfZ8P80H1SJpVGEMfdHPTPXCJMn2nRj3tzZkmg30Lagr-mkJ3~EbrVA8Ne4CofegdAgleojY7CKGvCbY6K3-o4m8nDEbAph60xEAeCL~pKWaogGDc5bBJh8BMEh6O9M8AlXSan-2uZ1pKaDdEsS9DMAjaqmliN~iKM3QSCQ6hnpOjvnAa04e4mA6Ka8-GfTScmbz0l6rwLuPHG20tc5mvLXRQor5HadRT8B1qhAO7aRm4mL0u-i4Yb7w4t-Hwpw9b0dsamFm~OA__&Key-Pair-Id=APKAIE5G5CRDK6RD3PGA)
Mouse splenic microenvironment alters BCL-2 dependency in LOUCY cells. (A) Representative flow cytometry plots of gating the hCD45+ phycoerythrin (PE) cells. Percentage of cytochrome c release is normalized to dimethyl sulfoxide (DMSO) as negative control and alamethicin (ALM) as positive control. (B) BH3 profile on LOUCY cells isolated from the spleen of vehicle- and ABT-199–treated mice (n = 3 mice each group; mean ± standard deviation [SD]). (C) The mRNA expression of BCL-2, BCL-XL, and MCL-1 in LOUCY cells isolated from the spleen of each mouse was measured by using quantitative reverse transcription polymerase chain reaction. The mRNA gene expression was normalized to HMBS, TBP, and UBC. n = 3 mice each group; mean ± SD. (D-E) Ex vivo sensitivity of hCD45+ sorted from the spleen of vehicle-treated and ABT-199–treated mice (n = 4 each group) to BH3 mimetics, as assessed by using CellTiter-Glo (Promega). (D) ABT-199 treatment for 16 hours. (E) WEHI-539 treated for 6 hours. The results represent the mean of 2 independent experiments, and error bars indicate ± SD. Two-way analysis of variance with Dunnett’s post hoc test was used for statistical analysis. *P ≤ .05, **P ≤ .01, ***P ≤ .001, ****P < .0001. APC, allophycocyanin; SSC-A, side-scattered light area.
Mouse splenic microenvironment alters BCL-2 dependency in LOUCY cells. (A) Representative flow cytometry plots of gating the hCD45+ phycoerythrin (PE) cells. Percentage of cytochrome c release is normalized to dimethyl sulfoxide (DMSO) as negative control and alamethicin (ALM) as positive control. (B) BH3 profile on LOUCY cells isolated from the spleen of vehicle- and ABT-199–treated mice (n = 3 mice each group; mean ± standard deviation [SD]). (C) The mRNA expression of BCL-2, BCL-XL, and MCL-1 in LOUCY cells isolated from the spleen of each mouse was measured by using quantitative reverse transcription polymerase chain reaction. The mRNA gene expression was normalized to HMBS, TBP, and UBC. n = 3 mice each group; mean ± SD. (D-E) Ex vivo sensitivity of hCD45+ sorted from the spleen of vehicle-treated and ABT-199–treated mice (n = 4 each group) to BH3 mimetics, as assessed by using CellTiter-Glo (Promega). (D) ABT-199 treatment for 16 hours. (E) WEHI-539 treated for 6 hours. The results represent the mean of 2 independent experiments, and error bars indicate ± SD. Two-way analysis of variance with Dunnett’s post hoc test was used for statistical analysis. *P ≤ .05, **P ≤ .01, ***P ≤ .001, ****P < .0001. APC, allophycocyanin; SSC-A, side-scattered light area.
We next assessed the expression of antiapoptotic BCL-2 proteins at both the transcriptional and the protein level. BCL-2 was downregulated at both the messenger RNA (mRNA) level (Figure 2C) and the protein level (supplemental Figure 2A-C) in LOUCY cells isolated from the mouse spleen in both vehicle- and ABT-199–treated mice, compared with the in vitro cell line. Increased mRNA levels of BCL2L1 were found in LOUCY cells isolated from the mouse spleen of both the vehicle- and the ABT-199–treated mice, compared with the in vitro cell line. However, there was no concomitant increase in BCL-XL protein level measured by flow cytometry, in either the vehicle or the ABT-199 group (supplemental Figure 2B).
The hCD45+ LOUCY cells isolated from ABT-199–treated mice were more resistant to ABT-199 treatment after both 16 hours (Figure 2D) and 6 hours (supplemental Figure 2D) ex vivo, treatment indicating an in vivo selection of resistant cells. Interestingly, both vehicle- and ABT-199–treated hCD45+ cells were sensitive to WEHI-539, as was predicted by the BH3 profile (Figure 2E). LOUCY cells isolated from the vehicle mice were more sensitive to the myeloid cell leukemia-1 (MCL-1) inhibitor S63845 compared with ABT-199–treated mice (supplemental Figure 2E). These data suggest that the mouse splenic microenvironment alters the antiapoptotic dependence of LOUCY cells.
Evidence of residual disease in the spleen of an ETP-ALL patient-derived xenograft model after ABT-199 treatment
Cell line–based xenograft models do not recapitulate tumor heterogeneity to the extent of patient-derived xenograft (PDX) models. We therefore established PDX-1 from a primary sample that was sensitive to ABT-199 and described as ETP-ALL at relapse.10 After leukemia engraftment, mice were treated with vehicle or ABT-199 (25 mg/kg) daily, up to day 34 (Figure 3A). All remaining viable mice were then culled at day 36. PDX-1 was very sensitive to ABT-199 treatment, with essentially undetectable hCD45+ cells in the blood over the course of the study (Figure 3B). At end point analysis (vehicle, day 22; ABT-199, day 36), limited hCD45+ cells were detected in the blood (P = .0014) and bone marrow (P < .0001) of the ABT-199–treated animals. Interestingly, there was clear evidence of residual disease (hCD45+ = 15%) in the spleens (P < .0001) of the ABT-199–treated animals (Figure 3C).To further assess if the splenic niche could provide a protective environment, we assessed the mitochondrial priming of cells isolated from the bone marrow and spleen, using BH3 profiling. The BH3 profile of the leukemic blasts (hCD45+) revealed that the spleen reduced the response to the BIM peptide compared with the bone marrow microenvironment, indicating a reduction in apoptotic sensitivity induced by the splenic microenvironment (Figure 3D).

Evidence of residual disease in the splenic niche of ETP-ALL PDX. (A) As shown, 2 × 10⁶ cells of PDX-1 were injected in the tail vein of male NSG mice until the engraftment of human CD45+ cells. The animals were then randomized into vehicle and ABT-199 treatment (25 mg/kg by oral gavage daily) groups. (B) Percentage of hCD45+ blasts in the peripheral blood upon treatment. (C) Percentage of hCD45+ blasts in the blood, bone marrow, and spleen of vehicle- and ABT-199–treated mice at the end of 21 and 36 days. (D) BH3 profile of hCD45+ cells isolated from bone marrow and spleen of PDX-1 mouse models. (E-G) BH3 profile of hCD45 blasts isolated from the blood, bone marrow, and spleen of T-ALL PDX-2, PDX-3, and PDX-4 mouse models. Mean ± SEM; n = 3. Two-way analysis of variance with Bonferroni multiple comparison test was used to calculate statistical significance. *P < .05, **P < .01, ****P < .0001.
Evidence of residual disease in the splenic niche of ETP-ALL PDX. (A) As shown, 2 × 10⁶ cells of PDX-1 were injected in the tail vein of male NSG mice until the engraftment of human CD45+ cells. The animals were then randomized into vehicle and ABT-199 treatment (25 mg/kg by oral gavage daily) groups. (B) Percentage of hCD45+ blasts in the peripheral blood upon treatment. (C) Percentage of hCD45+ blasts in the blood, bone marrow, and spleen of vehicle- and ABT-199–treated mice at the end of 21 and 36 days. (D) BH3 profile of hCD45+ cells isolated from bone marrow and spleen of PDX-1 mouse models. (E-G) BH3 profile of hCD45 blasts isolated from the blood, bone marrow, and spleen of T-ALL PDX-2, PDX-3, and PDX-4 mouse models. Mean ± SEM; n = 3. Two-way analysis of variance with Bonferroni multiple comparison test was used to calculate statistical significance. *P < .05, **P < .01, ****P < .0001.
In our effort to assess the role of the spleen microenvironment as a protective niche in PDX T-ALL models, we isolated CD45+ cells from blood, bone marrow, and spleen of 3 distinct PDX models (PDX-2, PDX-3, and PDX-4) and analyzed the BH3 profile. PDX-2 samples express CD34+ (hematopoietic stem cell marker), which is suggestive of a more immature phenotype closer to the early progenitor (ETP) (supplemental Table 4). Interestingly, BH3 profiling on PDX-2 leukemic cells revealed that the splenic environment reduced mitochondrial priming compared with the bone marrow (Figure 3E); BH3 profiling of the 2 typical T-ALL, PDX-3 and PDX-4, showed no change in the apoptotic priming in the splenic niche (Figure 3F-G). The mitochondrial functional analysis of T-ALL PDX samples further confirmed the potential role of the spleen as a protective niche for the immature T-ALL subtype. Altogether, these data indicate that the spleen acts as a site of residual disease in vivo after ABT-199 treatment in the ETP-ALL PDX animal models and that the splenic microenvironment reduces apoptotic priming of immature T-ALL.
Human splenic fibroblasts alter BCL-2 dependence
We next aimed to measure if the human splenic microenvironment can alter BCL-2 dependence. Due to issues in attaining primary patient spleen samples, we purchased HSF to establish an ex vivo coculture model to represent the human spleen in our studies (Figure 4A). LOUCY cells were cocultured with HSF for 48 hours, and this significantly reduced the percentage of cytochrome c released after addition of the BAD BH3 peptide and ABT-199 treatment, as measured by BH3 profiling (Figure 4A-B).
![Human splenic fibroblasts reduce BCL-2 dependence in ETP-ALL in vitro. (A) Schematic representation of coculture system using HSF and LOUCY cells. (B) BH3 profile of LOUCY cells cocultured with HSF for 48 hours (mean ± standard deviation [SD]; n = 3). (C) Percentage of surviving cells after 24 hours of ABT-199 treatment following a 48-hour coculture with HSF and the subsequent 50% inhibitory concentration (IC50) values listed (mean ± SD; n = 3); 2-way analysis of variance with post hoc Dunnett’s comparison. (D) Western blot analysis of antiapoptotic BCL-2 proteins (BCL-2, BCL-XL, and MCL-1) and BIM protein expression in LOUCY and CC_HSF for 24 and 48 hours. β-actin was used as loading control (n = 3). (E) The mRNA expression of BCL-2, BCL2L, MCL-1, and BCL2L11 in CTRL and CC_HSF 24 h and 48 hours was measured by using quantitative reverse transcription polymerase chain reaction. The mRNA gene expression was normalized to GAPDH. Mean of n = 3, error bars show ± SD. (F) Transwell migration assay of LOUCY toward the condition media generated from HSF and HS-5 (bone marrow stroma cell line). Representative microscope pictures in bright field and Calcein-AM of LOUCY after 48 hours of migration toward the CM and the migration ratio (mean ± SD; n = 3). One-way analysis of variance statistical test was performed to determine the P values. The bar scale shows 100 μm. Relative ratio of migrating cells to migrating control cells was determined. Plotted as the mean ± SD of 3 independent experiments. (G) Percentage of surviving ETP-5 cells after 6 hours of ABT-199 and ABT-263 treatment and the subsequent IC50 values listed. (H) BH3 profile of ETP-5 cells cocultured with HSF for 16 hours. *P ≤ .05, **P ≤ .01, ***P ≤ .001. ns, not significant.](https://ash.silverchair-cdn.com/ash/content_public/journal/bloodadvances/5/7/10.1182_bloodadvances.2021004177/2/m_advancesadv2021004177f4.png?Expires=1767989454&Signature=BUD69rYPeqpXgWQQLmVqyghw1hL-~CbWFGE13FwQiZV97dRDJtlQ~zPPL8HCtdlnyztlQnruZ2nIeA1OsUr1HKjloWa2BOtphSETz0AnkGxt4yhbAomX3VbsTFRKRkIxEHTqaYHoHnsJkVxpAJyW7qB0ZxxF4fckuMKQN7LKT0QAXyjZtj65X76DTF7OKgkm5ByoKsVbdcCu~SeiN-R17iYpuicquRLb6pZFjSf-llsXNze-wAq-DIzvzboVQtie41NpVWPGFqoEMiXteYUdVIzyg1~EYMnybxasoO7zYQbAZPG9bpnWL~xR1itSxzFBB1wlrspQ6f5qib3aPSMZ9g__&Key-Pair-Id=APKAIE5G5CRDK6RD3PGA)
Human splenic fibroblasts reduce BCL-2 dependence in ETP-ALL in vitro. (A) Schematic representation of coculture system using HSF and LOUCY cells. (B) BH3 profile of LOUCY cells cocultured with HSF for 48 hours (mean ± standard deviation [SD]; n = 3). (C) Percentage of surviving cells after 24 hours of ABT-199 treatment following a 48-hour coculture with HSF and the subsequent 50% inhibitory concentration (IC50) values listed (mean ± SD; n = 3); 2-way analysis of variance with post hoc Dunnett’s comparison. (D) Western blot analysis of antiapoptotic BCL-2 proteins (BCL-2, BCL-XL, and MCL-1) and BIM protein expression in LOUCY and CC_HSF for 24 and 48 hours. β-actin was used as loading control (n = 3). (E) The mRNA expression of BCL-2, BCL2L, MCL-1, and BCL2L11 in CTRL and CC_HSF 24 h and 48 hours was measured by using quantitative reverse transcription polymerase chain reaction. The mRNA gene expression was normalized to GAPDH. Mean of n = 3, error bars show ± SD. (F) Transwell migration assay of LOUCY toward the condition media generated from HSF and HS-5 (bone marrow stroma cell line). Representative microscope pictures in bright field and Calcein-AM of LOUCY after 48 hours of migration toward the CM and the migration ratio (mean ± SD; n = 3). One-way analysis of variance statistical test was performed to determine the P values. The bar scale shows 100 μm. Relative ratio of migrating cells to migrating control cells was determined. Plotted as the mean ± SD of 3 independent experiments. (G) Percentage of surviving ETP-5 cells after 6 hours of ABT-199 and ABT-263 treatment and the subsequent IC50 values listed. (H) BH3 profile of ETP-5 cells cocultured with HSF for 16 hours. *P ≤ .05, **P ≤ .01, ***P ≤ .001. ns, not significant.
Human splenic fibroblasts reduce BCL-2 dependence in ETP-ALL in vitro. (A) Schematic representation of coculture system using HSF and LOUCY cells. (B) BH3 profile of LOUCY cells cocultured with HSF for 48 hours (mean ± standard deviation [SD]; n = 3). (C) Percentage of surviving cells after 24 hours of ABT-199 treatment following a 48-hour coculture with HSF and the subsequent 50% inhibitory concentration (IC50) values listed (mean ± SD; n = 3); 2-way analysis of variance with post hoc Dunnett’s comparison. (D) Western blot analysis of antiapoptotic BCL-2 proteins (BCL-2, BCL-XL, and MCL-1) and BIM protein expression in LOUCY and CC_HSF for 24 and 48 hours. β-actin was used as loading control (n = 3). (E) The mRNA expression of BCL-2, BCL2L, MCL-1, and BCL2L11 in CTRL and CC_HSF 24 h and 48 hours was measured by using quantitative reverse transcription polymerase chain reaction. The mRNA gene expression was normalized to GAPDH. Mean of n = 3, error bars show ± SD. (F) Transwell migration assay of LOUCY toward the condition media generated from HSF and HS-5 (bone marrow stroma cell line). Representative microscope pictures in bright field and Calcein-AM of LOUCY after 48 hours of migration toward the CM and the migration ratio (mean ± SD; n = 3). One-way analysis of variance statistical test was performed to determine the P values. The bar scale shows 100 μm. Relative ratio of migrating cells to migrating control cells was determined. Plotted as the mean ± SD of 3 independent experiments. (G) Percentage of surviving ETP-5 cells after 6 hours of ABT-199 and ABT-263 treatment and the subsequent IC50 values listed. (H) BH3 profile of ETP-5 cells cocultured with HSF for 16 hours. *P ≤ .05, **P ≤ .01, ***P ≤ .001. ns, not significant.
These changes in antiapoptotic BCL-2 dependence measured by BH3 profiling correlated with the reduced sensitivity to ABT-199 (treated for 24 hours) in vitro after coculture of the LOUCY cells with HSF for 48 hours (Figure 4C). However, we observed no significant changes in the sensitivity to WEHI-539 and AMG 176, or S63845 mimetic treatments (supplemental Figure 3A-C), indicating slight differences between the HSF coculture and the ex vivo response of splenic isolated LOUCY cells. BCL-2 was downregulated at both the protein and mRNA levels after 24 hours in coculture with HSF, congruent with the aforementioned results. BCL-XL was also upregulated at the protein and transcriptional levels, but no change in sensitivity to WEHI-539 was detected (Figure 4D-E). The BH3 profile and BCL-2 protein expression analysis suggested that the HSF coculture reduced BCL-2 dependence and sensitivity to ABT-199 but did not alter the sensitivity to other BH3 mimetics.
We next aimed to asses if LOUCY cells preferentially migrate to the splenic environment. To do this, we used a transwell migration assay with condition media from HSF and the human bone marrow fibroblast cells (HS-5) in the bottom chamber. The number of LOUCY cells that migrated to the conditioned media (CM)-HSF was a fold higher compared with the CM-HS-5 (P = .0006) (Figure 4F). Notably, typical T-ALL cells (CEM-CCRF) did not preferentially migrate to CM-HSF, as equal numbers of cells migrated through the Boyden chamber to both conditions (supplemental Figure 3D).
Furthermore, we wanted to corroborate if coculture of HSF with an ETP-ALL primary sample in vitro would alter the BH3 profile. ETP-ALL samples are difficult to propagate in mice, but ETP-5 had a high expression of BCL-2, as determined from the biobank of patient-derived pediatric tumor models.22 We confirmed that ETP-5 was BCL-2 dependent, as it was highly sensitive to both BH3 mimetics ABT-199 and ABT-263 after in vitro treatment of 6 hours (Figure 4G). Next, to assess if coculture with HSF altered the BCL-2 dependence, we cocultured ETP-5 cells with HSF for 16 hours and measured apoptotic dependence by BH3 profiling. Remarkably, the BAD BH3 peptide response was reduced by 20% in ETP-5 samples after coculture with HSF, indicating a reduction in BCL-2 dependence (Figure 4H). Combined, these data indicate that the HSF-conditioned media may provide a strong migratory signal and that HSF coculture can downregulate BCL-2 dependence in LOUCY and ETP primary samples.
Single-cell RNA-sequencing of LOUCY cells in the bone and splenic microenvironment after ABT-199 treatment
To dissect the mechanism of enhanced residual disease in the spleen of ABT-199–treated mice, single-cell RNA-sequencing (scRNA-seq; 10x Genomics) was used. We measured the heterogeneity of the transcriptional landscape occurring in both the spleen and the bone marrow microenvironments after ABT-199 treatment. We created an additional LOUCY xenograft experiment and treated a mouse with vehicle or ABT-199 (50 mg/kg) for 11 days. There was also an increase in hCD45+ cells in peripheral blood, indicating potential relapse of disease while on treatment (vehicle, 28.9%; ABT-199, 14.9%) (supplemental Figure 4A), and splenomegaly was observed in both vehicle-treated and ABT-199–treated mice (supplemental Figure 4B). Single cells were isolated from the bone marrow and spleen of mice from either the vehicle or ABT-199 (50 mg/kg) group, and scRNA-seq was performed (Figure 5A). After the completion of quality control (supplemental Figure 4C), a total of 13 681 cells remained from the spleen and 11 442 from the bone of the vehicle mouse. A total of 15 955 cells from the spleen and 9443 cells from the bone of ABT-199–treated mice were processed for further analysis.
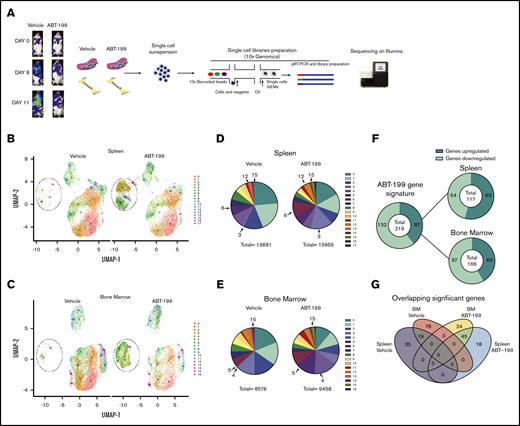
scRNA-seq analysis of ETP-ALL isolated from the spleen and the bone marrow (BM) after ABT-199 treatment. (A) Overview of the experimental workflow. The bioluminescence was recorded after injection of luciferin on days 0, 8, and 11 in vehicle-treated and ABT-199–treated mice. Each column with pictures represents one individual mouse. At day 11, BM and spleen of vehicle- and ABT-199–treated mice were dissociated to obtain a single-cell suspension, barcoded using 10x Genomics and sequenced on an Illumina sequencer. (B) Clustering of LOUCY cells isolated from vehicle- and ABT-199–treated mice spleen with dimensional reduction by UMAP. (C) Clustering of LOUCY cells isolated from vehicle- and ABT-199–treated mice BM with dimensional reduction by UMAP. Pie charts representing number of LOUCY cells in each cluster (in percentage) for vehicle- and ABT-199–treated spleen (D) and BM (E). (F) DE genes regulated in LOUCY cells after ABT-199 treatment (219 genes; 132 genes downregulated and 87 genes upregulated) and, respectively, in the spleen (54 genes downregulated; 63 genes upregulated) and BM (97 genes downregulated and 69 upregulated) niche. (G) Venn diagram illustrating the intersections among genes differentially upregulated in LOUCY cells isolated from the spleen and BM niche in vehicle- and ABT-199–treated mice.
scRNA-seq analysis of ETP-ALL isolated from the spleen and the bone marrow (BM) after ABT-199 treatment. (A) Overview of the experimental workflow. The bioluminescence was recorded after injection of luciferin on days 0, 8, and 11 in vehicle-treated and ABT-199–treated mice. Each column with pictures represents one individual mouse. At day 11, BM and spleen of vehicle- and ABT-199–treated mice were dissociated to obtain a single-cell suspension, barcoded using 10x Genomics and sequenced on an Illumina sequencer. (B) Clustering of LOUCY cells isolated from vehicle- and ABT-199–treated mice spleen with dimensional reduction by UMAP. (C) Clustering of LOUCY cells isolated from vehicle- and ABT-199–treated mice BM with dimensional reduction by UMAP. Pie charts representing number of LOUCY cells in each cluster (in percentage) for vehicle- and ABT-199–treated spleen (D) and BM (E). (F) DE genes regulated in LOUCY cells after ABT-199 treatment (219 genes; 132 genes downregulated and 87 genes upregulated) and, respectively, in the spleen (54 genes downregulated; 63 genes upregulated) and BM (97 genes downregulated and 69 upregulated) niche. (G) Venn diagram illustrating the intersections among genes differentially upregulated in LOUCY cells isolated from the spleen and BM niche in vehicle- and ABT-199–treated mice.
To visualize the transcriptional landscape, a 2-dimensional Uniform Manifold Approximation and Projection (UMAP) was generated (Figure 5B-C). Cell clustering of LOUCY cells based on the transcriptomic profile using UMAP projections identified 17 subpopulations in the spleen and 16 subpopulations in the bone marrow (Figure 5B-E). LOUCY cells segregated into 3 main “clusters of similarity” in vehicle and ABT-199 samples. The top 5 genes defining each cluster are represented in a heatmap (supplemental Figure 4D-E). Interestingly, clusters 3, 6, 12, and 15 were more represented in the LOUCY cells from the spleen of ABT-199–treated mice compared with vehicle-treated mice, whereas cluster 4, 5, and 15 were more represented in cells isolated from the bone marrow after ABT-199 treatment; this finding indicates that major transcriptional remodeling had occurred after treatment with ABT-199. After removal of low-expressing genes and normalization, 219 genes were found to be significantly differentially expressed (DE) genes (adjusted P < .05; log fold change > 2), of which 87 genes were upregulated and 132 genes downregulated in LOUCY cells isolated from the bone marrow and the spleen after treatment with ABT-199 (Figure 5F). More specifically, 117 genes were DE in cells isolated from the spleen (supplemental Figure 4F), whereas 166 genes were DE in LOUCY cells isolated from the bone marrow after treatment (supplemental Figure 4G). Of the significantly altered genes, 18 were uniquely upregulated in the spleen, whereas 35 genes were uniquely downregulated in the spleen (Figure 5G). Combined, these data show that ABT-199 induces transcriptional remodeling of LOUCY cells, with evidence of a unique transcriptome in both the spleen and bone marrow microenvironment.
T-cell differentiation markers are altered in the spleen of ABT-199–treated mice
Using bioinformatics tools, we assessed the pathways that were altered by ABT-199 in a niche-specific manner in both the spleen and the bone marrow. The significant differentially regulated unique genes in both the spleen (Figure 6A) and the bone marrow (Figure 6B) are represented by a volcano plot. A total of 64 genes are commonly downregulated and upregulated in both the spleen and bone marrow, as evident in the volcano plot (supplemental Figure 5A). To determine the pathways altered in the enhanced clusters of both the spleen (clusters 3, 6, 12, and 15) and the bone marrow (clusters 4, 5, and 15) after ABT-199 treatment, gene ontology analysis was used. We observed that T-cell differentiation was the most altered biological process in the spleen (Figure 6C), whereas negative regulation of cell proliferation was the most altered in the bone marrow (Figure 6D).

T-cell differentiation markers are enhanced in the spleen after ABT-199 treatment. Volcano plot representations of the DE genes for LOUCY cells collected from the spleen (A) and bone marrow (B) after vehicle and ABT-199 treatment. Red and blue points mark the genes with significantly increased or decreased expression, respectively. The x-axis shows log fold changes in expression and the y-axis the log odds of a DE gene. The P values were determined by using the Wilcox rank sum test with adjusted P values calculated using Bonferroni correction in Seurat. (C) Enriched Gene Ontology (GO) terms of DE genes in the spleen (clusters 3, 6, 12, and 15) after ABT-199 treatment. The 10 most significantly (P < .05) enriched GO terms in molecular functions and biological processes are presented. All the adjusted statistically significant values of the terms were negative 10-base log transformed. The P values were determined by using Enrichr with default parameters. (D) GO functional analysis of DE genes in the bone marrow (clusters 4, 5, and 15) after ABT-199 treatment. (E) cMYB gene scatterplot in LOUCY cells from the spleen of vehicle- and ABT-199–treated mice. (F) GATA3 gene scatterplot in LOUCY cells from the spleen of vehicle- and ABT-199–treated mice. (G-H) cMYB and GATA3 expression from a T-ALL patient cohort of 264 primary samples using RNA-Seq data set.28 One-way analysis of variance with Tukey’s multiple comparison post hoc test for statistical significance values. **P < .01, ****P < .001.
T-cell differentiation markers are enhanced in the spleen after ABT-199 treatment. Volcano plot representations of the DE genes for LOUCY cells collected from the spleen (A) and bone marrow (B) after vehicle and ABT-199 treatment. Red and blue points mark the genes with significantly increased or decreased expression, respectively. The x-axis shows log fold changes in expression and the y-axis the log odds of a DE gene. The P values were determined by using the Wilcox rank sum test with adjusted P values calculated using Bonferroni correction in Seurat. (C) Enriched Gene Ontology (GO) terms of DE genes in the spleen (clusters 3, 6, 12, and 15) after ABT-199 treatment. The 10 most significantly (P < .05) enriched GO terms in molecular functions and biological processes are presented. All the adjusted statistically significant values of the terms were negative 10-base log transformed. The P values were determined by using Enrichr with default parameters. (D) GO functional analysis of DE genes in the bone marrow (clusters 4, 5, and 15) after ABT-199 treatment. (E) cMYB gene scatterplot in LOUCY cells from the spleen of vehicle- and ABT-199–treated mice. (F) GATA3 gene scatterplot in LOUCY cells from the spleen of vehicle- and ABT-199–treated mice. (G-H) cMYB and GATA3 expression from a T-ALL patient cohort of 264 primary samples using RNA-Seq data set.28 One-way analysis of variance with Tukey’s multiple comparison post hoc test for statistical significance values. **P < .01, ****P < .001.
Upon gene ontology molecular function and biological process analysis of the unique DE genes to the different microenvironments, core promoter binding was highly altered in the spleen (supplemental Figure 5B) and NADH dehydrogenase activity in the bone marrow (supplemental Figure 5C). KEGG analysis revealed a significant enrichment for genes involved in cellular senescence pathway in the spleen (supplemental Figure 5D), whereas fluid shear stress and P53 signaling were found in the bone marrow (supplemental Figure 5E). Cellular senescence along with P53 signaling have been previously observed in therapeutic resistance to ABT-199.23
In both the spleen and the bone marrow, there is a substantial downregulation of ribosomal genes involved in translation. Mutations in 4 different ribosomal proteins (RPL5, RPL10, RPL22, and RPL11) have been described in T-ALL, with the highest incidence of genetic lesions occurring at residue R98 of ribosomal protein L10 (RPL10).24,25 These data suggest that a downregulation of translation may occur in response to ABT-199 treatment, which would align with an induction of a stress response.
One striking finding in the bone marrow is the altered NADH dehydrogenase activity and respiratory electron transport chain (supplemental Figure 5C). The cluster of mitochondrial encoded genes involved in oxidative phosphorylation that comprise components of complex I (MT-ND1; MT-NT2, MT-ND4), complex III (MT-CO3 and MT-CYB), and complex IV (MT-ATP6) are upregulated after ABT-199 treatment only in the bone marrow. These data would align with findings in a report on CLL, which showed that altered oxidative phosphorylation is involved in resistance to ABT-199 treatment.26
T-ALL transcription factors were highly altered after ABT-199 treatment, particularly in the spleen. Both LCK and TCF7 were downregulated after ABT-199 treatment, whereas c-MYB (Figure 6E) and GATA3 (Figure 6F) were in the list of 18 genes uniquely upregulated in the spleen, as evidenced by the UMAP plots. Both c-MYB and GATA3 transcription factors play essential roles in T-cell differentiation. 27 Although LOUCY cells are classified as immature or ETP-ALL, the switching on of GATA3 and c-MYB may lead to differentiation. Using published RNA-sequencing data sets, we also found that both c-MYB28,29 (Figure 6G; supplemental Figure 5F) and GATA3 (Figure 6H) are highly expressed in the HOXA cluster of patients with T-ALL (264 pediatric and young adults; 60 adults) a potentially more differentiated cluster than immature or LYL1. Of note, the TAL transcription factors LCK and TCF7, which are downregulated in the spleen, are important transcription factors in TAL-classified T-cell leukemia, which is a more mature cluster than HOXA. Combined, these data would suggest that the spleen microenvironment is a potential site of T-cell differentiation, whereas the bone marrow microenvironment upregulates mitochondrial oxidative phosphorylation genes after ABT-199 treatment.
Generation of ABT-199–resistant LOUCY cell line ex vivo validates reduced BCL-2 expression and induced differentiation
Because scRNA-seq is difficult to validate in bulk tissue, an ex vivo ABT-199–resistant model was used to generate a more homogeneous population of resistant cells to confirm our findings. We generated LOUCY cells resistant to ABT-199 (ABT-199R) by treatment with gradually increasing concentrations of up to 2 μM of ABT-199 over several months (Figure 7A). The BH3 profile showed that ABT-199R were highly responsive to HRK peptide (selective for BCL-XL) compared with the CTRL cells, whereas ABT-199 (used as a peptide) triggered a weaker cytochrome c release (Figure 7B). In agreement, ABT-199R cells were more sensitive to WEHI-539 (BCL-XL inhibitor) compared with the parental controls (Figure 7C). Interestingly, there was no change in sensitivity to AMG-176 (MCL-1 inhibitor) (supplemental Figure 6C). ABT-199R LOUCY cells had reduced BCL-2 expression and increased BCL-XL levels at both the protein and mRNA level, whereas there were no significant changes in MCL-1 expression (Figure 7D-E; supplemental Figure 6A-B). In vitro selection of ABT-199–resistant LOUCY showed evidence of switching in antiapoptotic dependence from BCL-2 to BCL-XL. Previously, we showed that mature typical T-ALLs are BCL-XL dependent, whereas ETP-ALL more often displays BCL-2 dependency.9
![Generation of ABT-199–resistant LOUCY cell line phenocopies BCL-2 independence and altered differentiation. (A) Scheme to generate LOUCY cells resistant to ABT-199. Parental LOUCY cells were exposed to either vehicle (DMSO) or ABT-199. Initially, LOUCY cells were treated at low dose of ABT-199 to reach a population of resistant clones that were capable of maintaining viability with continuous exposure to ABT-199 up to 2 μM. (B) BH3 profile of parental cells (CTRL) and the ABT-199–resistant clones (ABT-199R) (mean ± standard deviation [SD]; n = 3). Two-way analysis of variance with Dunnett’s multiple comparison for statistical analysis was performed. (C) Percentage of surviving cells after ABT-199 and WEHI-539 treatment, in parental and resistant cell lines, graphed is the dose–response curves, and subsequent 50% inhibitory concentration (IC50) values are listed (mean ± SD; n = 3). Two-way analysis of variance with Dunnett’s multiple comparison post hoc test. (D-E) Expression analysis of BCL-2 and BCL-XL proteins by western blot, the correspondent densitometry analysis (top panel) and quantitative real-time polymerase chain reaction analysis (bottom panel). β-actin used as loading control to normalize protein expression. The mRNA gene expression was normalized to GAPDH. (F) Representative flow cytometry plot of the mean florescence intensity (MFI) for surface CD3 expression (sCD3-APC) of parental CTRL and ABT-199R cells. sCD3 expression of parental CTRL and ABT-199R cells; data graphed are presented in MFI (n = 3; mean ± SD). (G) Representative flow cytometry plot of the MFI for CD1a-APC expression of parental CTRL and ABT-199R cells. CD1a expression of parental CTRL and ABT-199R cells; data graphed are presented in MFI (n = 3; mean ± SD). (H) GATA3 (n = 3; mean ± SD), TAL1 (n = 1 mean ± SD of triplicate), and LMO2 (n = 3; mean ± SD) mRNA levels in parental CTRL and ABT-199R cells measured by quantitative reverse transcription polymerase chain reaction. The mRNA gene expression was normalized to RP18S. Paired Student t test statistical analysis was conducted to determine the P values. *P ≤ .05, **P ≤ .01, ***P ≤ .001.](https://ash.silverchair-cdn.com/ash/content_public/journal/bloodadvances/5/7/10.1182_bloodadvances.2021004177/2/m_advancesadv2021004177f7.png?Expires=1767989454&Signature=QZZMkHDqvC4scCpjp19gHb-2F5LSkUEBKZ4p66m13~uOeVZKYYJC3~H7995rGWNj71h28w0Dbv2d1Iu8UicGjB5S-Wjr9FGzL10~jy9rYPP7hLEueUOffDiVh36iM6ifs9ohdxkRgqLrEfUJs1pYH32Pz44j8zAq~tCWspoAdpiXp347wmB7iZFombfL9NRIOZzd1xOGXUyepxsnf2vQUUNJ5IF321NOnajRiabw1tGA01d4nby1zhuy2RB1XYSs6BsCDn6qWqWm90wKXAptrCsKE4eZyEHYVSq5Oel~QfdhrUXEI5nyoi9t7r~zCnMCO8LxJIvqWriHFgHOlugwpg__&Key-Pair-Id=APKAIE5G5CRDK6RD3PGA)
Generation of ABT-199–resistant LOUCY cell line phenocopies BCL-2 independence and altered differentiation. (A) Scheme to generate LOUCY cells resistant to ABT-199. Parental LOUCY cells were exposed to either vehicle (DMSO) or ABT-199. Initially, LOUCY cells were treated at low dose of ABT-199 to reach a population of resistant clones that were capable of maintaining viability with continuous exposure to ABT-199 up to 2 μM. (B) BH3 profile of parental cells (CTRL) and the ABT-199–resistant clones (ABT-199R) (mean ± standard deviation [SD]; n = 3). Two-way analysis of variance with Dunnett’s multiple comparison for statistical analysis was performed. (C) Percentage of surviving cells after ABT-199 and WEHI-539 treatment, in parental and resistant cell lines, graphed is the dose–response curves, and subsequent 50% inhibitory concentration (IC50) values are listed (mean ± SD; n = 3). Two-way analysis of variance with Dunnett’s multiple comparison post hoc test. (D-E) Expression analysis of BCL-2 and BCL-XL proteins by western blot, the correspondent densitometry analysis (top panel) and quantitative real-time polymerase chain reaction analysis (bottom panel). β-actin used as loading control to normalize protein expression. The mRNA gene expression was normalized to GAPDH. (F) Representative flow cytometry plot of the mean florescence intensity (MFI) for surface CD3 expression (sCD3-APC) of parental CTRL and ABT-199R cells. sCD3 expression of parental CTRL and ABT-199R cells; data graphed are presented in MFI (n = 3; mean ± SD). (G) Representative flow cytometry plot of the MFI for CD1a-APC expression of parental CTRL and ABT-199R cells. CD1a expression of parental CTRL and ABT-199R cells; data graphed are presented in MFI (n = 3; mean ± SD). (H) GATA3 (n = 3; mean ± SD), TAL1 (n = 1 mean ± SD of triplicate), and LMO2 (n = 3; mean ± SD) mRNA levels in parental CTRL and ABT-199R cells measured by quantitative reverse transcription polymerase chain reaction. The mRNA gene expression was normalized to RP18S. Paired Student t test statistical analysis was conducted to determine the P values. *P ≤ .05, **P ≤ .01, ***P ≤ .001.
Generation of ABT-199–resistant LOUCY cell line phenocopies BCL-2 independence and altered differentiation. (A) Scheme to generate LOUCY cells resistant to ABT-199. Parental LOUCY cells were exposed to either vehicle (DMSO) or ABT-199. Initially, LOUCY cells were treated at low dose of ABT-199 to reach a population of resistant clones that were capable of maintaining viability with continuous exposure to ABT-199 up to 2 μM. (B) BH3 profile of parental cells (CTRL) and the ABT-199–resistant clones (ABT-199R) (mean ± standard deviation [SD]; n = 3). Two-way analysis of variance with Dunnett’s multiple comparison for statistical analysis was performed. (C) Percentage of surviving cells after ABT-199 and WEHI-539 treatment, in parental and resistant cell lines, graphed is the dose–response curves, and subsequent 50% inhibitory concentration (IC50) values are listed (mean ± SD; n = 3). Two-way analysis of variance with Dunnett’s multiple comparison post hoc test. (D-E) Expression analysis of BCL-2 and BCL-XL proteins by western blot, the correspondent densitometry analysis (top panel) and quantitative real-time polymerase chain reaction analysis (bottom panel). β-actin used as loading control to normalize protein expression. The mRNA gene expression was normalized to GAPDH. (F) Representative flow cytometry plot of the mean florescence intensity (MFI) for surface CD3 expression (sCD3-APC) of parental CTRL and ABT-199R cells. sCD3 expression of parental CTRL and ABT-199R cells; data graphed are presented in MFI (n = 3; mean ± SD). (G) Representative flow cytometry plot of the MFI for CD1a-APC expression of parental CTRL and ABT-199R cells. CD1a expression of parental CTRL and ABT-199R cells; data graphed are presented in MFI (n = 3; mean ± SD). (H) GATA3 (n = 3; mean ± SD), TAL1 (n = 1 mean ± SD of triplicate), and LMO2 (n = 3; mean ± SD) mRNA levels in parental CTRL and ABT-199R cells measured by quantitative reverse transcription polymerase chain reaction. The mRNA gene expression was normalized to RP18S. Paired Student t test statistical analysis was conducted to determine the P values. *P ≤ .05, **P ≤ .01, ***P ≤ .001.
Based on the scRNA-seq data showing changes in T-cell differentiation genes after ABT-199 treatment, we hypothesized that resistance to ABT-199 may occur due to a selection of a more differentiated blast cell. We therefore measured if during the chronic exposure to ABT-199, a more differentiated cell was selected in vitro by measuring the cortical marker CD1a, along with surface CD3 expression.30 Remarkably, there was a major increase in expression of both T-cell differentiation markers sCD3 (P = .029) and CD1a (P = .0074) in the ABT-199R cells compared with the parental LOUCY cell line, as measured by using flow cytometry (Figure 7F-G). To confirm that the altered differentiation state may be specific to ABT-199 resistance, we assessed the expression of CD1a and sCD3 on cells that were made resistant to asparaginase (ASN_R)31 (supplemental Figure 6E). Interestingly, we detected no change in CD1a or sCD3 expression in LOUCY cells resistant to asparaginase compared with the parental cell line (supplemental Figure 6F-G). These data show that during the chronic ABT-199 treatment of the immature LOUCY cell line, a more differentiated blast cell is selected that is resistant to ABT-199 and that this mechanism of resistance is likely specific to ABT-199.
To confirm this phenotypic change in differentiation, we also measured T-cell differentiation genes, including GATA3 identified to be induced in the scRNA-seq data. We confirmed an increase in GATA3, TAL1, and LMO2 genes in the ABT-199R cells compared with the parental cell line (Figure 7H; supplemental Figure 6D).
In summary, these data on ABT-199 R cells support the scRNA-seq analysis showing that ABT-199 therapeutic pressure may lead to the selection of a more differentiated cell in the LOUCY cell line, and that differentiation plasticity serves as a mechanism of resistance toward ABT-199.
Discussion
The tumor microenvironment is a complex system, and previous reports have shown that niche environments such as the lymph node32 or bone marrow33 can provide sites of resistance to BH3 mimetics. In our study using a luciferase-tagged LOUCY cell line, we identified in mice that the spleen acts as a site of residual disease after ABT-199 treatment. We confirmed our finding that the spleen microenvironment alters the dependence on BCL-2 in both LOUCY and ETP PDX, both in vitro and in vivo. Gene expression analysis of T-ALL previously identified that BCL-2 mRNA is highly expressed in immature T-ALL but this is reduced in other, more mature subtypes of T-ALL.34 Numerous mechanisms of resistance to ABT-199 have been recently described, with a predominant theme of cell-autonomous events causing the resistance. For instance, one report showed a selection pressure for clones with mutated BCL-2,18 another used CRISPR-Cas9 screening and identified that mitochondrial structure19 along with TP5320 played important roles in driving resistance, although ABT-199 has shown some promising early signs of efficacy in the clinic for ETP-ALL.17 Our study would suggest that differentiation plasticity from ETP-ALL into a more mature T-ALL is a resistant mechanism for ABT-199.
The spleen is a common extramedullary site of human leukemia, but it has largely been ignored as a tumor microenvironment site. This indifference to the spleen as a microenvironment could be due to difficulties in attaining patient biopsy samples, or due to human leukemias having a preferential splenic localization in mice. Numerous earlier clinical studies showed that splenomegaly was associated with poor clinical outcome in ALL.35,36 Splenomegaly is also found across numerous types of leukemia, including CLL,37 acute myeloid leukemia, marginal zone non-Hodgkin leukemia,38 and hairy cell leukemia.39 Moreover, there is even evidence of splenectomies extending the survival in mouse models7,40 and in extending the life of patients with hairy cell leukemia.41 Although the reason for the poor response of patients with splenomegaly is not known and could be multifactorial, our study would suggest that the splenic microenvironment can alter apoptotic sensitivity selectively in immature T-ALL, as we detected no changes to mitochondrial priming in mature T-ALL PDXs isolated from the spleen. However, it would be interesting to determine the effect of the splenic microenvironment on apoptotic sensitivity in different types of leukemia.
Currently, our knowledge of the splenic properties involved in the response to treatment is limited. We therefore turned to scRNA-seq of cells isolated from the spleen and bone marrow to understand the dynamic transcriptional profile occurring in both sites after ABT-199 treatment. The striking result was the major transcriptional remodeling that occurred in LOUCY cells in both sites after ABT-199 treatment. The major pathway that was altered in both the spleen and the bone marrow after ABT-199 treatment was downregulation of ribosomal proteins indicating activation of a stress response leading to a general reduction in translation.
The transcriptome profile of residual LOUCY cells in the bone marrow niche suggests that changes in cellular metabolism, with enhanced oxidative phosphorylation levels, could be the driving force behind evolved ABT-199 resistance. Recently, it was described that enhanced oxidative phosphorylation levels along with overexpression of MCL-1 confer resistance to ABT-199 in CLL.42
Although the transcriptome profile of residual LOUCY cells from the splenic niche suggests that changes in T-cell differentiation may be an important mechanism of resistance in this site of disease, the transcription factors c-MYB and GATA3 were uniquely upregulated in the spleen. The increase in these transcription factors would correlate with an induction of differentiation, as both of these genes were more highly expressed in the HOXA T-ALL cluster rather than the immature cluster in 2 publicly available data sets.28,29 Indeed, both genes are essential in T-cell differentiation.27,43 It is also important to remember that the spleen is an extramedullary site for hematopoiesis, and it therefore has the capacity to enable differentiation of immature cells.44
Validating our findings, a recent report showed the response of a patient with T-ALL who was positive for CD1a to ABT-199.45 Upon relapse, which was evident in the spleen, liver, and lung, there was evidence of sCD3+ blast cells that no longer expressed CD34 or CD1a, suggesting the selection of a more differentiated cell in vivo in the patient. Indeed, our in vitro selection of ABT-199–resistant LOUCY cells showed increased expression of CD1a and sCD3, along with increased GATA3 and TAL1 expression, suggesting selection of a more mature differentiated cell. This seems specific for ABT-199 resistance as we did not detect altered differentiation in asparaginase-resistant LOUCY cells. Indeed, similar findings related to ABT-199 were also made in acute myeloid leukemia, with a selection for a more differentiated monocytic cell after ABT-199 treatment in vivo. However, whether the monocytic differentiation occurred in a niche environment was not described in this article.46 Indeed, there is evidence that propagation of ETP-ALL from the spleen of mice may alter the immunophenotype of the cells. Maude et al47 showed that 4 of 6 ETP-ALL had altered their immunophenotype after engraftment in mice. We believe that this is very strong support that during the engraftment of ETP-ALL, there may be a selection for more immunophenotypically mature cells in vivo, as 2 of the PDXs had increased expression of CD5; whether this is driven by niche microenvironments has not yet been addressed, however.
Collectively, our study reveals an important and previously undescribed function for the spleen as a potential site of disease relapse after ABT-199 treatment and shows a role for T-cell differentiation plasticity in therapy resistance.
The data discussed in this publication have been deposited in the National Center for Biotechnology Information Gene Expression Omnibus database and are accessible through https://www.ncbi.nlm.nih.gov/geo/query/acc.cgi?acc=GSE168594 (accession number GSE168594).
Acknowledgments
T.N.C. is supported by the RCSI StAR award and Leukemia Research Foundation. P.V.V. is supported by the Fund for Scientific Research Flanders, the Ghent University Special Research Fund, and Stand up to Cancer (the Flemish cancer society). A.D.G. is supported by the Irish Research Council (GOIPD/2020/561). J.H.M.P. is supported by a grant from Science Foundation Ireland (17/JPND/3455). R.B.L. is supported by a Fellowship from the National Health and Medical Research Council of Australia (NHMRC Fellowship APP1157871).
Authorship
Contribution: T.N.C. and P.V.V. designed the study and cowrote the paper; A.D.G. performed experiments, analyzed data, and cowrote the manuscript; S.P., M.V.T., J.M., and S.G. performed experiments and analyzed data; B.L. and L.R. helped with the mouse experiments; N.V. performed the scRNA-seq; P.D.D. performed scRNA-seq analysis; H.A.N. and A.L. generated the asparaginase-resistant LOUCY cells; R.B.L. generated the ETP-5_PDX; J.H.M.P. designed experiments; and all authors read and edited the manuscript.
Conflict-of-interest disclosure: T.N.C. receives research funding from AbbVie but not in relation to this project. The remaining authors declare no competing financial interests.
Correspondence: Triona Ní Chonghaile, Department of Physiology and Medical Physics, Royal College of Surgeons in Ireland, 123 St. Stephen's Green, Dublin 02, Ireland; e-mail: tnichonghaile@rcsi.com; and Pieter Van Vlierberghe, Department of Biomolecular Medicine, Medical Research Building 2 (MRB2), Building 38, Room 100.006, Ghent University, Corneel Heymanslaan 10, 9000 Ghent, Belgium; email: pieter.vanvlierberghe@ugent.be.

