

Key Points
CNAs can be detected in cfDNA in 93% of cHL patients and are correlated with disease burden and evolution.
Besides known recurrent gains and losses, loss of 3p13-p26 and 12q21-q24 and gain of 15q21-q26 are identified as novel recurrent CNAs in cHL.

Abstract
The low abundance of Hodgkin/Reed-Sternberg (HRS) cells in lymph node biopsies in classical Hodgkin lymphoma (cHL) complicates the analysis of somatic genetic alterations in HRS cells. As circulating cell-free DNA (cfDNA) contains circulating tumor DNA (ctDNA) from HRS cells, we prospectively collected cfDNA from 177 patients with newly diagnosed, mostly early-stage cHL in a monocentric study at Leuven, Belgium (n = 59) and the multicentric BREACH study by Lymphoma Study Association (n = 118). To catalog the patterns and frequencies of genomic copy number aberrations (CNAs), cfDNA was sequenced at low coverage (0.26×), and data were analyzed with ichorCNA to yield read depth-based copy number profiles and estimated clonal fractions in cfDNA. At diagnosis, the cfDNA concentration, estimated clonal fraction, and ctDNA concentration were significantly higher in cHL cases than controls. More than 90% of patients exhibited CNAs in cfDNA. The most frequent gains encompassed 2p16 (69%), 5p14 (50%), 12q13 (50%), 9p24 (50%), 5q (44%), 17q (43%), 2q (41%). Losses mostly affected 13q (57%), 6q25-q27 (55%), 4q35 (50%), 11q23 (44%), 8p21 (43%). In addition, we identified loss of 3p13-p26 and of 12q21-q24 and gain of 15q21-q26 as novel recurrent CNAs in cHL. At diagnosis, ctDNA concentration was associated with advanced disease, male sex, extensive nodal disease, elevated erythrocyte sedimentation rate, metabolic tumor volume, and HRS cell burden. CNAs and ctDNA rapidly diminished upon treatment initiation, and persistence of CNAs was associated with increased probability of relapse. This study endorses the development of ctDNA as gateway to the HRS genome and substrate for early disease response evaluation.
Introduction
Classical Hodgkin lymphoma (cHL) is the most common lymphoid neoplasm in adolescents and young adults and accounts for 15% to 25% of lymphomas overall. Thanks to the development of combined modality radiochemotherapy regimens over the past decades, cHL has become highly curable today, but with a risk of severe late effects.1 In order to obtain optimal disease control while minimizing long-term toxicities, therapeutic choices in cHL are currently based on disease stage and risk factors at diagnosis and tailored further based on early disease response.2
Unlike many other hematological malignancies, much of the therapeutic progress in cHL took place without thorough biological knowledge of the Hodgkin/Reed-Sternberg (HRS) cell, the malignant cell in cHL. A salient feature of HRS cells is their low abundance, only at 0.1% to 2%, in cHL biopsies, amid an overwhelming majority of nonmalignant immune cells.3 Consequently, the genetics of HRS cells have been studied in HRS cell-derived cell lines, in tumor biopsies by in situ hybridization, and only more recently on HRS cells isolated by laser microdissection or cell sorting (supplemental Table 1).4-25 Therefore, current genetic insights in cHL derive from relatively few studies, often featuring limited numbers of cases and/or a limited scope of genomic alterations.
A promising new approach to the HRS genome takes advantage of cell-free DNA (cfDNA). In cancer patients, a proportion of cfDNA is derived from tumor cells (circulating tumor DNA [ctDNA]), and, hence, potentially informative on the tumor genome.26-29 Moreover, ctDNA, being derived from all regions of the primary tumor and its metastases, may deliver a more representative genetic fingerprint of the primary tumor and its metastases, whereas biopsy material is representative of the sampled area only. The analysis of cfDNA may therefore find promising applications, for example, in early tumor detection, assessment of tumor genetics, monitoring of response, detection of minimal residual disease, molecular evolution, and emergence of resistance.30 As many hematological malignancies are “liquid” malignancies of bone marrow and/or peripheral blood, cells from bone marrow/peripheral blood have been the traditional analyte for hematologists. However, our group recently delivered proof of principle that genomic imbalances in HRS cells can be profiled by massive parallel sequencing of cfDNA.31 More recent studies using ultrasensitive next-generation sequencing and digital polymerase chain reaction approaches confirmed that gene mutations in HRS cells can be detected in cfDNA of cHL patients.32-34 These findings point to cfDNA profiling as a potential novel and noninvasive tool at diagnosis and in early interim disease monitoring. Based on these results, we have conducted a study in 177 patients to capture and catalog CNAs in newly diagnosed cHL and their evolution under therapy.
Materials and methods
Patients
We prospectively collected cfDNA from 177 patients diagnosed with de novo cHL, either recruited locally at the University Hospitals Leuven (n = 59) or in cooperation with the Lymphoma Study Association (n = 118). Staging followed the Ann Arbor classification, with risk stratification within stage I/II disease as per European Organization for Research and Treatment of Cancer guidelines2 (early favorable: no risk factors; early unfavorable: 1 or more risk factors, with risk factors: age ≥50 years; erythrocyte sedimentation rate [ESR] levels >50 mm/h without and >30 mm/h with B symptoms; mediastinum-to-thorax ratios ≥0.35; involvement of ≥4 nodal regions). Prognostic stratification for stage III/IV disease was done using the Hasenclever International Prognostic Score35 (serum albumin <40 g/L; hemoglobin <10.5 g/dL; male sex; Ann Arbor stage IV; age ≥45 years; white cell count ≥15 × 109/L; lymphocyte count <0.6 × 10⁹/L). All participants provided written consent.
University Hospitals Leuven patients
Consecutive patients with a new diagnosis of cHL were recruited between July 2014 and January 2018, in a prospective study S56534/ML10468 (B32220141013) approved by the local institutional review board. Positron emission tomography/computed tomography (18F-FDG-PET/CT) scans were obtained at baseline, after 2 or 4 cycles, and at end of treatment. Patients >16 years were treated with ABVD (adriamycine (doxorubicin); bleomycin; vinblastine; dacarbazin). Eight pediatric patients were treated with pediatric regimens.
Controls were randomly selected from normal samples obtained for noninvasive prenatal testing (n = 23) and samples from a healthy elderly individuals study (n = 72).36 We also obtained plasma samples from 27 patients with diffuse large B-cell lymphoma (DLBCL).
Lymphoma Study Association patients
Samples were collected prospectively as a substudy of the multicentric, randomized phase 2 BREACH trial (ClinicalTrials.gov; NCT02292979), evaluating brentuximab vedotin + doxorubicin, vinblastine, dacarbazine (AVD) (BV-AVD) vs ABVD in patients with cHL. PET/CT scans were available at diagnosis, after 2 cycles, and at end of treatment.
cfDNA biobank
Blood was collected in Cell‐Free DNA BCT tubes (Streck, Omaha, NE) before start of therapy (C1D1), at day 15 of cycle 1 (C1D15), and at day 1 of cycle 3 (C3D1) of ABVD or BV-AVD; or at C1D1, C2D1, and C3D1 for the other treatment modalities. Blood samples were centrifuged for 20 minutes at 2000g, yielding 2 to 5 mL plasma. cfDNA was extracted using the QIAmp Circulating Nucleic Acid kit (Qiagen, Hilden, Germany). cfDNA concentration was quantified using the Qubit double-stranded DNA HS assay kit (Invitrogen, Carlsbad, CA).
Ultralow pass sequencing for CNA detection in plasma
Sequencing libraries were prepared using the TruSeq ChIP Library Preparation Kit (Illumina, San Diego, CA) from 2.5 to 5 ng cfDNA and sequenced on the HiSeq 2500 sequencer (High Throughput mode, 50 bp SE31 ). Copy number (CN) analysis for autosomal chromosomes was done using ichorCNA, an algorithm optimized for ultralow pass sequencing.37
If CNAs are identified, ichorCNA generates an estimated clonal fraction in total cfDNA, as a measure for the ctDNA fraction. Starting from an initial set of hypothetical clonal fractions, ichorCNA models the corresponding CN profile and probability. As these initial clonal fractions are only estimates, an iterative algorithm is applied to refine each model and determine the CN profile and corresponding clonal fraction that yields the best fit with the sample data. Compiling these calculations, ichorCNA proposes the optimal clonal fraction estimate with the highest overall likelihood. Importantly, the proposed clonal fraction is independent of the initial scenarios. The latter only relieves computational burden by guiding ichorCNA to the expected range of the final solution. As recommended by the authors in the case of low anticipated tumor content,37 we defined an initial set of low hypothetical clonal fractions (0.05, 0.10, 0.15, 0.25). The absolute ctDNA concentration was obtained by multiplying the estimated clonal fraction by the cfDNA concentration.
Following the guidelines in the ichorCNA validation study, cfDNA profiles were called abnormal based on the following criteria: (a) estimated clonal fraction >10% or (b) estimated clonal fraction between 3% and 10% with at least 1 loss and 1 gain >100 Mb. For the remaining cases, that is, (c) those with estimated clonal fractions between 3% and 10% without 1 loss and gain >100 Mb or (d) those with estimated clonal fractions <3%, manual curation by 2 independent observers was required to confirm these estimates.37 For follow-up profiles with estimated clonal fractions, an abnormal profile was called in case of persistence of initial aberration(s) or after verification of new aberrations by duplicate analysis.
GISTIC
Regions of recurring genomic gains and losses were identified using Genomic Identification of Significant Targets in Cancer (GISTIC 2.0).38 GISTIC focuses on focal aberrations and reports broad events separately. For each recurrent CNA, GISTIC determines the minimally common region and its frequency. In order to correct for possible errors because of adjacent passenger CNAs, GISTIC also defines a probabilistically established wider region that is more robust to contain the actual target genes. The analysis was run with default log2 thresholds and a significance q value threshold set to 0.15 at 90% confidence. Relevant genes located within the latter wider GISTIC regions were filtered using CancerMine,39 and Gene Ontology (GO) datasets of biological processes pivotal in cHL.
FISH
Fluorescence in situ hybridization (FISH) was done on fixed cytogenetic specimens as described. Probes for ALK, D5S23/D5S721, PML/RARA, and NMYC were from Abbott Molecular (Wavre, Belgium); the probe for MYB was from Zytovision (Forlab, Brussels, Belgium), and the probe for CKS1B/CDKN2C was from Cytocell (Cambridge, UK). The probes for JAK2 and FOXP1 were homemade.31 FISH images were acquired with a fluorescence microscope with an Axiophot2 camera (Carl Zeiss Microscopy, Jena, Germany) and ISIS software (MetaSystems, Altlussheim, Germany).
Immunohistochemistry and density of HRS cells
Cases with available tumor biopsies were selected for immunohistochemical analysis. Formalin-fixed paraffin-embedded sections of 5 µm were stained immunohistochemically for CD30 (Ber-H2 clone, IR602; Agilent, Santa Clara, CA) on a Leica Bond-Max autostainer. Stained slides were scanned using the IntelliSite Ultra-Fast Scanner (Philips, Amsterdam, Netherlands), and images were analyzed using QuPath. The number of HRS cells per square millimeter was counted automatically based on CD30 staining intensity, cell size, and nucleocytoplasmic ratio.
MTVs
Metabolic tumor volumes (MTVs) were computed using MIM (version 6.7.3) and the 41% maximum standardized uptake value (SUVmax) method, as previously described.40
Statistical analysis
Statistical analysis was done in R. Univariate comparisons were done using Fisher's exact tests for categorical and Wilcoxon-Mann-Whitney tests for continuous data and corrected for multiple hypothesis testing using the Benjamini-Hochberg procedure. Multivariate linear regression analysis was done to examine the effect of clinical predictor variables on ctDNA concentrations. Correlations were calculated using Spearman rank correlation coefficient. All testing was done at a significance level of 0.05.
Results
Patient characteristics
We studied cfDNA from plasma of 177 patients with newly diagnosed cHL, 118 of whom were from the BREACH study, with inclusion criteria including age 18 to 60 years and stage II unfavorable disease. The remaining 59 cases were consecutively diagnosed at UZ Leuven. Clinical characteristics are summarized in Table 1. Briefly, the median age was 29 years (range, 3 to 86 years), and there was a majority of the nodular sclerosis subtype and early-stage unfavorable disease. Under first-line therapy, 15 patients relapsed within 5 to 50 months of follow-up.
Clinical characteristics of the patients
| Total, n (%) | BREACH, n (%) | UZ Leuven, n (%) | |
|---|---|---|---|
| Total | 177 (100) | 118 (100) | 59 (100) |
| Male | 79 (45) | 55 (47) | 24 (41) |
| Female | 98 (55) | 63 (53) | 35 (59) |
| Median age (range), y | 29 (3-86) | 28 (18-60) | 31 (3-86) |
| Histology | |||
| NS | 144 (81) | 108 (92) | 36 (61) |
| MC | 16 (9) | 5 (4) | 11 (19) |
| LD | 2 (1) | 1 (1) | 1 (2) |
| LR | 6 (4) | 0 | 6 (10) |
| Unclassifiable | 9 (5) | 4 (3) | 5 (8) |
| Disease stage | |||
| Early stage I to II early favorable | 14 (8) | 1 (1) | 13 (22) |
| Early unfavorable | 135 (76) | 116 (98) | 19 (32) |
| Early NA | 4 (2) | 0 | 4 (7) |
| Advanced stage III to IV | 24 (14) | 1 (1) | 23 (39) |
| EBV status* | |||
| Positive | 19 (11) | 6 (5) | 13 (22) |
| Negative | 113 (64) | 78 (66) | 35 (59) |
| NA | 45 (25) | 34 (29) | 11 (19) |
| Therapy | |||
| ABVD | 87 (49) | 39 (33) | 48 (81) |
| AVD + brentuximab | 79 (45) | 79 (67) | 0 |
| Other† | 11 (7) | 0 | 11 (19) |
| Interim PET‡ | |||
| Positive | 31 (17) | 22 (19) | 9 (15) |
| Negative | 122 (69) | 94 (80) | 28 (48) |
| NA | 24 (14) | 2 (1) | 22 (37) |
| Deceased | 2 (1) | 0 | 2 (3) |
| Relapse | 15 (8) | 6 (5) | 8 (13) |
LD, lymphocyte-depleted; LR, lymphocyte-rich; MC, mixed cellularity; NA, not available; NS, nodular sclerosis.
Based on LMP1 immunohistochemistry or EBER in situ hybridization.
Other: VEPEMB, OEPA (+COPDAC), DHAP, PLD-COP.
Negative, Deauville 1 to 3; positive, Deauville 4 to 5.
cfDNA in cHL at diagnosis
Hohaus et al reported elevated cfDNA levels in cHL and found correlations with inferior failure-free survival, advanced stage disease, B symptoms, and age >60 years.41 In our cohort, cfDNA concentrations at diagnosis ranged widely from 1.5 to 297 ng/mL plasma (median, 8.6 ng/mL; interquartile range [IQR], 4.7 to 15.9 ng/mL). Controls had significantly lower yet partially overlapping cfDNA levels (median, 5.5 ng/mL; IQR, 3.2 to 7.9 ng/mL; P < .001). cfDNA levels were increased in advanced stage III to IV disease as well as in early unfavorable disease compared with early favorable disease (P < .01) (supplemental Figure 1A). In line with Hohaus, we observed correlations between increased cfDNA and B symptoms (P < .01) in early-stage cHL, and therapy failure (P < .05) in the entire cohort (supplemental Figure 2).
Ultralow pass sequencing of cfDNA in cHL detects CNAs in HRS cells
All samples were sequenced at a mean depth of 0.26× (IQR, 0.22× to 0.32×). IchorCNA generated CN profiles and corresponding estimated clonal fractions of cfDNA, as a measure for the ctDNA fraction. Estimated clonal fractions in cHL samples ranged from 0% to 33% with a median of 5.9% (IQR, 3.8% to 9.8%), which is significantly higher than controls (ranging from 0% to 8%; median, 0; IQR, 0% to 0.5%; P < .001) (supplemental Figure 1B). Of note, a fraction of controls (24 of 95) had an estimated clonal fraction above zero, an observation also made by Adalsteinsson et al.37 In receiver operating characteristic analysis (ROC), estimated clonal fractions allowed a better distinction between healthy subjects and cHL patients than cfDNA (supplemental Figure 1C-D).
The estimated clonal fraction guides the interpretation of copy number profiles (see “Materials and methods”). Of 177 cases, 97 cases were called abnormal by ichorCNA: the proposed estimated clonal fraction was ≥10% in 45 cases, and between 3% and 10%, with 1 gain and 1 loss >100 Mb, in 52 cases. In 9 cases, ichorCNA detected no clonal fraction. From the remaining 57 cases with an estimated clonal fraction between 3% and 10%, and 14 cases with an estimated clonal fraction of <3%, respectively, 55 and 12 cases were withheld as abnormal after visual curation. Thus, 164 cases of 177 (93%) showed aberrant CN profiles.
Two representative profiles, one with a high and one with a low estimated clonal fraction, are given in Figure 1A. Most cases (152/164) had complex patterns with 5 or more CNAs. In 5 cases with low clonal fraction, we verified the presence of 10 CNAs in cfDNA by FISH on available cytogenetic specimens. The gains or losses observed in cfDNA were confirmed by FISH targeting the gained/lost region of interest in 9 out of 10 experiments (Figure 1B; supplemental Table 2). One CNA (loss of 6q, HL58) could not be confirmed (supplemental Table 2). We conclude that ichorCNA in combination with visual curation reliably calls CNAs in low-depth sequencing data at low estimated clonal fractions.
![Detection and FISH validation of CNAs in cfDNA. (A) Illustrative ichorCNA output for 2 cases with a high (left) vs low (right) estimated clonal fraction. Genome-wide log2 ratios are plotted and colored according to CN status (green = loss; blue = copy neutral; brown = gain; red = amplification). (B) Validation of CNAs in the case of HL19 by interphase FISH on fixed cytogenetic specimens. At the left, the log2 plot for the chromosome of interest is shown, with an arrow indicating the genomic location of the FISH probe used. Probes are shown with their respective colors (green [G]: spectrum green; red [R]: spectrum orange; blue [A]: spectrum aqua; red/green [DC]: dual color break apart probe) and the FISH patterns of the large HRS cells are indicated. (C-D) Validation of novel recurrent CNAs in cfDNA by interphase FISH: loss of 3p13-p26 (C) and gain of 15q21-q26 (D). CEP, centromeric probe; LSI, locus specific identifier.](https://ash.silverchair-cdn.com/ash/content_public/journal/bloodadvances/5/7/10.1182_bloodadvances.2020003039/1/m_advancesadv2020003039f1.png?Expires=1767874434&Signature=lggLUt7NRXvWtBpoEFI57y9kXD~EYbuhobDABmDgrh~WiDz47but6-U5ovVjVWL4rt9yO0oEpWeV57yqva6pqVL-1yh87Tqk8La1rTUZ6G16YW2i9wiiJg5aaR47USzHOPq6FT4PP2kzVVVzosMPEOGLzllxbxtMLjyru9vhp-lEW7PHWYgvCnP63bu4Yey~9zLh1I6SQ6g89UAPZHz3scC~iZXrDSfZbpiRVajOXsODDh8BFGOhZM2oX8rP~Ps7vFJZ9Zm-EiflzXVxhl5VdAXXVzGlDUsDtB9H0g5yYrhGh8~fIlxGbooQ2vArE8L2FkXCih9PIyuYmsMOTC9ZMA__&Key-Pair-Id=APKAIE5G5CRDK6RD3PGA)
Detection and FISH validation of CNAs in cfDNA. (A) Illustrative ichorCNA output for 2 cases with a high (left) vs low (right) estimated clonal fraction. Genome-wide log2 ratios are plotted and colored according to CN status (green = loss; blue = copy neutral; brown = gain; red = amplification). (B) Validation of CNAs in the case of HL19 by interphase FISH on fixed cytogenetic specimens. At the left, the log2 plot for the chromosome of interest is shown, with an arrow indicating the genomic location of the FISH probe used. Probes are shown with their respective colors (green [G]: spectrum green; red [R]: spectrum orange; blue [A]: spectrum aqua; red/green [DC]: dual color break apart probe) and the FISH patterns of the large HRS cells are indicated. (C-D) Validation of novel recurrent CNAs in cfDNA by interphase FISH: loss of 3p13-p26 (C) and gain of 15q21-q26 (D). CEP, centromeric probe; LSI, locus specific identifier.
Detection and FISH validation of CNAs in cfDNA. (A) Illustrative ichorCNA output for 2 cases with a high (left) vs low (right) estimated clonal fraction. Genome-wide log2 ratios are plotted and colored according to CN status (green = loss; blue = copy neutral; brown = gain; red = amplification). (B) Validation of CNAs in the case of HL19 by interphase FISH on fixed cytogenetic specimens. At the left, the log2 plot for the chromosome of interest is shown, with an arrow indicating the genomic location of the FISH probe used. Probes are shown with their respective colors (green [G]: spectrum green; red [R]: spectrum orange; blue [A]: spectrum aqua; red/green [DC]: dual color break apart probe) and the FISH patterns of the large HRS cells are indicated. (C-D) Validation of novel recurrent CNAs in cfDNA by interphase FISH: loss of 3p13-p26 (C) and gain of 15q21-q26 (D). CEP, centromeric probe; LSI, locus specific identifier.
The incidence of CNAs in cfDNA in cHL
CNAs were detectable in 92% [22/24]) of cases with stage III to IV disease, but also in 94% (140/149) of stage I to II disease. Within stage I to II disease, the probability of CNAs was significantly higher in early unfavorable cases (96% [130/135]) than in early favorable cases (71% [10/14]; P < .01). Therefore, the small proportion of normal profiles probably reflects cases with ctDNA fractions below the detection threshold, rather than without CNAs.
We also detected CNAs in cfDNA from 25 of 27 cases diagnosed with DLBCL. As shown in supplemental Figure 3A, we did not identify individual CNA specific for cHL, but the frequency and pattern of CNAs in cHL and DLBCL are distinct. Unsupervised hierarchical clustering of CNA profiles segregated cHL from DLBCL in the majority of cases, except in samples with low estimated clonal fractions (supplemental Figure 3B). This validates the CNA patterns in cHL as disease specific.
Recurrent CNAs in cfDNA
All abnormal diagnostic profiles were subjected to GISTIC analysis in order to identify recurrent CNAs in cHL. GISTIC focuses on defining driver targets and therefore analyzes focal and arm-level alterations separately. Regions most frequently affected by focal gains and losses are shown in Figure 2A and listed in supplemental Table 3. Arm-level gains and losses are shown in Figure 2B. Presumed or potential candidate driver genes within these regions are also listed. Interestingly, GISTIC identified 3 CNAs not previously reported in cHL: gain of 15q21.3-q26.3 and loss of 3p26.3-p13 and 12q21.31-q24.33 (supplemental Table 3; supplemental Figure 4). Gain of 15q21.3-q26.3 and loss of 3p26.3-p13 were validated by FISH in 2 out of 2 experiments each (Figure 1C-D; supplemental Table 4). Loss of 12q21.31-q24.33 could not be investigated by FISH for technical reasons. Of note, chromosome 19 was altered in the majority of cHL cases (144/177) but excluded from the analysis because of the high number of artifacts in normal controls. Thus, analysis of cfDNA in a large cohort of cHL reveals known and novel genomic gains and losses in cHL.

Recurrent CNAs in cHL. (A) Recurrent CNAs in abnormal cases (n = 164) were evaluated using GISTIC. The y-axis shows the G score as a function of chromosomal location (x-axis) for gains (red) and losses (blue). G scores exceeding the green line represent significantly recurrent aberrations. The latter are shown with their frequency within this cohort, their genomic location, and their size. CancerMine was browsed for tumor suppressor and oncogenes involved in “hematologic cancers,” “lymphoma,” “B-cell lymphoma,” “Hodgkin lymphoma,” “non-Hodgkin lymphoma,” and “diffuse large B-cell lymphoma.” GO gene lists were extracted for the JAK-STAT pathway (GO:0007259), NF-kB pathway (GO:0038061 and GO:0007249), Notch signaling (GO:0007219), TNFR signaling (GO:0033209), cytokine-mediated pathway (GO:0019221), negative and positive regulation of apoptotic signaling pathway (GO:2001234 and GO:2001235), and B-cell receptor signaling (GO:0050853). A selection of genes that are located within the wider boundaries as determined by GISTIC is shown. Genes within the minimally common region (see “Materials and methods”) are printed bold. (B) Broad CNAs are defined as comprising at least 90% of a chromosome arm. Frequencies (%) are plotted for significantly gained (red) or lost (blue) p or q arms.
Recurrent CNAs in cHL. (A) Recurrent CNAs in abnormal cases (n = 164) were evaluated using GISTIC. The y-axis shows the G score as a function of chromosomal location (x-axis) for gains (red) and losses (blue). G scores exceeding the green line represent significantly recurrent aberrations. The latter are shown with their frequency within this cohort, their genomic location, and their size. CancerMine was browsed for tumor suppressor and oncogenes involved in “hematologic cancers,” “lymphoma,” “B-cell lymphoma,” “Hodgkin lymphoma,” “non-Hodgkin lymphoma,” and “diffuse large B-cell lymphoma.” GO gene lists were extracted for the JAK-STAT pathway (GO:0007259), NF-kB pathway (GO:0038061 and GO:0007249), Notch signaling (GO:0007219), TNFR signaling (GO:0033209), cytokine-mediated pathway (GO:0019221), negative and positive regulation of apoptotic signaling pathway (GO:2001234 and GO:2001235), and B-cell receptor signaling (GO:0050853). A selection of genes that are located within the wider boundaries as determined by GISTIC is shown. Genes within the minimally common region (see “Materials and methods”) are printed bold. (B) Broad CNAs are defined as comprising at least 90% of a chromosome arm. Frequencies (%) are plotted for significantly gained (red) or lost (blue) p or q arms.
ctDNA at diagnosis
The absolute cfDNA concentration was derived from the cfDNA concentration and the estimated clonal fraction. Absolute ctDNA concentrations ranged from 0 to 47.4 ng/mL plasma (median, 0.5 ng/mL plasma; IQR, 0.3-1.1 ng/mL plasma) and were increased compared with controls (median, 0.0 ng/mL plasma; IQR, 0.0-0.0; P < .001). This metric yielded the best distinction from controls with a sensitivity and specificity of 89.3% and 87.2%, respectively (Figure 3A-B).
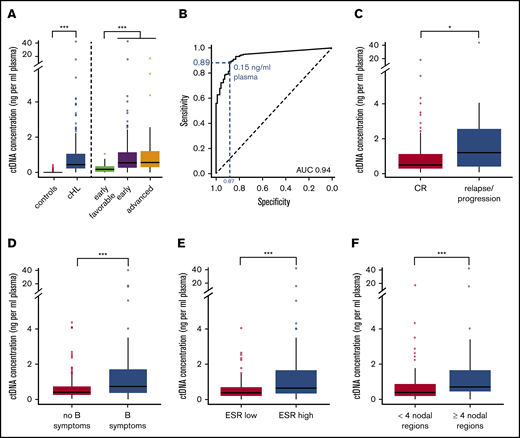
ctDNA concentrations at diagnosis. (A) Box and whisker plot of baseline ctDNA concentrations for controls vs cHL patients in general and grouped by disease stage category. (B) ROC analysis for ctDNA concentrations at diagnosis determines the optimal ctDNA cutoff (Youden index) between cHL cases from controls (blue). Corresponding sensitivity and specificity are shown in blue. (C-F) Box and whisker plots of baseline ctDNA concentrations in cHL patients with treatment response vs failure (C), and for early-stage disease: absence vs presence of B symptoms (D), normal vs elevated ESR levels (E), and limited vs extensive nodal involvement (F). Outliers are defined as values 1.5 × IQR below the first or above the third quartile. *P < .05; **P < .01; ***P < .001. AUC, area under the curve; CR, complete remission.
ctDNA concentrations at diagnosis. (A) Box and whisker plot of baseline ctDNA concentrations for controls vs cHL patients in general and grouped by disease stage category. (B) ROC analysis for ctDNA concentrations at diagnosis determines the optimal ctDNA cutoff (Youden index) between cHL cases from controls (blue). Corresponding sensitivity and specificity are shown in blue. (C-F) Box and whisker plots of baseline ctDNA concentrations in cHL patients with treatment response vs failure (C), and for early-stage disease: absence vs presence of B symptoms (D), normal vs elevated ESR levels (E), and limited vs extensive nodal involvement (F). Outliers are defined as values 1.5 × IQR below the first or above the third quartile. *P < .05; **P < .01; ***P < .001. AUC, area under the curve; CR, complete remission.
Higher ctDNA concentrations were observed in advanced stage III to IV disease (median, 0.59 ng/mL) and in early unfavorable (median, 0.54 ng/mL) compared with early favorable disease (median, 0.18 ng/mL; P < .001). Higher ctDNA concentrations were also associated with male sex (0.66 ng/mL vs 0.39 ng/mL) (P < .01, not shown) and a higher risk of therapy failure (P < .05) (Figure 3C). In early-stage cHL, higher ctDNA concentrations were associated with involvement of 4 or more nodal regions (median, 0.72 ng/mL vs 0.4 ng/mL), elevated ESR levels (0.72 ng/mL vs 0.38 ng/mL), and the presence of B symptoms (0.81 ng/mL vs 0.39 ng/mL; all P < .001) (Figure 3D-F). Of note, elevated cfDNA levels but not estimated clonal fractions were associated with increased ESR, sex, and treatment failure (supplemental Figure 2). Univariate analysis identified age, elevated ESR, extensive nodal involvement, male sex but not bulky disease as predictive of increased ctDNA concentrations (P < .05). Multivariate analysis, including parameters significant under univariate conditions, identified extensive nodal involvement, elevated ESR, and male sex as independent risk factors associated with elevated ctDNA concentrations in early-stage cHL. In advanced-stage cHL (n = 23), we observed no significant associations between ctDNA concentrations and prognostic factors defining the Hasenclever index, but the sample size was small (Table 2).
Univariate and multivariate analysis of predictive variables for ctDNA concentration in early-stage and all cases
| Univariate | Multivariate | ||||
|---|---|---|---|---|---|
| n | Regression coefficient | P | Regression coefficient | P | |
| Early stage | 153 | ||||
| Age (≥50 y) | 19 | −16.5 | .008* | −1.3 | .92 |
| ESR (≥30 or ≥50 w/o B symptoms) | 73 | 22 | .05* | 20.4 | .006* |
| MT (≥0.35) | 66 | 13.2 | .09 | ||
| Extranodal disease (present) | 1 | −12 | .79 | ||
| Nodal regions (≥4) | 49 | 25.3 | .001* | 23.8 | .002* |
| Sex (male) | 64 | 19.7 | .007* | 21.8 | .003* |
| Advanced stage† | 23 | ||||
| Hemoglobin (<10.5 g/dL) | 5 | 1.4 | .70 | ||
| Sex (male) | 15 | 2.1 | .51 | ||
| Stage (IV) | 14 | −1.3 | .68 | ||
| Age (≥45 y) | 5 | 2.5 | .49 | ||
| White blood cell count (≥15 × 109/L) | 5 | 0.4 | .91 | ||
| Lymphocyte count (≤ 0.6 × 10⁹/L) | 23 | NA | NA | ||
NA, not available; w/o, without.
Significant.
No data were available on serum albumin levels.
ctDNA correlates with MTVs and with HRS cell burden
We hypothesized that, at diagnosis, the plasma concentration of ctDNA correlates with MTVs, as measured by PET/CT. This hypothesis was addressed in a subset of the Leuven cohort. The MTVs were computed from PET/CT using MIM. Data in 21 cases revealed a strong correlation between MTVs and ctDNA concentration (ρ 0.73, P < .01) (data not shown).
In cHL biopsies, the bulk of MTVs is contributed mainly by the inflammatory tissue component rather than by the minor fraction of HRS cells. In order to examine the correlation between ctDNA and the HRS cell burden at diagnosis, we assessed the density of HRS cells by CD30 immunostaining of 12 formalin-fixed paraffin-embedded biopsies. Based on this 2-dimensional density, we corrected the MTVs for HRS content and found a stronger correlation between the HRS density-corrected MTVs and ctDNA concentration (ρ 0.85, P < .01) (supplemental Figure 5A). These preliminary findings support that ctDNA concentrations reflect the MTV and HRS cell burden.
ctDNA rapidly declines after initiation of therapy
For patients with CNAs at diagnosis (n = 164), we investigated the evolution of ctDNA after therapy initiation. C1D15 and C3D1 samples were available for 136 and 132 patients, respectively. After treatment initiation, absolute ctDNA concentrations declined strongly and rapidly. The median ctDNA concentration dropped to 0 ng/mL plasma at C1D15 (IQR, 0-0.41 ng/mL plasma) and C3D1 (IQR, 0-0.04 ng/mL plasma) (Figure 4). This evolution was primarily attributed to decreasing clonal fractions. Unexpectedly, in the BV-AVD arm of the BREACH study, median cfDNA levels rose from 9.13 ng/mL on C1D1 to 17.00 ng/mL on C1D15 and decreased again to 10.46 ng/mL at C3D1, whereas an increase in C1D15 was not observed in the control arm (C1D1: 12.36 ng/mL; C1D15: 8.01 ng/mL; C3D1: 9.00 ng/mL) (supplemental Figure 5B). However, ctDNA concentrations decreased strongly and comparably in the experimental and control arm of the study.
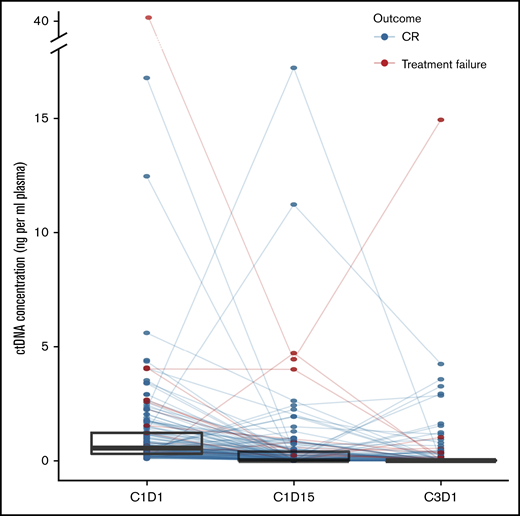
ctDNA dynamics after treatment initiation. Line plot showing the individual evolution of ctDNA concentration under treatment. Superimposed are box and whisker plots of ctDNA concentrations at each time point to highlight the general tendency.
ctDNA dynamics after treatment initiation. Line plot showing the individual evolution of ctDNA concentration under treatment. Superimposed are box and whisker plots of ctDNA concentrations at each time point to highlight the general tendency.
At C1D15, 83 profiles were classified normal, 31 of which were after visual curation. CNAs were called in 47 profiles, 40 of which were after visual curation. Six cases could not be classified. At C3D1, 96 profiles were classified normal, 39 of which were after visual curation. CNAs were called in 26 profiles, 20 of which were after visual curation. Ten cases were unclassifiable. Thus, a large majority of profiles reverted to normal at C1D15 and C3D1.
ctDNA and prognosis in cHL
Finally, we investigated the prognostic value of monitoring cfDNA profiles under therapy. At diagnosis, we observed an association between an elevated ctDNA concentration and eventual treatment failure. Of 164 follow-up cases, 15 cases suffered treatment failure. At C1D15 (data not shown) and C3D1, the presence of persisting or novel CNAs was associated with an increased risk of treatment failure. A cfDNA result at C3D1 was available for 122 cases: 26 had an abnormal cfDNA profile, 6 of whom experienced therapy failure, in comparison with 5 failures out of 96 cases with a normal cfDNA profile (Table 3; P = .012 by Fisher's exact test). Persistence of CNAs in plasma at C3D1 correctly predicted relapse/progressive disease in 6 of 26 (23%) cases; clearance of CNAs in plasma at C3D1 correctly predicted a durable response in 91 of 96 (95%) cases (Table 3). However, at this time, there was no significant correlation between CNAs in plasma at C3D1 and positive interim PET/CT. Therefore, we wondered whether ctDNA profiling could complement the prognostic value of interim PET/CT monitoring.
Risk of disease progression/relapse according to PET/CT and cfDNA results after 2 cycles of chemotherapy in patients with CNAs at diagnosis (N = 164)
| cfDNA result* | |||||||
|---|---|---|---|---|---|---|---|
| Positive | Negative | Not available | Total, n | ||||
| n† | Therapy failure‡ | n† | Therapy failure‡ | n† | Therapy failure‡ | ||
| PET/CT | |||||||
| Positive | 8 | 3 (38) | 14 | 3 (21) | 7 | 2 (29) | 29 |
| Negative | 16 | 2 (13) | 70 | 1 (1) | 27 | 2 (7) | 113 |
| Not available | 2 | 1 (50) | 12 | 1 (8) | 8 | 0 (0) | 22 |
| Total | 26 | 6 (22) | 96 | 5 (5) | 42 | 4 (9) | 164 |
Positive cfDNA, profiles with persistent aberrations or with new aberrations confirmed by duplicate analysis; not available, cases with no plasma sample at C3D1 or with equivocal cfDNA profiles.
The number of cases according to PET and/or cfDNA status after 2 cycles.
The number (proportion) of cases with therapy failure is shown according to PET and/or cfDNA status after 2 cycles. Therapy failure is defined as lack of complete remission at end of therapy or relapse after end of therapy.
Interim PET/CT results at C3D1 were available in 142 cases, 13 of which were with treatment failure. Positive PET/CT at C3D1 correctly predicted relapse/progressive disease in 8 of 29 (28%); negative PET/CT at C3D1 correctly predicted a durable response in 108 of 113 (96%) cases.
Positive results in both cfDNA profiles and PET/CT correctly predicted relapse/progressive disease in 3 of 8 (38%) cases; negative results in both cfDNA and PET/CT correctly predicted a durable response in 69 of 70 (99%) cases. This suggests that outcome prediction by interim PET/CT can be modestly refined by ultralow pass sequencing analysis of cfDNA.
Discussion
The unconventional architecture of cHL, with only a minority of HRS cells embedded in an inflammatory background, is an important technical obstacle for the in-depth elucidation of the genetics underlying cHL. The presence of tumor-derived DNA in plasma creates the opportunity to remotely sample the HRS genome in a convenient, minimally invasive, and relatively inexpensive way.31,32 The aim of this project was to catalog genomic imbalances in HRS cells based on ultralow pass sequencing of cfDNA in a large series of newly diagnosed cHL patients. Furthermore, the application of the recently developed ichorCNA algorithm allowed estimation of the clonal fraction of cfDNA, presumably derived from HRS cells. We also explored the correlation of ctDNA with prognostic risk factors, tumor burden, and the evolution of CNAs after treatment initiation. To the best of our knowledge, this study of 177 patients is the largest study addressing genome-wide CNAs in cHL to date.
Using the cost-effective approach of ultralow pass sequencing, abnormal CN profiles were detected in >90% of cHL cases at diagnosis. Reassuringly, FISH experiments on cytogenetic specimens in 5 cases with low estimated clonal fractions and in 4 cases with novel recurrent genomic alterations validated 13 out of 14 CNAs of interest in HRS cells. These findings further establish cfDNA analysis as a valid gateway to the genome of HRS cells, as previously suggested by us and other groups in smaller series.32,33,42-44 Less than 10% of cases had normal CN profiles at diagnosis, most likely because of tumor fractions below the detection threshold of our assay. Samples with low clonal fractions may require methodologies with a lower detection threshold to overcome technical limitations of the ultralow pass sequencing assay used here. We also found low estimated clonal fractions in a minority of normal controls (<4%), but this should not raise concerns about the specificity of CNAs in cHL cfDNA. This finding may be inherent of the ichorCNA algorithm, as it was also observed by Adalsteinsson et al.37 It can also be due to clonal hematopoiesis of indeterminate potential, a manifestation of the aging hematopoietic system.36,45-47 Indeed, clonal fractions were, with 1 exception, exclusively detected in elderly controls (data not shown). Unfortunately, this hypothesis cannot be verified here in the absence of leukocyte DNA from these samples.
The analysis of cfDNA from this large series of newly diagnosed cHL allows building a comprehensive catalog of the types of CNAs, as well as their frequencies and patterns in cHL. Genomic regions gained in >50% of patients were 2p16-p15, 5p15.33-p13.3, 12q13.13-q14.1, and 9p24.3-p24.1. Gained regions harbor several genes the increased activity of which has been implicated in Hodgkin lymphoma, by amplification (eg, REL (2p16), BCL11A (2p16), NFKB1 (4q24), JAK2 (9p24)),39 upregulated expression (eg, CSF1R (5q34), IL-10 (1q32), CASP6 (4q25)),48,49 or by gain-of-function mutations (eg, XPO1 (2p15), STAT6 (12q13)).32,42,44 For these, CN gains could be an alternative way of enhancing protein activity. Genomic regions lost in >50% of patients were 6q22-q27, 13q, and 4q34.1-q35.2. Encompassed within these recurrently lost regions are several genes with reported loss of function in cHL, for example, by CN loss (eg, TNFAIP3 (6q23), TNFRSF14 (1p36), FOXO1 (13q14)),39 inactivating mutations (eg, NFKBIE (6p21), NFRKB (11q24)), or downregulation (eg, B2M (15q21), RASSF1 (3p21), PTEN (10q23)).48,50,51 Several studies have also identified recurrent gains of 19p13 and 19q13 in cHL.6,7,52 However, chromosome 19 was blacklisted from our analysis given the high number of false positives in normal controls, as also reported by others.37
Most CNAs identified in this cohort were already described in smaller studies on purified HRS cells or on tumor sections, not always consistently and with varying frequencies. Here, this largest study of CNAs in cHL to date provides a consolidated landscape of the major CNAs with a reliable estimation of their relative incidence. Of note, gain of 2p16, 5p14, and 12q13 and loss of 6q25 and 13q occur at least as frequently as gains of 9p24, encompassing CD274 and PDCDLG2, encoding PD-L1 and PD-L2, respectively.14 Amplification of the latter region is an important predictor for favorable outcome after anti–PD-1 directed immune checkpoint blockade, for example, nivolumab.53,54 Moreover, 3 novel recurrent CNAs were revealed: loss of 3p13-p26 and 12q21-q24 and gain of 15q21-q26. Possible candidate oncogenes located on 15q include genes promoting cell proliferation through NF-kB, JAK-STAT, and cytokine receptor signaling (AKAP13, FES, STRA6, and PIAS1) and with antiapoptotic activity (MAP2K1 and MAP2K5). Potential tumor suppressor genes located on 3p and 12q include negative regulators of cell proliferation (RHOA, VHL and TLR9 (3p), SOCS2 (12q)) and negative regulators of apoptosis (TRAIP (3p), APAF1 (12q)). This could warrant further studies on whether and how these novel CNAs are implicated in the pathogenesis of cHL. On the other hand, our analysis did not withhold several previously reported CNAs. For instance, we found loss of 12q21-24, whereas 3 previous studies reported focal gains at the 12qter. These discrepancies could arise from differences in the patient cohorts, as well as in the methodological approach. For instance, subclonal tumor heterogeneity can be better captured by single-cell approaches, such as FISH or microdissection of HRS cells, than by ultralow pass sequencing of cfDNA. We could not identify a specific genomic signature associated with histological subtype, EBV status, or treatment failure, because of the low incidence of such cases in the study cohort.
Total cfDNA levels, estimated clonal fractions, and absolute ctDNA concentrations were all significantly increased in cHL, but absolute ctDNA concentrations allowed the best separation of cHL from controls. This is probably due to confounding preanalytical or in vivo circumstances affecting total cfDNA levels, for example, sample storage, infections, stress, etc.55 This is further exemplified by the unexpectedly high cfDNA levels at C1D15 in the BV-AVD arm of the BREACH study, in comparison with C1D1 and C3D1 and with the same time points in the standard ABVD arm. Both BV and bleomycin are administered on day 1 and day 15 of each cycle, but BV has a half-life of 4 to 6 days, considerably longer than bleomycin (2 to 9 hours). In the BV-AVD arm with prolonged bioavailability of BV, more protracted off-target killing of normal cells might explain the increased cfDNA levels at C1D15. In addition, as HRS cells orchestrate the infiltration and activation of multiple cell types into the lymphoma microenvironment by secretion of cytokines and chemokines,3,56 the death of HRS cells disrupts this interaction in Hodgkin lymphoma lymph nodes and may lead to the release of cfDNA from nontumoral cells. This hypothesis could be further investigated with kinetic studies of cfDNA and ctDNA on early time points in the first cycle of chemotherapy. Nonetheless, it is illustrative of the superiority of ctDNA as a metric over cfDNA, because of a lesser susceptibility of the former to confounding circumstances.
Among cHL patients, ctDNA concentrations were higher in advanced stage disease, as previously reported,32 and associated with a higher probability of treatment failure. Higher ctDNA concentrations were also associated with early unfavorable compared with early favorable disease and, within early-stage disease, with male sex, extensive nodal involvement, and elevated ESR. Although no association with bulky disease could be demonstrated, a preliminary subset analysis confirmed a correlation of the MTV and estimated HRS cell burden with ctDNA concentration. The correlation with tumor volume and HRS cell burden is further underscored by the rapid clearance of ctDNA and normalization of CN profiles from plasma upon treatment initiation.
Interestingly, the combination of interim PET/CT imaging and ctDNA analysis may refine outcome prediction in cHL, with a higher risk of relapse for patients with both positive interim PET/CT and abnormal CN profiles at C3D1. A similar observation was made at C1D15 (not shown). Ultralow pass sequencing analysis is a relatively inexpensive technique with a high detection threshold. As such, it is optimized for diagnostic samples rather than for follow-up samples with lower tumor loads.32,34,57 Even so, our data suggest that monitoring of the kinetics of early disease response by ultralow pass sequencing can contribute to outcome prediction. Obviously, technologies with a low detection threshold for single-nucleotide variants, for example, CAPP-Seq or digital droplet polymerase chain reaction, are expected to improve the performance of such monitoring.32,34,44,57
In summary, this study further establishes the validity of cfDNA as a substrate for genomic analysis of HRS cells, and the feasibility of this approach in a multicentric context. Our ultralow pass sequencing data yield an extensive catalog of CNAs and their frequency in newly diagnosed cHL. Finally, ctDNA fractions may also be a promising new biomarker not only of disease burden and prognosis but also for dynamic monitoring. Whether ctDNA analysis can contribute to the clinical management of cHL, in combination with standard approaches, for example, PET/CT imaging, should be investigated in clinical trials.
Due to informed consent restrictions, data sharing in a public database is not possible. Data will be made available in accordance with our institutional policy (https://www.uzleuven.be/nl/ethische-commissie-onderzoek). Requests for data sharing can be sent to the data access committee dac@uzleuven.be.
Acknowledgments
The authors are grateful to L. Lenaerts and N. Brison for providing control samples and N. Brison, in particular, for practical help, and Laura Rengifo for assistance with FISH; and to Alexandra Traverse-Glehen for providing the EBV status of cases.
This study was supported by grants of the Research Foundation Flanders (FWO) G0A1116N (I.W. and P.V.) and the Foundation Against Cancer (STK) FAF-C/2016/836 (P.V.).
Authorship
Contribution: L.B., I.W., and P.V. conceived the project and designed the experiments; L.B., L.D., and J.V. generated the next-generation sequencing data; L.B., J.F.-F., and P.V. analyzed the data; L.-M.F., J.L., R.-O.C., A.-C.G., C.B., K.B., B.F., and D.D. provided patient samples; M.A. provided patient samples and patient data; T.T. and C.C.-B. performed pathological revision; L.M. performed CD30 immunostaining and density assessments of HRS cells; O.G. performed PET/CT analysis for Leuven samples; L.B. and P.V. wrote the paper; and all authors contributed to the final version of the manuscript.
Conflict-of-interest disclosure: The authors declare no competing financial interests.
Correspondence: Peter Vandenberghe, University Hospital Leuven, 49 Herestraat, B-3000 Leuven, Belgium; e-mail: peter.vandenberghe@uzleuven.be.

