

Key Points
GBM contains distinct subsets of cancer cells expressing coagulant effectors, including PDPN.
GBM-derived PDPN triggers local and systemic prothrombotic states following its release into blood as cargo of EVs.

Abstract
Vascular anomalies, including local and peripheral thrombosis, are a hallmark of glioblastoma (GBM) and an aftermath of deregulation of the cancer cell genome and epigenome. Although the molecular effectors of these changes are poorly understood, the upregulation of podoplanin (PDPN) by cancer cells has recently been linked to an increased risk for venous thromboembolism (VTE) in GBM patients. Therefore, regulation of this platelet-activating protein by transforming events in cancer cells is of considerable interest. We used single-cell and bulk transcriptome data mining, as well as cellular and xenograft models in mice, to analyze the nature of cells expressing PDPN, as well as their impact on the activation of the coagulation system and platelets. We report that PDPN is expressed by distinct (mesenchymal) GBM cell subpopulations and downregulated by oncogenic mutations of EGFR and IDH1 genes, along with changes in chromatin modifications (enhancer of zeste homolog 2) and DNA methylation. Glioma cells exteriorize their PDPN and/or tissue factor (TF) as cargo of exosome-like extracellular vesicles (EVs) shed from cells in vitro and in vivo. Injection of glioma-derived podoplanin carrying extracelluar vesicles (PDPN-EVs) activates platelets, whereas tissue factor carrying extracellular vesicles (TF-EVs) activate the clotting cascade. Similarly, an increase in platelet activation (platelet factor 4) or coagulation (D-dimer) markers occurs in mice harboring the corresponding glioma xenografts expressing PDPN or TF, respectively. Coexpression of PDPN and TF by GBM cells cooperatively affects tumor microthrombosis. Thus, in GBM, distinct cellular subsets drive multiple facets of cancer-associated thrombosis and may represent targets for phenotype- and cell type–based diagnosis and antithrombotic intervention.
Introduction
Glioblastoma (GBM), a lethal high-grade astrocytic brain tumor,1 is associated with florid vascular growth, local microthrombosis,2 and high risks for systemic venous thromboembolism (VTE).3,4 Cancer-associated thrombosis (CAT) is morbid and may also promote disease aggressiveness,4,5 calling for more effective biologically based countermeasures.6
Multiple mechanisms have been proposed to contribute to thrombosis in GBM, including vascular abnormalities, overexpression of tissue factor (TF), and release of procoagulant microparticles (extracellular vesicles [EVs])7,8 by tumor cells. EVs have attracted special attention because of their presence in the circulation, involvement in CAT in other cancers,9 and the association between vesiculation processes and genetic GBM progression.10 Indeed, tumor EVs may carry TF, promote coagulant responses, and transfer coagulants to various recipient cells,11 locally and systemically.4 In spite of these compelling properties, data on the involvement of TF-carrying EVs in GBM-related VTE have been conflicting.12
Recent studies revealed an intriguingly close association between the expression of podoplanin (PDPN) and the incidence of VTE in GBM patients,13 mimicked by the impact of this protein on platelet aggregation in murine GBM models.14 PDPN is a glycosylated sialomucin-type transmembrane protein that is normally expressed by lymphatic endothelium, embryonal brain, and neural stem cells, whereas the reexpression of this protein in GBM has long been correlated with poor prognosis in a manner that is still mechanistically unclear.15 PDPN plays several regulatory roles throughout the vasculature, including embryonal separation of blood and lymphatic vascular systems.16 Importantly, direct interaction between PDPN and CLEC2 receptor on the surface of platelets results in their aggregation and hemostatic responses.17 GBM patients with VTE have low platelet counts compared with controls,12 and their tumor levels of PDPN are correlated with the VTE risk, both of which suggest that PDPN may drive VTE via platelet activation.13
Oncogenic pathways may act as regulators of prothrombotic phenotype expressed by cancer cells.18 For example, molecular subtypes of GBM (proneural, mesenchymal, and classical), driven by distinct genetic and epigenetic alterations,19 express different profiles of coagulation-related genes (coagulomes).6,20 Moreover, several of the underlying driver mutations, including oncogenic forms of epidermal growth factor receptor (EGFRvIII), isocitrate dehydrogenase 1 (IDH1 R132H), loss of phosphatase and tensin homolog (PTEN), and reprogramming of the cellular epigenome, have been implicated in dysregulation of TF, PDPN, and other hemostatic proteins,6 along with changes in the global prothrombotic phenotype of GBM cells21 and tumors.8
The emerging subtype-based GBM stratification22,23 has recently been challenged by profiling of tumors at the levels of the single-cell transcriptome and epigenome.24 These analyses revealed that each GBM lesion consists of a unique mosaic of distinct cancer cell subpopulations that may exhibit molecular features corresponding to known GBM subtypes or of intermediate nature.24 It is this self-sustained numerical proportion (architecture) of cellular pools that ultimately defines the global subtype of a given GBM tumor,24 including populations of glioma stem cells (GSCs) and their progeny.24 Cellular equilibria in GBM are suggested to be imposed by oncogenic driver mutations25 but are ultimately defined by epigenetic differentiation programs that lead to formation of cells with progenitor, mesenchymal, astrocytic, oligodendroglial, and neuronal phenotypes.26 These programs are executed through chromatin modification and DNA methylation pathways.27 The implications of such cellular heterogeneity for GBM-related thrombosis are intriguing but have not been fully investigated.6
Here, we explore the landscapes of heterogeneous GBM cell populations seeking connection with their coagulant phenotypes, especially the levels of PDPN. Single-cell sequencing data revealed that PDPN messenger RNA (mRNA) expression differs nonrandomly among individual cells making up human GBM lesions. Notably, PDPN-high cell populations harbor a wider coagulant/inflammatory gene expression profile. In a subset of tumors, high PDPN levels coincided with a low level of EGFR mRNA; a similar pattern was observed in glioma cell lines and GSCs expressing EGFR following induced differentiation. In EGFRvIII-driven glioma cells, PDPN expression was negatively regulated by the chromatin modifier enhancer of zeste homolog 2 (EZH2). Notably, PDPN was found in exosome-like EVs released by PDPN-expressing glioma cells and, in varying amounts, in blood of GBM patients. Tumors arising in mice after inoculation with PDPN-expressing glioma cells trigger distinct profiles of circulating markers of thrombosis, and these effects were recapitulated by intravascular injections of GBM EVs. Overall, our study suggests that GBMs may represent coagulant mosaics containing PDPN- expressing and -nonexpressing cell subpopulations in which coagulant phenotypes favor the role of platelets in systemic CAT. We suggest that detecting and targeting PDPN-expressing cells or their effects on platelets may curtail GBM-associated systemic thrombosis.
Materials and methods
Cell culture conditions, reagents, and treatments
All previously described and characterized U373P and U87P glioma cell lines were grown in monolayer cultures, under standard growth conditions,28 whereas patient-derived GSCs were cultured as neurospheres described earlier.29 For functional assays we used the following variants of U373P cells: U373vIII cells expressing EGFRvIII and TF but not PDPN; tumorigenic U373-PT cells not expressing EGFRvIII or TF but positive for PDPN; and tumorigenic U373TF-G11-PT cells not expressing EGFRvIII but positive for TF and PDPN. To mimic the natural history of GBM, in some experiments the cell lines cells were reisolated and cultured from mouse primary tumors (PTs). For instance, U373vIII cells reisolated from tumors were referred to as U373vIII PT (additional details are included in supplemental Methods).
RNA analysis
Total cellular RNA was prepared using the RNeasy Mini RNA extraction kit (QIAGEN Cat. No. 74104). RNA was reverse transcribed to single-stranded complementary DNA using a QuantiTect Reverse Transcription kit (QIAGEN Cat. No. 205310) and amplified using polymerase chain reaction (supplemental Methods). For miR-520g, RNA was isolated from cells using an miRNeasy kit (QIAGEN), and quantification was done using NanoDrop.7 Reverse transcription of microRNA was performed using a TaqMan MicroRNA Reverse Transcription Kit (ThermoFisher Scientific Cat. No. 4427975), according to the manufacturer’s protocols (supplemental Methods).
Protein immunodetection
Immunoblotting was carried out using the indicated antibodies following sodium dodecyl sulfate polyacrylamide gel electrophoresis and protein transfer, which, along with tissue immunostaining and enzyme-linked immunosorbent assay, are detailed in supplemental Methods.
Mouse tumor models
All procedures involving animals were performed in accordance with the guidelines of the Canadian Council of Animal Care and the Animal Utilization Protocols approved by the Institutional Animal Care Committee at the Research Institute of the McGill University Health Centre and McGill University. Tumor analysis, blood collection, platelet isolation, and activation assays are detailed in supplemental Methods.
EV isolation and analysis
EV isolation and characterization were performed as previously described30 and detailed in supplemental Methods.
Data analysis and statistics
Raw single-cell RNA-sequencing (scRNA-seq) data for the Gene Expression Omnibus database (accession number GSE57872) were obtained from the Sequence Read Archive database and analyzed as described in supplemental Methods. The functional gene sets, including Hallmark Coagulation, were extracted from the Gene Set Enrichment Analysis database compiled based on literature reports (http://www.gsea-msigdb.org/gsea/msigdb/cards/HALLMARK_COAGULATION).31 Roadmap plots were generated as described previously.26 All cancer cells from the Couturier et al26 data set were projected on the fetal roadmap that included inhibitory neurons, truncated radial glia (which corresponds to mesenchymal cancer cells), astrocytes, oligodendrocyte-lineage cells, and glial progenitors. Gene expression is shown as the log of unique molecular identifier counts for that gene. Counts were normalized in every cell to 100 000 total counts for all genes. All results were reproduced at least twice, as indicated in the figure legends, and statistical analysis of numerical data was performed using analysis of variance (ANOVA) and Tukey’s multiple-comparison posttest. A P value < .05 was used as a measure of the significance of difference between groups (see figure legends and supplemental Methods for additional experimental details).
Results
Distinct phenotype of PDPN-expressing GBM cells
In view of the association between PDPN expression and the risk of thrombosis in GBM,13 we wished to understand whether this coagulant effector is expressed across cancer cells in a random (nonspecific) or selective manner. Our initial analysis of single-cell transcriptomes of 5 GBM lesions covering the spectrum of disease subtypes revealed a differential contribution of PDPN-expressing (PDPNhigh) cells to individual tumors, as revealed by violin plots, with the lowest representation in proneural GBM (MGH26) (Figure 1A). Interestingly, t-SNE plots revealed a nonrandom distribution and clustering of high PDPN expression among GBM cells within 3 or 4 transcriptionally distinct subpopulations present across all tumor samples (Figure 1B). This was further supported by the distinctive clustering of PDPN-expressing GBM cells within the GBM roadmap plot where the enrichment for this expression occurred preferentially within the mesenchymal tumor cell subpopulation (supplemental Figure 1A-B). Interrogating the function-linked aspects of transcriptional signatures associated with PDPNhigh GBM cell subpopulations using predesigned gene expression analysis tools (Hallmarks, Gene Ontology, and Kyoto Encyclopedia of Genes and Genomes) suggested the preponderance of genes involved in coagulation, inflammation, wound healing, mesenchymal transition, and RAS signaling (Figure 1C; supplemental Table 1). Interestingly, the multigenic Hallmark Coagulation data set (listing genes involved in coagulation, complement activation, and proteolysis within the Molecular Signatures Database Hallmark Gene Sets Data Base [MSigDB])31 correlated with PDPN expression in gene set enrichment analyses (GSEAs) of single-cell transcriptomes (Figure 1D; supplemental Tables 2-4). This may suggest that PDPNhigh GBM cells possess a distinct coagulant/inflammatory phenotype amid other cancer cell populations. Notably, a similar association between PDPN enrichment and the Hallmark Coagulation was also present in the Cancer Genome Atlas data set representing a whole tumor mass, which may suggest that tumor positivity for PDPN mRNA reflects tumor enrichment for the PDPNhigh cell subset (Figure 1E).
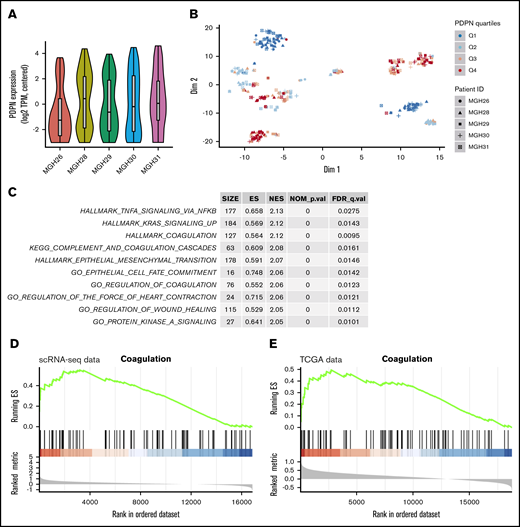
PDPN-expressing cell populations in glioblastoma. (A) Violin plot demonstrates the heterogeneous expression of PDPN among cell populations within individual GBMs. (B) t-SNE analysis captures the distinctiveness of PDPN+ and PDPN− cell subpopulations of 5 individual GBMs. These cellular subsets, comprising individual cells originating from different GBM tumors, exhibit transcriptional similarities. PDPN expression was ranked by quartiles Q1 to Q4 in an increasing order of expression. (C) Pathway enrichment analysis shows the top 10 enriched pathways in cells with the highest PDPN expression (Q4) compared with those with the lowest PDPN expression (Q1). Of note is the preponderance of coagulation and inflammatory pathways according to MSigDB and Kyoto Encyclopedia of Genes and Genomes (KEGG) gene sets. (D) GSEA plot showing pronounced enrichment of Hallmark Coagulation genes in cells with high PDPN expression (Q4) in the scRNA-seq data set compared with those with low PDPN expression (Q1). (E) This observation persists when analyzing The Cancer Genome Atlas (TCGA) bulk tumor samples (right panel); Hallmark Coagulation genes are similarly enriched in tumors with high PDPN expression (Q4) compared with those with low expression (Q1).
PDPN-expressing cell populations in glioblastoma. (A) Violin plot demonstrates the heterogeneous expression of PDPN among cell populations within individual GBMs. (B) t-SNE analysis captures the distinctiveness of PDPN+ and PDPN− cell subpopulations of 5 individual GBMs. These cellular subsets, comprising individual cells originating from different GBM tumors, exhibit transcriptional similarities. PDPN expression was ranked by quartiles Q1 to Q4 in an increasing order of expression. (C) Pathway enrichment analysis shows the top 10 enriched pathways in cells with the highest PDPN expression (Q4) compared with those with the lowest PDPN expression (Q1). Of note is the preponderance of coagulation and inflammatory pathways according to MSigDB and Kyoto Encyclopedia of Genes and Genomes (KEGG) gene sets. (D) GSEA plot showing pronounced enrichment of Hallmark Coagulation genes in cells with high PDPN expression (Q4) in the scRNA-seq data set compared with those with low PDPN expression (Q1). (E) This observation persists when analyzing The Cancer Genome Atlas (TCGA) bulk tumor samples (right panel); Hallmark Coagulation genes are similarly enriched in tumors with high PDPN expression (Q4) compared with those with low expression (Q1).
EGFR-related downregulation of PDPN in glioma-derived cells
Intriguingly, in a subset of GBM cells, low PDPN expression was associated with a high level of EGFR (supplemental Figures 1B-C, 2, and 3; supplemental Information) even though both proteins are associated with increased GBM aggressiveness.32,33 Because EGFR and its mutant form (EGFRvIII) are thought to act as drivers of glioma progression34 and affect the cellular coagulome,28 we next explored the potential impact of this oncogene on PDPN in a panel of human glioma cell lines: EGFRlow parental U87P and U373P cells and their EGFRvIII-overexpressing aggressive counterparts (U87vIII and U373vIII; Figure 2A). Notably, although both parental glioma cell lines expressed appreciable levels of PDPN mRNA and protein, those signals were undetectable in variants harboring EGFRvIII (Figure 2B-C). Moreover, in single-cell transcriptomes of human gliomas, a limited number of which could be reliably verified for EGFR mutation status, we observed a trend toward lower PDPN levels in EGFRvIII-expressing cells, although this did not reach statistical significance (supplemental Figure 3A). We also obtained aggressive variants of U373P cells lacking EGFRvIII derived through a prolonged selection in vivo (Figure 2A). These alternatively transformed cells (U373PT) retained their high PDPN expression (Figure 2A-D).5 We next analyzed patient-derived proneural GSCs devoid of EGFR expression and positive for PDPN (Figure 2E).35 When subjected to serum-induced astrocytic differentiation,29 these patient-derived proneural GSCs (GSC157, GSC1079; Figure 2E) triggered the expression of EGFR and downregulated PDPN. Thus, although PDPN expression in glioma is compatible with aggressive growth, it is suppressed in the context of cell subsets with activated EGFR expression.
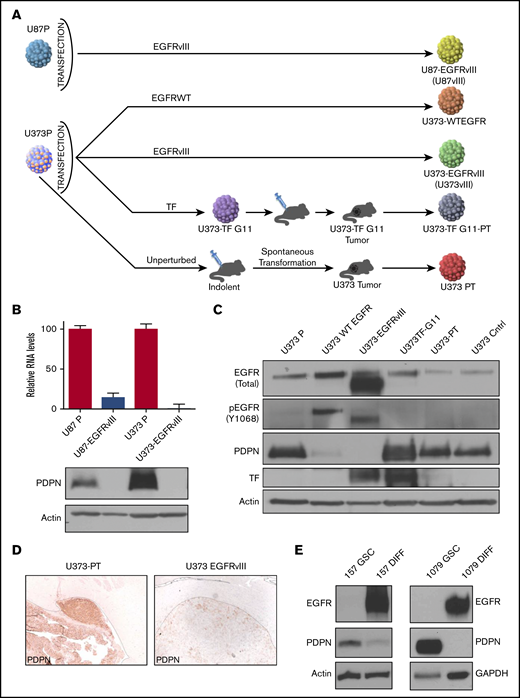
Downregulation of PDPN in glioma cells expressing oncogenic EGFR. (A) Derivation of U87 and U373 families of isogenic glioma cell lines driven by EGFRvIII-dependent and -independent pathways of tumorigenesis. (B) Downregulation of PDPN mRNA and protein in U87 and U373 cell lines engineered to express oncogenic EGFRvIII (n = 3). (C) Expression levels of wild-type (WT) (upper band) EGFR, EGFRvIII (lower band), PDPN, and TF in isogenic variants of U373 glioma (n = 2). (D) Immunohistochemical staining for PDPN of glioma xenografts originating from intracranial injection of tumorigenic variants of U373 cells with (U373vIII) or without (U373-PT) EGFRvIII expression (magnification ×100). EGFRvIII-associated downregulation of PDPN is maintained in vivo (n = 6). (E) Reciprocal changes in the expression of EGFR and PDPN in proneural GSC lines (GSC157 and GSC1079) in stem cell (GSC) and differentiated (DIFF) cultures maintained in the presence of serum for 25 to 30 days (n = 3).
Downregulation of PDPN in glioma cells expressing oncogenic EGFR. (A) Derivation of U87 and U373 families of isogenic glioma cell lines driven by EGFRvIII-dependent and -independent pathways of tumorigenesis. (B) Downregulation of PDPN mRNA and protein in U87 and U373 cell lines engineered to express oncogenic EGFRvIII (n = 3). (C) Expression levels of wild-type (WT) (upper band) EGFR, EGFRvIII (lower band), PDPN, and TF in isogenic variants of U373 glioma (n = 2). (D) Immunohistochemical staining for PDPN of glioma xenografts originating from intracranial injection of tumorigenic variants of U373 cells with (U373vIII) or without (U373-PT) EGFRvIII expression (magnification ×100). EGFRvIII-associated downregulation of PDPN is maintained in vivo (n = 6). (E) Reciprocal changes in the expression of EGFR and PDPN in proneural GSC lines (GSC157 and GSC1079) in stem cell (GSC) and differentiated (DIFF) cultures maintained in the presence of serum for 25 to 30 days (n = 3).
EGFR impacts PDPN expression through a combined effect of epigenetic reprogramming and signaling
To examine how activated EGFR may control PDPN levels, U373vIII cells were treated with blockers of canonical EGFR signaling, such as a pan-ERBB kinase inhibitor (dacomitinib/PF00299802) or a selective phosphatidylinositol 3-kinase (PI3K) inhibitor (pictilisib/GDC-0941), for up to 72 hours (Figure 3A-C; supplemental Figure 4C). However, rescue of PDPN expression was not observed in these settings, arguing against a direct role for this receptor or downstream PI3K signaling alone. Because oncogenic transformation may also affect the epigenome, at the levels of DNA methylation and chromatin architecture,34 we also interrogated PDPN expression in U373vIII and U87vIII cells treated with a DNA demethylating agent, 5-azacytidine36 (Figure 3C). Although this treatment led to the expected reexpression of the known methylated miRNA-520g locus36 (supplemental Figure 4B), it failed to rescue the expression of PDPN in EGFRvIII-transformed cells.
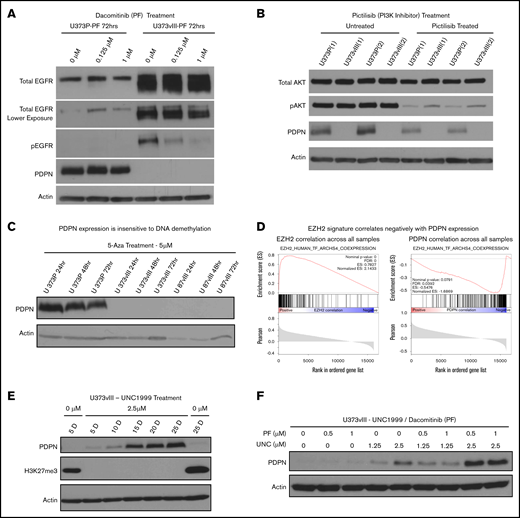
Histone methylation and oncogenic signaling impact PDPN expression. (A) Irreversible blockade of EGFR phosphorylation by dacomitinib (PF) does not rescue PDPN expression in EGFRvIII-driven U373vIII cells (n = 3). (B) Inhibition of PI3K activity (downstream effector of EGFR) by pictilisib fails to restore PDPN expression in U373vIII cells (n = 3). (C) Treatment with 5-azacytidine (5-Aza) does not lead to reexpression of PDPN protein in U373vIII cells (n = 3). (D) Relationship between known EZH2-correlated genes and EZH2 (left panel) or PDPN (right panel) across GBM cells. In each GSEA plot, the x-axis shows the ranking of genes based on their correlation with EZH2 or PDPN across the single-cell GBM data set.33 The vertical black lines denote the set of genes known to be positively correlated with EZH2, based on a meta-analysis of publicly available bulk tissue RNA-seq data sets.40 (E) Treatment of U373vIII cells with the EZH2 inhibitor (UNC1999) leads to gradual and partial reexpression of PDPN over 25 days (25 D) (n = 5). (F) Enhancement of PDPN protein expression in U373vIII glioma cells cotreated with inhibitors of EZH2 (UNC1999) and EGFR (dacomitinib) suggests a role for histone H3 trimethylation and chromatin modification, as well as EGFR kinase signaling, in PDPN regulation (n = 3)
Histone methylation and oncogenic signaling impact PDPN expression. (A) Irreversible blockade of EGFR phosphorylation by dacomitinib (PF) does not rescue PDPN expression in EGFRvIII-driven U373vIII cells (n = 3). (B) Inhibition of PI3K activity (downstream effector of EGFR) by pictilisib fails to restore PDPN expression in U373vIII cells (n = 3). (C) Treatment with 5-azacytidine (5-Aza) does not lead to reexpression of PDPN protein in U373vIII cells (n = 3). (D) Relationship between known EZH2-correlated genes and EZH2 (left panel) or PDPN (right panel) across GBM cells. In each GSEA plot, the x-axis shows the ranking of genes based on their correlation with EZH2 or PDPN across the single-cell GBM data set.33 The vertical black lines denote the set of genes known to be positively correlated with EZH2, based on a meta-analysis of publicly available bulk tissue RNA-seq data sets.40 (E) Treatment of U373vIII cells with the EZH2 inhibitor (UNC1999) leads to gradual and partial reexpression of PDPN over 25 days (25 D) (n = 5). (F) Enhancement of PDPN protein expression in U373vIII glioma cells cotreated with inhibitors of EZH2 (UNC1999) and EGFR (dacomitinib) suggests a role for histone H3 trimethylation and chromatin modification, as well as EGFR kinase signaling, in PDPN regulation (n = 3)
We next considered changes in the chromatin architecture as a known epigenetic factor involved in gliomagenesis,22 PDPN regulation, and modulating the coagulome.37 One of the key elements in this regard is the polycomb repressive complex 2, an assembly of nuclear proteins involving gene-silencing activity of the histone-lysine N-methyltransferase, known as EZH2, that trimethylates lysine 27 of histone 3 (H3K27).38 Indeed, EGFR has been implicated in epigenetic gene repression through its impact on EZH2.39 While exploring this thread through GSEA surveys of single-cell and bulk GBM data sets,19,24 we noticed that genes known to be positively correlated with EZH2 expression in a meta-analysis of thousands of bulk tissue RNA-seq datasets40 also correlated positively with EZH2 in the singe-cell GBM dataset (Figure 3D, left panel; supplemental Figure 7A) and correlated negatively with PDPN across the GBM cell data (Figure 3D, right panel). This observation suggests that PDPNlow cells exhibit high EZH2 regulon activity; conversely, PDPNhigh cells exhibit low EZH2 regulon activity.
To assess this linkage further, U373vIII cells were cultured in the presence of various concentrations of the EZH2 inhibitor (UNC1999) over a period of 25 days to allow cellular reprogramming, followed by the assessment of PDPN protein expression. Indeed, UNC1999 completely blocked H3K27 trimethylation, and the resulting repressive state gradually led to a partial recovery of PDPN expression in U373vIII cells (Figure 3E). Moreover, combined treatment with UNC1999 and dacomitinib resulted in a further increase in PDPN protein levels (Figure 3F; supplemental Figure 4D). These results suggest that the epigenetic silencing may play an important role in PDPN regulation in a subset of glioma cells, thereby enabling an additional layer of PDPN control that is executed, in part, through oncogenic EGFR signaling.
Epigenome-impacting mutations of IDH1 oncogene downregulate PDPN expression in glioma
We also investigated the regulation of PDPN transcript in subsets of GBM lesions expressing mutant or wild-type IDH122 (supplemental Figure 5). Unlike in EGFR-driven GBM cell lines, PDPN downregulation correlated with DNA methylation levels, directly affecting the PDPN gene locus in several independent data sets. Thus, the effects of mutant IDH1 and EGFR on PDPN are executed via different aspects of the epigenome.
PDPN is released from glioma cells as cargo of EVs
CAT is thought to be influenced by systemically released coagulants, including EVs.4 Therefore, we purified EVs from the media of glioma cells30 ; subsequent western blotting revealed a PDPN signal in EVs of PDPNhigh cells (U373P)41 (Figure 4A). This result was confirmed through direct immunogold staining and electron microscopy of EVs isolated from the related tumorigenic U373PT cell population (Figure 4B; supplemental Figure 7B). Because the morphology and size of these EVs corresponded with those of exosomes (50-150 nm),41 EV isolates were further resolved using an iodixanol density gradient (OptiPrep), lysed, and immunoblotted for coagulation (PDPN and TF) and EV markers (flotillin 1, CD81, syntenin, and CD9).41 As expected, a subset of EVs isolated from cultures of primary tumor–derived (PT) cell lines (U373PT and U373vIII PT) floated at the exosomal density of iodixanol (∼1.1 g/mL, fractions 4-5) and exhibited corresponding patterns of canonical EV proteins. The PDPN and TF expression patterns in EVs followed those of the respective cancer cells28 (Figure 2B-C); U373vIII PT cell–derived EVs (U373vIII PT-EVs) were PDPN−/TFhigh, whereas their U373PT-derived counterparts (U373PT-EVs) were PDPNhigh/TF− (Figure 4C). We also performed single EV immunoprofiling using nanoflow cytometry30 to compare individual EVs with regard to PDPN, TF, and EV markers. Again, EVs matched the PDPN/TF profiles of their donor cells by expressing PDPN alone (U373PT), TF alone (U373vIII PT), or both (U373-PT-G115 ), along with the exosomal marker CD81 (Figure 4D). Interestingly, double-positive U373-PT-G11 cells produced a proportion of EVs harboring both PDPN and TF, in addition to single positives (Figure 4D). Collectively, these results suggest that GBM cells exteriorize their prothrombotic effectors as exosome-like EVs, in a manner reflective of their cellular phenotype and oncogenic/epigenetic status.
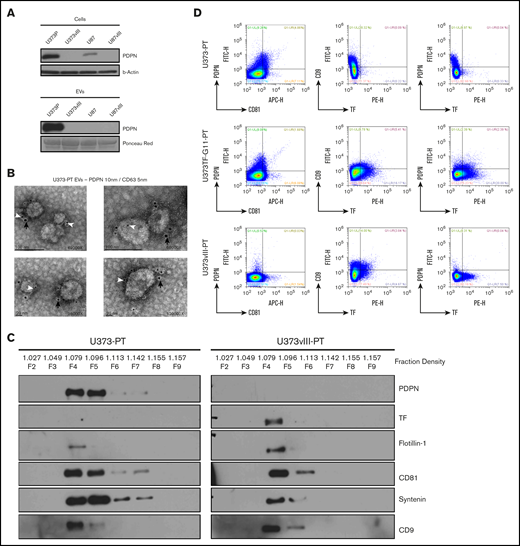
PDPN is released from glioma cells as cargo of EVs. (A) Detection of PDPN immunoreactivity in glioma cells and EVs; highly positive U373P cells release ample PDPN+ EVs relative to PDPN-downregulated U373vIII and U87vIII cell lines. Lower levels of PDPN expression in U87P cells result in the absence of PDPN signal in EVs (n = 3). (B) Immunogold staining and electron microscopy of U373P EVs for PDPN (10-nm gold particles, black arrows) and exosomal marker CD63 (5-nm gold particles, white arrowheads). Multiple small EVs (≤100 nm) stain for both PDPN and CD63 (n = 2). (C) Glioma EVs float at exosomal density in the iodixanol gradient (F4-F5) and commonly express multiple EV markers (flotillin-1, CD81, syntenin, and CD9). EVs released from EGFRvIII− (U373PT) cells carry PDPN, but not TF, whereas their isogenic counterparts from EGFRvIII+ cells (U373vIII) carry TF, but not PDPN (n = 3). (D) Single EV nanoflow cytometry of EV populations from glioma cells expressing PDPN alone (U373PT), PDPN and TF (U373TF-G11-PT), or TF alone (U373vIII-PT). EVs are heterogenous, but their subsets coexpress CD81, PDPN, and TF (n = 5) (supplemental Methods).
PDPN is released from glioma cells as cargo of EVs. (A) Detection of PDPN immunoreactivity in glioma cells and EVs; highly positive U373P cells release ample PDPN+ EVs relative to PDPN-downregulated U373vIII and U87vIII cell lines. Lower levels of PDPN expression in U87P cells result in the absence of PDPN signal in EVs (n = 3). (B) Immunogold staining and electron microscopy of U373P EVs for PDPN (10-nm gold particles, black arrows) and exosomal marker CD63 (5-nm gold particles, white arrowheads). Multiple small EVs (≤100 nm) stain for both PDPN and CD63 (n = 2). (C) Glioma EVs float at exosomal density in the iodixanol gradient (F4-F5) and commonly express multiple EV markers (flotillin-1, CD81, syntenin, and CD9). EVs released from EGFRvIII− (U373PT) cells carry PDPN, but not TF, whereas their isogenic counterparts from EGFRvIII+ cells (U373vIII) carry TF, but not PDPN (n = 3). (D) Single EV nanoflow cytometry of EV populations from glioma cells expressing PDPN alone (U373PT), PDPN and TF (U373TF-G11-PT), or TF alone (U373vIII-PT). EVs are heterogenous, but their subsets coexpress CD81, PDPN, and TF (n = 5) (supplemental Methods).
Diverse coagulant activities of glioma cell populations and their EVs
Circulating human PDPN was detectable by ELISA in the blood of mice harboring U373PT (PDPNhigh/TFlow) xenografts, whereas similar U373vIII tumor burden produced a minimal PDPN signal, with tumor-free mice being negative (Figure 5A; supplemental Figure 8A). This is in line with heterogeneous PDPN levels detected in the plasma of GBM patients (Figure 5B), along with similarly heterogenous expression of circulating TF (supplemental Figure 6). To explore the consequences of such PDPN release profiles, mice were xenografted with glioma cells expressing PDPN (U373PT), TF (U373vIII), or both (U373TF-G11-PT) and tested for the activation of platelets (for PDPN) and the clotting cascade (for TF). Interestingly, in the absence of signs of bone marrow suppression, as indicated by comparable red blood cell counts (supplemental Figure 8B), tumors expressing high levels of PDPN (U373PT, U373TF-G11-PT) triggered a significant reduction in the overall platelet counts (Figure 5C) that coincided with upregulation of circulating platelet factor 4 (PF4), both suggestive of platelet activation and consumption, in line with clinical results in GBM.8,13 Moreover, incubation of YFP-labeled platelets with PDPNhigh GBM cells or their EVs ex vivo led to the expression of P-selectin (platelet activation marker) at sites of surface contacts (supplemental Figure 7). Notably, coexpression of high PDPN and high TF levels in U373TF-G11-PT cells did not significantly change these end points, despite the fact that TF is present on the surface of these cells and is released into the pericellular space, in a biologically active form, as EVs11 (supplemental Figures 8C-F and 9A-B). This result is surprising given the expected thrombin-generating potential of the TF pathway, which could activate platelets; however, it also resembles recent clinical findings that did not reveal a strong association between TF expression and the risk of VTE in GBM patients.42
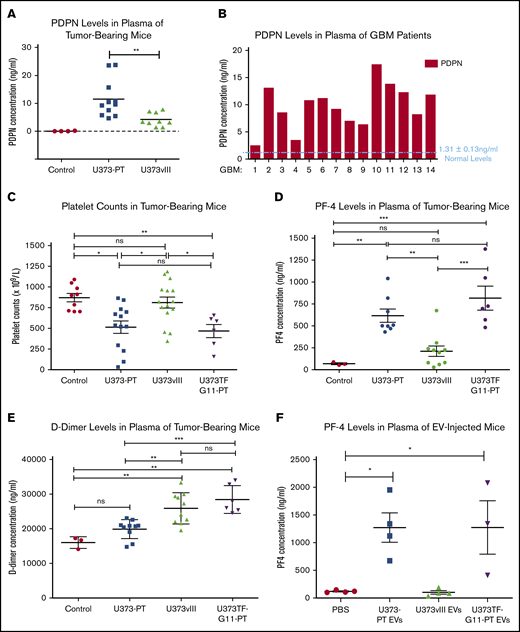
Heterogenous coagulant profiles associated with glioma. (A) Immunodetection (ELISA) of circulating human PDPN in plasma of mice with U373PT and U373vIII glioma xenografts. Suppression of PDPN in EGFRvIII-driven U373vIII cells leads to low PDPN levels in blood (Control - plasma of tumor-free mice). Tumor sizes were comparable across the entire panel (supplemental Information). (B) Detection of various PDPN levels in plasma of GBM patients (human PDPN ELISA), mostly above the normal levels of 1.31 ± 0.13 ng of PDPN protein per mL of plasma as reported in the literature.47 (C) Reduced platelet counts in mice harboring PDPNhigh glioma xenografts (U373PT, U373TF-G11-PT) vs PDPNlow tumors (U373vIII) and tumor-free controls (no myelosuppression was observed; supplemental Information). (D) Increased PF4 levels in plasma of mice with PDPNhigh glioma xenografts vs those with PDPNlow tumors and controls (as in panel C). (E) D-dimer levels in plasma of mice bearing glioma xenografts. In the case of tumors expressing PDPN (U373PT), D-dimers were not significantly different from those in controls; however, they were elevated in TF-expressing U373vIII tumors and U373TF-G11-PT tumors with high levels of TF and PDPN. (F) PF4 levels in plasma of mice injected IV with glioma EVs (10 μg per mouse). PF4 elevation occurred in mice injected with PDPN-carrying EVs (U373TF-G11-PT and U373PT) regardless of TF status, whereas PDPN− and TF+ EVs (U373vIII) did not produce any such increase above the background (phosphate-buffered saline). *P ≤ .05, **P ≤ .01, ***P ≤ .001, ANOVA multiple-comparison analysis. ns, not significant.
Heterogenous coagulant profiles associated with glioma. (A) Immunodetection (ELISA) of circulating human PDPN in plasma of mice with U373PT and U373vIII glioma xenografts. Suppression of PDPN in EGFRvIII-driven U373vIII cells leads to low PDPN levels in blood (Control - plasma of tumor-free mice). Tumor sizes were comparable across the entire panel (supplemental Information). (B) Detection of various PDPN levels in plasma of GBM patients (human PDPN ELISA), mostly above the normal levels of 1.31 ± 0.13 ng of PDPN protein per mL of plasma as reported in the literature.47 (C) Reduced platelet counts in mice harboring PDPNhigh glioma xenografts (U373PT, U373TF-G11-PT) vs PDPNlow tumors (U373vIII) and tumor-free controls (no myelosuppression was observed; supplemental Information). (D) Increased PF4 levels in plasma of mice with PDPNhigh glioma xenografts vs those with PDPNlow tumors and controls (as in panel C). (E) D-dimer levels in plasma of mice bearing glioma xenografts. In the case of tumors expressing PDPN (U373PT), D-dimers were not significantly different from those in controls; however, they were elevated in TF-expressing U373vIII tumors and U373TF-G11-PT tumors with high levels of TF and PDPN. (F) PF4 levels in plasma of mice injected IV with glioma EVs (10 μg per mouse). PF4 elevation occurred in mice injected with PDPN-carrying EVs (U373TF-G11-PT and U373PT) regardless of TF status, whereas PDPN− and TF+ EVs (U373vIII) did not produce any such increase above the background (phosphate-buffered saline). *P ≤ .05, **P ≤ .01, ***P ≤ .001, ANOVA multiple-comparison analysis. ns, not significant.
Notably, TF-expressing xenografts exhibited coagulant properties, as revealed by increased D-dimer levels in animals with U373TF-G11-PT and U373vIII tumors relative to the levels in their counterparts with PDPNhigh/TFlow expression profiles (U373PT), for which D-dimers were only slightly (insignificantly) higher than baseline (Figure 5E). Some of these coagulant responses could be recapitulated following IV injection of the respective EVs. Thus, TF-carrying U373vIII EVs failed to increase PF4 in the blood of tumor-free mice, whereas PDPN-enriched U373PT or U373TF-G11 EVs increased PF4 in the circulation (Figure 5F).
It is noteworthy that injection of glioma tissue factor carrying extracellular vesicles (TF-EVs) failed to trigger a statistically significant upsurge in D-dimer levels, suggesting that, in this case, TF-EVs may be insufficient to trigger a strong coagulant response in the peripheral circulation. This is despite the robust TF procoagulant activity associated with TF-EVs in vitro and in vivo, as measured by a factor Xa–generation assay (supplemental Figure 9A-C). We reasoned that the elevated D-dimers observed in the plasma of mice xenografted with U373TF-G11-PT and U373vIII could be a result of D-dimer generation within the tumor mass and its subsequent release into the blood stream. To test this hypothesis, we compared the total D-dimer content of tumor lysate with that of corresponding plasma in the same mice. This analysis (ELISA) revealed a markedly (104 fold) higher content of D-dimers within the whole tumor mass relative to the same measurement in the total volume of plasma (supplemental Figure 9D). This observation is consistent with the possibility that peripheral D-dimer may come from thrombosis occurring within the tumor microcirculation, a notion that deserves independent investigation. Overall, these results suggest that activation of different components of the hemostatic machinery could be tumor specific. Moreover, EV-mediated release of PDPN appears to be sufficient to systemically upregulate platelet activation markers in a mouse model of GBM.
Cooperation between PDPN and TF in experimental tumor microthrombosis
To explore the impact of different profiles of PDPN and TF expression on the intratumoral microthrombosis, GBM xenografts were investigated for vascular morphology, fibrin deposition, and platelet-rich thrombi (Figure 6). Interestingly, staining with MSB dye revealed the highest intravascular fibrin content in tumors composed of U373PT-G11-PT cells (PDPNhigh/TFhigh), with considerably lower signals for U373vIII (PDPNlow/TFhigh) and U373PT (PDPNhigh/TFlow) lesions (Figure 6A). This observation was corroborated by immunofluorescent staining for intravascular fibrin (Figure 6B). Strikingly, these tumors also had the highest number of vessels with occluding thrombi positive for CD61, a marker of platelets (Figure 6C). Thus, although systemic activation of platelets (PF4) was linked largely to PDPN expression by cancer cells and EVs, the extent of intratumoral microthrombosis appeared to be a function of TF and PDPN coexpression. This observation may suggest that, in the tumor microenvironment, a high concentration of these cell membrane–associated prothrombotic effectors may lead to their cooperation.
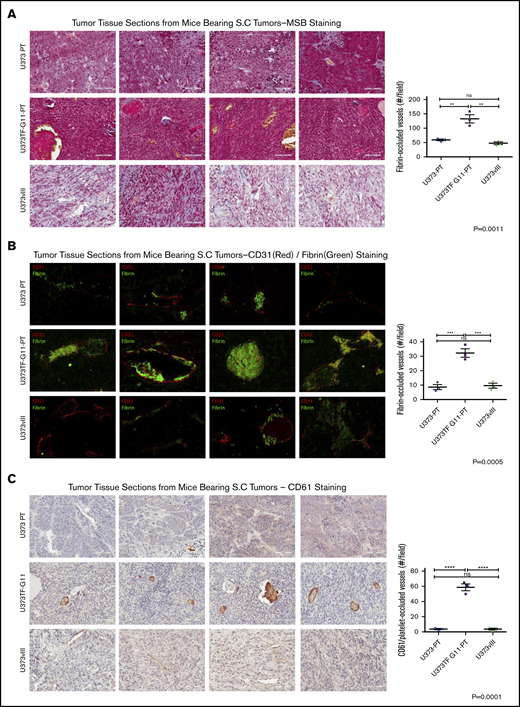
Cooperation between PDPN and TF in tumor microthrombosis in glioma xenografts. (A) Martius scarlet blue trichrome (MSB) staining for thrombi in 4 representative xenografts expressing PDPN alone (U373PT), PDPN and TF (U373TF-G11-PT), or TF alone (U373vIII) (left panels); bars represent 100 μm. Quantification of occluded vessels containing fibrin thrombi (right panel) indicates significant elevation in the case of U373TF-G11-PT (PDPN+/TF+) tumors. (B) Immunofluorescent staining of tumors for endothelial cells (CD31, red) and fibrin (green) (left panels). Fibrin-occluded vessels predominated in U373TF-G11-PT tumors (PDPN+/TF+) (right panel); magnification ×400. (C) Immunohistochemical staining of glioma xenografts for mouse platelet marker CD61 (left panels). Platelet-rich thrombi were most abundant in U373TF-G11-PT (PDPN and TF–double expressing) tumors (right panel); bars represent 100 μm. **P ≤ .01, ***P ≤ .001, ****P ≤ .0001, ANOVA multiple-comparison analysis. ns, nonsignificant
Cooperation between PDPN and TF in tumor microthrombosis in glioma xenografts. (A) Martius scarlet blue trichrome (MSB) staining for thrombi in 4 representative xenografts expressing PDPN alone (U373PT), PDPN and TF (U373TF-G11-PT), or TF alone (U373vIII) (left panels); bars represent 100 μm. Quantification of occluded vessels containing fibrin thrombi (right panel) indicates significant elevation in the case of U373TF-G11-PT (PDPN+/TF+) tumors. (B) Immunofluorescent staining of tumors for endothelial cells (CD31, red) and fibrin (green) (left panels). Fibrin-occluded vessels predominated in U373TF-G11-PT tumors (PDPN+/TF+) (right panel); magnification ×400. (C) Immunohistochemical staining of glioma xenografts for mouse platelet marker CD61 (left panels). Platelet-rich thrombi were most abundant in U373TF-G11-PT (PDPN and TF–double expressing) tumors (right panel); bars represent 100 μm. **P ≤ .01, ***P ≤ .001, ****P ≤ .0001, ANOVA multiple-comparison analysis. ns, nonsignificant
Discussion
Our study brings forward several new elements. First, we documented a nonrandom expression of PDPN among GBM cells and the association of this prothrombotic marker with cell subpopulations enriched for inflammation- and coagulation-related genes, as well as a mesenchymal-differentiation signature. Second, we shed new light on the counterintuitive negative association between 2 oncogenic drivers (EGFR and IDH1 R132H) and the expression of PDPN in 2 distinct GBM subgroups and in parallel with 2 epigenetic mechanisms (chromatin modification and DNA methylation, respectively). We posit that the related epigenetic mechanisms operating during the process of GSC differentiation may override the signaling cues regulating PDPN and other coagulation-related genes shaping the dynamic of CAT. Third, we demonstrated that GBM cells expressing PDPN produce a distinct form of systemic prothrombotic perturbations in vivo that is attributable, at least in part, to EVs carrying PDPN (relative to coagulation driven by TF). Fourth, we suggested that microthrombosis within the tumor mass may be a function of cooperation between 2 major cancer coagulants (PDPN and TF) rather than PDPN alone.
In the context of GBM, CAT represents a spectacular example of systemic vascular pathology associated with a localized cancer.3 Indeed, although mostly intracranial, GBM lesions trigger clotting in the peripheral vasculature, including life-threatening pulmonary embolism,3 in conjunction with activation of platelet-dependent mechanisms previously correlated with PDPN expression.13 Although TF is often expressed in GBM cells,43 its role in CAT has been debated.42 Our data suggest that, in GBM, the effects of PDPN and TF, and of those of their carrying EVs, may differ between settings of systemic and local thrombosis.
We also postulate that, although tumor-derived PDPN associated with circulating EVs may directly interact with platelets in the peripheral blood, as indicated by the rise in PF4 upon direct EV injection, the effects of TF-carrying EVs are more complex. We observed only a mild activation of peripheral markers of coagulation, especially D-dimer, upon IV injection of EVs carrying active TF. This is in contrast with our novel observation indicating the potent ability of TF-expressing tumors to generate D-dimer within the tumor microenvironment, with subsequent release into the circulation. Although this aspect requires further study, the ability of EV-associated TF alone to generate thrombin to activate platelets may be limited by spatial considerations and EV half-life in the circulation.44
Taken together, our study expands on the emerging link between oncogenic transformation (genetic or epigenetic) and thrombosis in GBM.6,18 Indeed, the risk of VTE varies between cancer patients and their subgroups in an apparently nonstochastic manner. Although in some cases CAT correlates with specific oncogenic drivers,8,45 or molecular profiles of cancer cells,46 better and more biologically based predictive algorithms are lacking. Our study aims to narrow this gap by suggesting that the properties of PDPN-expressing cells and their ability to shed EVs may be relevant to the VTE risk in GBM patients. We would like to speculate that the preponderance of PDPN expression as a risk factor in GBM,13 as well as the apparent involvement of platelets in our GBM model, suggests that antiplatelet agents may have a role in VTE management in this setting. This question requires further study.
It should be noted that the recruitment of inflammatory cells, release of cellular chromatin, angiogenesis, and other aspects of the tumor microenvironment are also orchestrated by cancer-related genetic and epigenetic transformation pathways and their related changes in the cellular secretome. It might be suggested that, in GBM, a better characterization of a broader phenotype of PDPN-expressing cells (beyond PDPN levels) provides additional clues about their role in VTE and in biological processes involved (eg, activation of platelets, coagulation cascade, and interaction with inflammatory and vascular cells). A better understanding of these cellular interrelationships, beyond single markers, may offer a novel path toward a more personalized management of VTE and noncoagulant effects of the hemostatic system in high-grade brain tumors.
Data sharing requests should be sent to Janusz Rak (janusz.rak@mcgill.ca).
Acknowledgments
The authors thank the Immunophenotyping Platform for nanofluorescence-activated cell sorting and the Molecular Imaging Platform for support during imaging analyses conducted at the Research Institute of the McGill University Health Centre.
This work was supported by a Foundation Grant (FDN 143322) from the Canadian Institutes for Health Research (J.R.). J.R. is the Jack Cole Chair in Pediatric Hematology/Oncology. Infrastructure funds, graduate studentships (N.T. and C.S.), and postdoctoral fellowship (L.A.) were provided by the Fonds de Recherche Santé du Quebec.
Authorship
Contribution: N.T., R.B., B.M., A.N., L.M., L.A., C.S., D.C., S.C., and C.P.C. performed investigations and validation; A.N., T.G., N.D.J., M.Z., M.W., A.P., and I.T. curated data; N.T., J.R., R.B., and A.N. wrote the manuscript; B.M., N.M., C.L.K., N.J., N.S.K., D.S., M.W., Y.R., and S.P.G. reviewed and edited the manuscript; J.R., H.N., N.J., C.L.K., M.L.S., and K.P. supervised the study; and J.R. acquired funds for the study.
Conflict-of-interest disclosure: The authors declare no competing financial interests.
Correspondence: Janusz Rak, Research Institute of the McGill University Health Centre, 1001 Decarie Blvd, E. M1.2244, Montreal, QC H4A 3J1, Canada; e-mail: janusz.rak@mcgill.ca.

