

Key Points
Recipients of UCB had the lowest 5-year health care burden of the graft types compared by a density composite score.

Abstract
Recipients of allogeneic hematopoietic cell transplantation (HCT) experience a substantial health care burden, with potentially differing patterns of long-term health care requirements using peripheral blood stem cells, bone marrow, and umbilical cord blood (UCB) grafts. We analyzed data from 1077 consecutive adult allogeneic HCT recipients who underwent transplant at the University of Minnesota between 2000 and 2016. To estimate health care burden over time, we compared the number of visits, laboratory studies, medications, and relative value units billed. Health care elements were analyzed both individually and together (ie, total health care elements used per patient days into a density composite score). UCB had the lowest density health care burden composite score from the time of transplant through year 5 (median score 64.0 vs 70.5 for peripheral blood stem cells and 88.0 for bone marrow; P < .01). In multivariate analysis of health care burden between years 1 and 5, recipients of either bone marrow (odds ratio [OR] 0.49 [95% confidence interval (CI) 0.29-0.84]) or peripheral blood stem cells (OR 0.49 [95% CI 0.36-0.67]) were half as likely to experience low health care burden compared with UCB. Adult recipients of UCB have a lower long-term health care burden compared with other graft sources, possibly reflecting a better quality of life.
Introduction
Since the field of hematopoietic cell transplantation (HCT) emerged >50 years ago, it has moved from an experimental procedure to standard of care for many patients with high-risk or relapsed hematologic malignancies.1,2 Data from the Center for International Blood and Marrow Transplant at Research indicate that the United States surpassed 9000 annual HCT allogeneic transplants recipients in 2018, with a continued upward trend in transplant procedures anticipated.3 As the number of transplant procedures has increased, unfortunately so has the cumulative treatment burden. During 2004 to 2007, aggregate costs increased 84.9% for the HCT procedure, equivalent to a 1.3 billion dollar increase in total.4 The median cost of the first 100 days of allogeneic HCT treatment was reported as $289 283 in 2012, with 73% to 76% of the cost originating from hospital charges.5 Most analyses of HCT health care burden focus on outcomes up to 1 year, whereas complications of HCT can require a patient’s ongoing treatments for many years.6,7
Although complication rates may vary, the long-term health care burden may also vary substantially by different graft sources. Umbilical cord blood (UCB) transplantation is associated with a higher initial cost, but differences in some late effects, such as risks of chronic graft-versus-host disease (cGVHD), could impact costs long term.8,9 In this analysis, we compared the 5-year health care burden after HCT using different graft sources.
Methods
In collaboration with University of Minnesota (UMN) Best Practices Integrated Informatics Core of the University Clinical and Translational Science Institute, we extracted individual counts of visits, laboratory studies, medications ordered (including administration to inpatients), relative value units (RVUs) billed from the hospital record capturing data from the University of Minnesota Medical Center M Health Fairview, and all Fairview-managed hospitals and clinics in the metropolitan area. This data extraction included both inpatient and outpatient care delivery. We extracted the number of visits and services (both face to face and phone or other care coordination visits), procedures, laboratory studies, medication orders placed, and clinical RVUs billed over 3 time periods: (1) day 0 to day 100, (2) 101 to 365 days, and (3) >1 year to 5 years after HCT. We also extracted number of hospital days and readmissions, although these data were only available after February 2011. The population consisted of 1077 allogeneic HCT recipients at the UMN transplanted between the years 2000 and 2016. Data analyzed included age at diagnosis, transplant date, graft type, sex, diagnosis (acute myeloid leukemia [AML], acute lymphoblastic leukemia, non-Hodgkin lymphoma, myelodysplastic syndrome, or other diseases), distance from home to transplant center (calculated by zip code), as well as key transplant outcomes, including overall survival (OS), disease-free survival (DFS), graft-versus-host disease (GVHD), graft-versus-host disease–free, relapse-free survival (GRFS), engraftment, secondary malignancies, and death. Recipients of haploidentical transplant were infrequent prior to 2016 and thus excluded. The UMN institutional review board approved this retrospective study.
We summarized individual counts of health care burden elements by medians and interquartile ranges. We compared groups using χ2 tests or Wilcoxon tests as appropriate. The density of each health care component element was calculated as the counts per measures per 100 survival days in each period. To generate a health care burden composite score, each density was assigned a rank score from 1 to 20 by percentile (minimum to 5% was assigned rank score of 1, 5% to 10% was assigned rank score of 2, and so on). We then generated the composite score by adding up the rank scores on these different health care elements for every patient in each period. For multivariate analysis, we divided the health care burden composite density score into quintiles, with a lower OR indicating a lower likelihood of having in the lowest quintile health care burden. All analyses were performed using R version 3.4.2 (R Core Team, 2019).
Results and discussion
Univariate analyses
Patient demographics are detailed in Table 1. AML was the most common indication for transplant, with no significant difference in conditioning intensity between the groups. The median distance from the recipient’s home zip code to the transplant center was <30 miles or less for all graft cohorts. Univariate analysis of health care utilization from the time of transplant is detailed in Table 2. During early posttransplant recovery, there is a detectable but clinically insignificant difference in clinical visits between recipients of bone marrow transplant (BMT), peripheral blood stem cell (PBSC), or UCB grafts (median 67.5 vs 62 vs 60 visits over 100 days, respectively). However, recipients of PBSC had fewer laboratory studies, medications, and RVUs billed in the first 100 days posttransplant. From day 101 to 365, recipients of UCB had approximately half of the number of face-to-face visits, half as many laboratory studies, and the lowest RVUs billed of all graft sources (P < .01 for each component). After 1-year posttransplant, UCB recipients continued to have the lowest number of visits, laboratory studies, medications prescribed, and RVUs billed, although comparisons of individual components of health care burden were not statistically significant (Table 2). Boxplots of visits, laboratory studies drawn, and medications prescribed are detailed in Figure 1A-D. These boxplots of unadjusted counts show the frequent interactions with the health care system in early posttransplant recovery, with a median of >60 visits, >2000 laboratory studies, >100 to 200 medication orders, and >400 RVUs billed prior to day 100.
Patient demographics
| BMT | PBSC | UCB | P | |
|---|---|---|---|---|
| (N = 102) | (N = 458) | (N = 517) | ||
| Age, y | <.01 | |||
| Median (Min-Max) | 46.3 (19.2-75.1) | 55.1 (19.0-74.8) | 50.8 (18.1-73.3) | |
| Sex, % | .03 | |||
| Male | 58 (56.9) | 289 (63.1) | 284 (54.9) | |
| Female | 44 (43.1) | 169 (36.9) | 233 (45.1) | |
| Diagnosis, % | <.01 | |||
| Acute lymphoblastic leukemia | 9 (8.8) | 49 (10.7) | 90 (17.4) | |
| AML | 21 (20.6) | 197 (43.0) | 221 (42.7) | |
| Chronic lymphocytic leukemia | 2 (2.0) | 14 (3.1) | 13 (2.5) | |
| Chronic myeloid leukemia | 21 (20.6) | 14 (3.1) | 6 (1.2) | |
| Hodgkin lymphoma | 5 (4.9) | 13 (2.8) | 27 (5.2) | |
| Myelodysplastic syndrome | 12 (11.8) | 65 (14.2) | 55 (10.6) | |
| Multiple myeloma | 6 (5.9) | 19 (4.1) | 16 (3.1) | |
| Myeloproliferative disease | 1 (1.0) | 5 (1.1) | 13 (2.5) | |
| Non-Hodgkin lymphoma | 8 (7.8) | 65 (14.2) | 67 (13.0) | |
| Other | 17 (16.7) | 17 (3.7) | 10 (1.9) | |
| Conditioning intensity, % | .21 | |||
| Myeloablative | 43 (42.2) | 153 (33.4) | 190 (36.8) | |
| Reduced intensity conditioning/non-myeloablative conditioning/other | 59 (57.8) | 305 (66.6) | 327 (63.2) | |
| Relation of donor, % | ||||
| Related | 41 (40.2) | 424 (92.6) | 0 (0) | <.01 |
| Unrelated | 61 (59.8) | 34 (7.4) | 517 (100) |
Univariate analysis of health care elements by graft source and posttransplant time period
| Category | BMT | PBSC | BMT vs PBSC P | UCB | BMT vs UCB P |
|---|---|---|---|---|---|
| Day 0 to 100 | |||||
| Face-to-face visits* | 48 (23-71) | 43 (3-67) | .10 | 40 (2-67) | .02 |
| Total visits | 67.5 (37-95) | 62 (20-87) | .03 | 60 (13-93) | .03 |
| Laboratory studies* | 2448.0 (1896-3710) | 2212.5 (1712-3016) | <.01 | 2960.0 (2335-3883) | <.01 |
| Medications* | 232 (108.5-331.5) | 132 (1-245) | <.01 | 203 (0-359) | .29 |
| RVUs* | 480.7 (372.8-702.2) | 423.2 (294.4-569.3) | <.01 | 466.7 (292.7-689.1) | .23 |
| Day 101 to 365 | |||||
| Face-to-face visit* | 32 (7-88) | 22 (0-61) | .02 | 9 (0-51) | <.01 |
| Total visits* | 63.5 (16-131) | 41.5 (3-96) | .01 | 26 (1-89) | <.01 |
| Laboratory studies* | 1189.5 (302-2667) | 1010 (217-2063) | .11 | 567 (58-2005) | .01 |
| Medications | 76.5 (0-276) | 50 (0-175) | .12 | 31 (0-202) | .06 |
| RVUs | 300.7 (33.4-580.6) | 213.6 (14.9-479.7) | .14 | 174.5 (0-471.9) | .03 |
| Years 1 to 5 | |||||
| Face-to-face visit* | 7 (0-59) | 9 (0-75) | .10 | 1 (0-29) | .43 |
| Total visits* | 14.5 (0-112) | 22 (0-133) | .58 | 6 (0-68) | .12 |
| Laboratory studies* | 82 (0-1205) | 220 (0-2145) | .10 | 75 (0-631) | .43 |
| Medications* | 15.5 (0-161.5) | 38 (0-257) | .09 | 14 (0-100) | .99 |
| RVUs* | 40.7 (0-500.5) | 86.4 (0-510.8) | .37 | 30.3 (0-256.3) | .51 |
Medians and interquartile ranges are displayed.
Significant P value from Kruskal-Wallis test among 3 source groups.
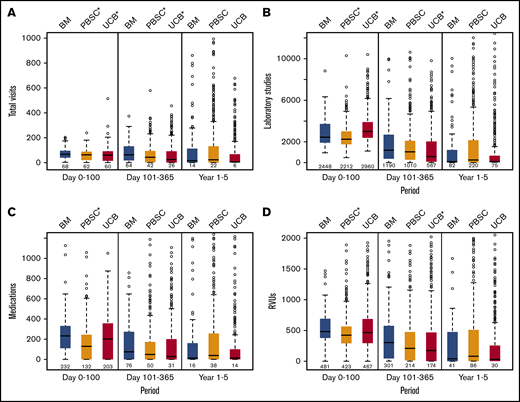
Components of healthcare burden. Individual counts of health care burden elements by graft source and time period: total inpatient and outpatient visits (A), laboratory studies (B), medication orders (C), and RVUs billed (D).
Components of healthcare burden. Individual counts of health care burden elements by graft source and time period: total inpatient and outpatient visits (A), laboratory studies (B), medication orders (C), and RVUs billed (D).
Univariate analysis of the major posttransplant events by graft source is detailed in Table 3. There was no significant difference in 5-year OS (overall 41%; P = .9), 5-year DFS (overall 34%; P = .75), 5-year relapse (overall 34%; P = .48), and 180-day grade III to IV acute graft-versus-host disease (aGVHD; overall 20%; P = .21) comparing graft sources. GRFS at 5 years was lowest in recipients of PBSC grafts (9% vs 23% for bone marrow [BM] and 21% for UCB; P < .01). This may be in large part due to higher rates of cGVHD in patients receiving PBSC grafts (44% vs 22% for both BM and UCB grafts; P < .01).
Univariate analysis of major posttransplant events by graft source
| Variable | Strata | Estimate, % | CI 95% | P |
|---|---|---|---|---|
| 5-y OS | BM | 40 | 29-51 | .90 |
| PBSC | 39 | 34-44 | ||
| UCB | 43 | 38-47 | ||
| 5-y DFS | BM | 37 | 26-48 | .75 |
| PBSC | 32 | 28-37 | ||
| UCB | 35 | 31-40 | ||
| 5-y relapse | BM | 29 | 20-39 | .48 |
| PBSC | 37 | 32-42 | ||
| UCB | 33 | 28-38 | ||
| 5-y GRFS | BM | 23 | 14-33 | <.01 |
| PBSC | 9 | 7-13 | ||
| UCB | 21 | 17-25 | ||
| Day 42 ANC engraftment | BM | 98 | 93-100 | <.01 |
| PBSC | 97 | 95-99 | ||
| UCB | 91 | 89-94 | ||
| Grade II to IV aGVHD | BM | 42 | 31-52 | <.01 |
| PBSC | 36 | 31-40 | ||
| UCB | 47 | 42-51 | ||
| Grade III to IV aGVHD | BM | 17 | 10-24 | .21 |
| PBSC | 19 | 15-22 | ||
| UCB | 22 | 18-25 | ||
| cGVHD | BM | 22 | 14-30 | <.01 |
| PBSC | 44 | 39-50 | ||
| UCB | 22 | 18-25 |
Proportions of patients experiencing death, relapse, progression, and second malignancies by graft source per time period are detailed in Table 4. There was no statistically significant difference in the frequency of these complications during any phase of posttransplant recovery by graft source. Similar proportions of patients experiencing these complications make it less likely that differences in health care burden by graft source over time are influenced by these events. The number of days in the hospital and readmissions per 100 days of survival differed by graft source, with UCB recipients requiring the longest number of days in the hospital prior to day 100 (39.3 days vs 32.7 days for BMT and 26.2 days for PBSC; P < .01; Table 5). However, in years 1 to 5, recipients of UCB had a low number of hospital days per 100 days of survival (median 0.3 vs 0.5 for BMT and 2 for PBSC; P = .01) and readmissions per 100 days of survival (median 0.1 vs 0.2 for BMT and 0.4 for PBSC; P = .01).
Death, relapse, and new malignancy
| BMT | PBSC | UCB | ||
|---|---|---|---|---|
| (N = 102) | (N = 458) | (N = 517) | P | |
| Death, % | .50 | |||
| Day 0 to 100 | 15 (14.7) | 73 (15.9) | 96 (18.6) | |
| Days 101 to 365 | 23 (22.5) | 101 (22.1) | 97 (18.8) | |
| Years 1 to 5 | 15 (14.7) | 83 (18.1) | 83 (16.1) | |
| Alive at 5 y | 49 (48.0) | 201 (43.9) | 241 (46.6) | |
| Relapsed or progression, % | .22 | |||
| Day 0 to 100 | 11 (10.8) | 73 (15.9) | 61 (11.8) | |
| Days 101 to 365 | 14 (13.7) | 49 (10.7) | 62 (12.0) | |
| Years 1 to 5 | 3 (2.9) | 34 (7.4) | 35 (6.8) | |
| No relapse | 74 (72.5) | 302 (65.9) | 359 (69.4) | |
| New malignancy, % | .35 | |||
| Day 0 to 100 | 1 (1.0) | 4 (0.9) | 6 (1.2) | |
| Days 101 to 365 | 2 (2.0) | 10 (2.2) | 14 (2.7) | |
| Years 1 to 5 | 4 (3.9) | 34 (7.4) | 19 (3.7) | |
| No malignancy before death or by 5 y | 95 (93.1) | 410 (89.5) | 478 (92.5) | |
| Number of alive subjects during each period, % | ||||
| Day 0 to 100 | 102 | 458 | 517 | |
| Days 101 to 365 | 87 | 385 | 421 | |
| Years 1 to 5 | 52 | 265 | 295 | |
| Relapse/progression-free subjects during each period | ||||
| Day 0 to 100 | 102 | 458 | 517 | |
| Days 101 to 365 | 79 | 326 | 372 | |
| Years 1 to 5 | 42 | 218 | 239 |
Hospital length of stay and number of admissions
| BM (N = 77) | PBSC (N = 249) | UCB (N = 255) | P | |
|---|---|---|---|---|
| Density of hospital days/100 survival days, median (IQR) | ||||
| Pretransplant to day 100 | 32.7 (26.2-55.1) | 26.2 (18.9-39.3) | 39.3 (29.6-60.2) | <.01 |
| Days 101 to 365 | 0 (0-10) | 0 (0-15.4) | 2.5 (0-13.6) | 1.00 |
| Years 1 to 5 | 0.5 (0-7.9) | 2.0 (0.1-7.5) | 0.3 (0-4.0) | .01 |
| Density of hospital admissions/100 survival days, median (IQR) | ||||
| Pretransplant to 100 | 1 (0-3.0) | 0.4 (0-1.4) | 2 (1-2.4) | .04 |
| Days 101 to 365 | 0.4 (0-1.1) | 1.0 (0-2.0) | 0.4 (0-1.4) | .79 |
| Years 1 to 5 | 0.2 (0-0.6) | 0.4 (0-1.4) | 0.1 (0-0.4) | .01 |
IQR, interquartile range.
Health care burden as a composite density score
When considering the total health care burden as a composite density score, recipients of PBSC had the lowest health care through day 100, as expected. However, in both the intermediate and long-term recovery periods, UCB had the lowest median composite density score (P < .01; Figure 2). When performing a density analysis of all time periods combined, UCB still had the lowest density health care burden composite score encompassing the time of transplant through year 5 (median score 64.0 vs 70.5 for PBSCs and 88.0 for BM; P < .01). In multivariate analysis between days 0 and 100, recipients of BM (odds ratio [OR] 0.45 [95% confidence interval (CI) 0.30-0.67]), age >60 (OR 0.41 [95% CI 0.29-0.59]), those undergoing myeloablative conditioning (OR 0.70 [95% CI 0.53-0.93]), and those with grade II to IV aGVHD (OR 0.71 [95% CI 0.56-0.88]) had the lowest odds of having a low health care burden (Figure 3A). Between days 101 and 365 posttransplant, recipients of BM (OR 0.43 [95% CI 0.28-0.65]) and age >60 (OR 0.48 [95% CI 0.35-0.66]) had a low likelihood of having a low health care burden (Figure 3B). In the late recovery period (years 1 to 5), recipients of either BM (OR 0.49 [95% CI 0.29-0.84]) or PBSC (OR 0.49 [95% CI 0.36-0.67]) had half the likelihood of experiencing low health care burden compared with UCB (Figure 3C). Again, in this period, age >60 years was a negative risk factor (OR 0.60 [95% CI 0.41-0.90)].
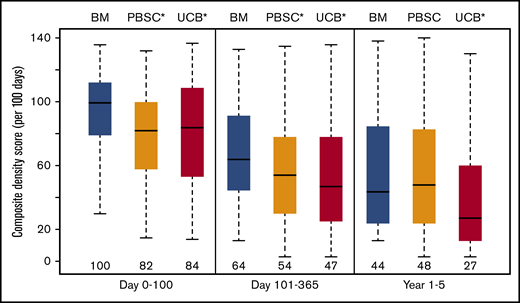
Composite score. Density analysis (per 100 patient survival days) of health care burden composite score comparing BM, PBSC, and UCB graft sources. Groupwise comparisons within each time period are all P < .01.
Composite score. Density analysis (per 100 patient survival days) of health care burden composite score comparing BM, PBSC, and UCB graft sources. Groupwise comparisons within each time period are all P < .01.
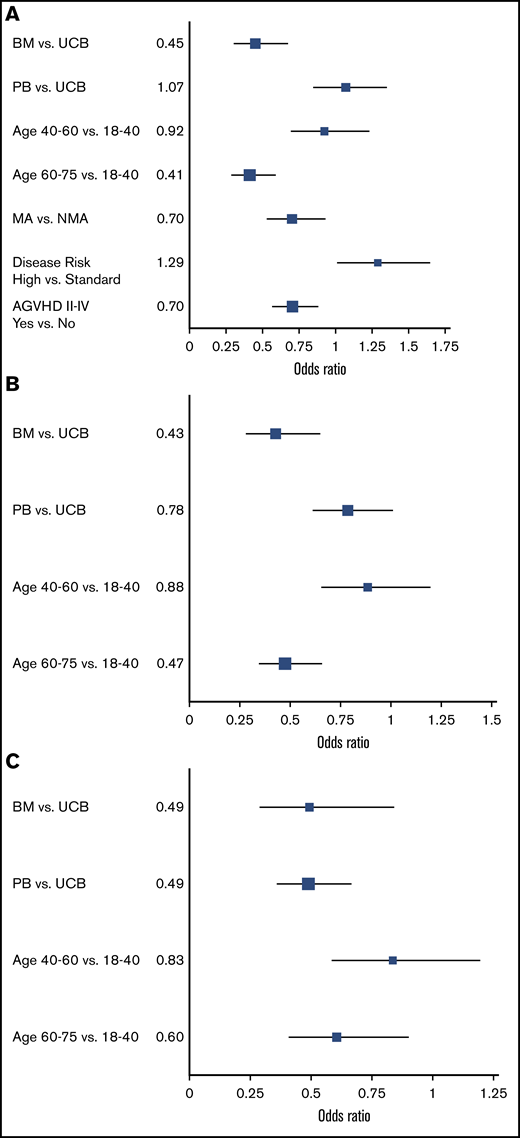
Independent factors associated with healthcare burden. Multivariate analysis of factors associated with health care burden between days 0 and 100 (A), between day 101 and 1 year (B), and between years 1 and 5 posttransplant (C). The OR of being in the lowest quintile of health care burden (as determined by the composite density score per 100 patient survival days) is shown. MA, myeloablative.
Independent factors associated with healthcare burden. Multivariate analysis of factors associated with health care burden between days 0 and 100 (A), between day 101 and 1 year (B), and between years 1 and 5 posttransplant (C). The OR of being in the lowest quintile of health care burden (as determined by the composite density score per 100 patient survival days) is shown. MA, myeloablative.
When considering the posttransplant recovery period out to 5 years, we show that long-term health care burden is lowest overall in recipients of UCB. Our observations are highly relevant to patient outcomes, as many patients want to know what “normal” life looks like after allogeneic transplantation. Many patients have prolonged requirements for laboratory monitoring, medications, and frequent assessments, which contribute to patient burden. These differences are due in large part to the lower incidence of cGVHD in UCB, but other unknown factors may contribute to this result. The similarities in other key posttransplant outcomes by graft source, such as OS and DFS, show that our most common metrics do not completely reflect patient experience that requires extensive ongoing care.
The major strength of this study is the granular capture of the patients’ interaction within a large health care system (UMN, M Health Fairview) over a 5-year time frame. Our results suggest that possibly the higher upfront cost of UCB may be offset by long-term favorable outcomes and simpler care during recovery that have previously not been recognized because of a shorter timescale of follow-up. The greater cost of UCB HCT in the early post-HCT interval is well recognized.10,11 A recent analysis of a combined Center for International Blood and Marrow Transplant at Research and Medicare dataset showed that adjusted mean reimbursements for UCB were ∼$91 000 greater than PBSC grafts because of higher acquisition costs and prolonged time to engraftment.12 Further research may indicate if improved HLA matching or ex vivo UCB expansion techniques are able to improve engraftment and limit resource utilization in the early posttransplant period.
Beyond delayed engraftment, GVHD is the major driver of health care burden in the first year post-HCT.13,14 Although rates of grade III to IV aGVHD did not differ between graft sources in our cohort, we showed that rates of cGVHD are half that observed with PBSC. Thus, the lower burden of GVHD after UCB could contribute to a lower health care utilization requirement after transplantation, potentially offsetting the acquisition cost and contributing to long-term improved quality of life with lesser imposition of complex health care needs. In conclusion, our study highlights the importance of analyzing posttransplant health care burden over an extended time. A longer vantage point may provide more opportunities to appreciate critical distinctions between graft sources and other aspects of supportive care aimed at improving survival without ongoing morbidity.
Reasonable requests for deidentified data may be made by e-mailing the corresponding author, Shernan G. Holtan (sgholtan@umn.edu).
Acknowledgments
This research was supported by the National Institutes of Health (NIH), National Center for Advancing Translational Sciences grant UL1TR002494. This project was also supported in part by NIH, National Cancer Institute P30CA77598 and P01CA111412, utilizing the Biostatistics and Bioinformatics Shared Resource of the Masonic Cancer Center, UMN, and P01CA065493 (J.E.W.).
The content is solely the responsibility of the authors and does not necessarily represent the official views of the National Institutes of Health’s National Center for Advancing Translational Sciences.
Authorship
Contribution: J.G.G., D.J.W., and S.G.H. developed the concept, analyzed data, and wrote the paper; S.G. and Q.C. collected and analyzed data and edited the paper; C.G.B., M.A., M.L.M., and J.E.W. reviewed the analysis and edited the manuscript; and all authors provided final approval of the manuscript prior to submission.
Conflict-of-interest disclosure: C.G.B. serves on an advisory board for AlloVir and receives research funding from Astex, Gamida, and Magenta. M.A. has received consultancy fees from Fate Therapeutics and receives research funding from Pharmacyclics, Kadmon, and Syndax. M.L.M. has received consultancy fees from Talaris Therapeutics, Fate Therapeutics, Mesoblast, Angiocrine Biosciences, and Equillium. J.E.W. has stock and other ownership interests in Magenta Therapeutics; serves in a consulting or advisory role for Magenta Therapeutics; receives research funding from Novartis, Gamida Cell, Magenta Therapeutics; and has received fees from patents, royalties, and other intellectual property: patent application on manufacturing thymic progenitors from and has received fees pertaining to travel, accommodations, and expenses from Magenta Therapeutics and Rocket Pharmaceuticals. D.J.W. receives research funding from Incyte and has received consultancy fees from Fate Therapeutics. S.G.H. has received consultancy fees from Incyte, BMS, and Generon and performs clinical trial adjudication for CSL Behring. The remaining authors declare no competing financial interests.
Correspondence: Shernan G. Holtan, Blood and Marrow Transplant Program, University of Minnesota, Mayo Mail Code 480, 420 Delaware St SE, Minneapolis, MN 55455; e-mail: sgholtan@umn.edu.

