

TO THE EDITOR:
Current protocols for intensive treatment include targeted drugs specific for certain genetic subtypes.1 Subtyping is then often required before the start of treatment (other than hydroxyurea), and we must wait for genetic results for all patients. This requirement is medically motivated if it is unclear whether the patient will benefit from intensive treatment as compared with nonintensive targeted therapy, or if data show that targeted therapy is more effective if given on day 1 of an intensive protocol as compared with somewhat later. However, the requirement for immediate genetic subtyping of patients suited for intensive treatment is often based on a need for registration to a specific protocol or simply an arbitrary standard stated in the protocol. As a consequence, rapid diagnostic tools have been developed for required analyses according to specific protocols; now, fluorescence in situ hybridization and molecular results on FLT3, core-binding factor, IDH mutations, and more may be available within 72 hours. This is feasible for large centers but adds cost and logistic measures, and could be hard to achieve in the overall real-world setting, especially in developing countries. (However, if acute promyelocytic leukemia is suspected, urgent diagnostics are always required, and all-trans retinoic acid should be given even before diagnosis is confirmed to prevent early death.)
Results from a large German retrospective multicenter study, recently published in Blood by Röllig et al,2 were interpreted to mean that waiting for diagnostic tests would not be harmful. We here report corresponding data from the large Swedish population-based Acute Myeloid Leukemia (AML) Registry,3,4 which, however, is showing better overall results in patients with immediate treatment despite these patients having had more advanced disease, as compared with patients who had delayed treatment. A median time of 3 days between diagnostic sampling and start of intensive treatment (time from diagnosis to treatment [TDT]) indicates that, in clinical practice, regarding AML as a medical urgency is an established routine.
Our study (including all Swedish AML nonacute promyelocytic leukemia patients diagnosed since 2007 given intensive treatment, with complete survival follow-up in February 2020) was similar in size (n = 2374; median age, 64 years) to the German study (n = 2263; median age, 59 years). In both studies, two-thirds of the patients initiated treatment within 5 days from diagnosis. However, in our study, the survival was better in the immediately treated cohort (n = 1587) than among the others (n = 787) (P < .0001; Figure 1), despite worse Eastern Cooperative Oncology Group (ECOG) performance status (P = .003), higher bone marrow blast counts (median, 60% vs 35%; P < .001), lower hemoglobin (94 g/L vs 96 g/L; P < .001) and platelet count (60 × 109/L vs 82 × 109/L; P < .001), higher white blood cell count (WBC; 16.1 × 10⁹/L vs 3.7 × 10⁹/L; P < .001), and higher lactate dehydrogenase (6.8 μkat/L vs 4.5 μkat/L; P < .001; normal, <4.2); more often: FLT3-ITD (28% vs 18%; P < .001) and also NPM1 mutation (34% vs 25%; P < .001), younger age (63 years vs 67 years; P < .001), de novo AML (82% vs 65%; P < .001), and favorable genetic risk (20% vs 12%); and less often: cardiac disease (17% vs 24%; P < .001) and diabetes (7% vs 9%; P = .07) (supplemental Tables 1-5). More early treated patients achieved complete remission (CR; 80% vs 70%; P < .001) (Table 1) and underwent allogeneic stem cell transplantation (alloSCT) in first CR (26% vs 20%; P < .001) (all statistic analyses were performed with χ2 and F tests). Similar to the German study,2 there was no impact of TDT on the early death rate within 30 or 60 days from start of intensive treatment, irrespective of age (Table 1).
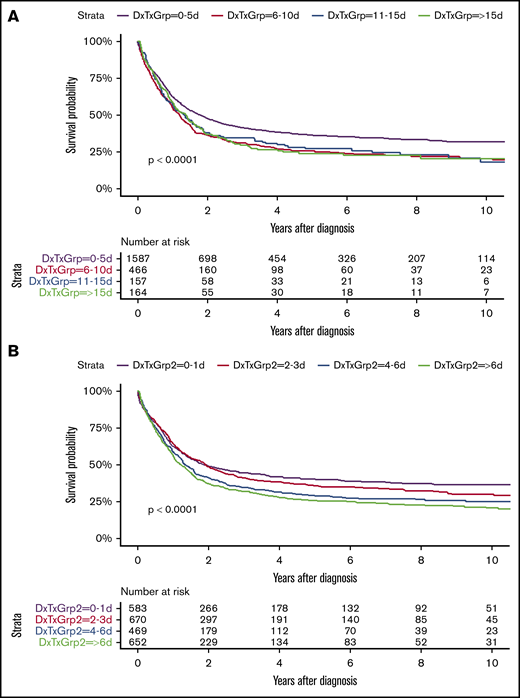
Overall survival by days from diagnosis to treatment. (A) Grouping: 0-5 d vs 6-10 d vs 11-15 d vs >15 d. P < .0001. (B) Grouping: 0-1 d vs 2-3 d vs 4-6 d vs >6 d. P < .0001. DxTxGrp, grouping according to number of days from diagnosis to treatment.
Overall survival by days from diagnosis to treatment. (A) Grouping: 0-5 d vs 6-10 d vs 11-15 d vs >15 d. P < .0001. (B) Grouping: 0-1 d vs 2-3 d vs 4-6 d vs >6 d. P < .0001. DxTxGrp, grouping according to number of days from diagnosis to treatment.
Treatment outcomes by time from diagnosis to treatment
| P | Total | 0-5 d | 6-10 d | 11-15 d | >15 d | |
|---|---|---|---|---|---|---|
| All ages, % (CI) | ||||||
| CR/CRi | <.001 | 1823/2369; 77.0 (75-79) | 1270/1584; 80.2 (78-82) | 331/465; 71.2 (67-75) | 109/157; 69.4 (62-7) | 113/163; 69.3 (62-76) |
| Death within 30 d | .619 | 170/2374; 7.2 (6.2-8.3) | 107/1587; 6.7 (5.6-8.1) | 38/466; 8.2 (5.8-11.0) | 11/157; 7.0 (3.5-12.2) | 14/164; 8.5 (4.7-13.9) |
| Death within 60 d | .173 | 275/2374; 11.6 (10.3-12.9) | 178/1587; 11.2 (9.7-12.9) | 64/466; 13.7 (10.7-17.2) | 12/157; 7.6 (4.0-13.0) | 21/164; 12.8 (8.1-18.9) |
| 2-y survival | <.001 | 43.9 (41.9-45.9) | 47.5 (45.1-50.1) | 36.0 (31.9-40.7) | 37.9 (31.0-46.4) | 36.7 (29.9-45.0) |
| ≤60 y, % (CI) | ||||||
| CR/CRi | .075 | 804/908; 88.5 (86.3-90.5) | 617/687; 89.8 (87.3-92.0) | 114/131; 87.0 (80.0-92.3) | 35/42; 83.3 (68.6-93.0) | 38/48; 79.2 (65.0-89.5) |
| Death within 30 d | .715 | 30/908; 3.3 (2.2-4.7) | 21/687; 3.1 (1.9-4.6) | 6/131; 4.6 (1.7-9.7) | 1/42; 2.4 (0.1-12.6) | 2/48; 4.2 (0.5-14.3) |
| Death within 60 d | .583 | 51/908; 5.6 (4.2-7.3) | 37/687; 5.4 (3.8-7.3) | 10/131; 7.6 (3.7-13.6) | 1/42; 2.4 (0.1-12.6) | 3/48; 6.2 (1.3-17.2) |
| 2-y survival | .252 | 60.7 (57.6-64.0) | 62.5 (58.9-66.3) | 56.0 (48.0-65.3) | 59.5 (46.4-76.4) | 49.8 (37.4-66.2) |
| >60 y, % (CI) | ||||||
| CR/CRi | .016 | 1019/1461; 69.7 (67.3-72.1) | 653/897; 72.8 (69.8-75.7) | 217/334; 65.0 (59.6-70.1) | 74/115; 64.3 (54.9-73.1) | 75/115; 65.2 (55.8-73.9) |
| Death within 30 d | .980 | 140/1466; 9.5 (8.1-11.2) | 86/900; 9.6 (7.7-11.7) | 32/335; 9.6 (6.6-13.2) | 10/115; 8.7 (4.2-15.4) | 12/116; 10.3 (5.5-17.4) |
| Death within 60 d | .354 | 224/1466; 15.3 (13.5-17.2) | 141/900; 15.7 (13.4-18.2) | 54/335; 16.1 (12.3-20.5) | 11/115; 9.6 (4.9-16.5) | 18/116; 15.5 (9.5-23.4) |
| 2-y survival | .077 | 33.4 (31.0-35.9) | 36.1 (33.3-39.4) | 28.2 (23.7-33.5) | 29.9 (22.6-39.7) | 31.2 (23.7-41.2) |
CI, confidence interval; CRi, CR with incomplete count recovery.
In univariate and multivariate Cox analysis for survival, age, AML type, ECOG performance status, genetic risk, achievement of CR, and alloSCT in first CR all entered at P < .001, with WBC at P = .001, number of chromosomal abnormalities at P = .01, and diabetes at P = .09. In contrast, TDT received a P value of .27 (full data in supplemental Tables 1-5). Our results are well in line with the established view that AML type, genetic risk, and general health all have influence on long-term risk.
We then proceeded with a quartile grouping of patients according to TDT, that is, 0 to 1 days (n = 583), 2 to 3 days (n = 670), 4 to 6 days (n = 469), and >6 days (n = 652) (supplemental Tables 1-5). Overall survival then showed continuing decline with treatment delay (P < .0001; Figure 1), and, in multivariate analysis, the overall P value for TDT was .058, with other variables as listed for the previous grouping still significant (supplemental Tables 1-5).
Our patients were treated according to national guidelines established in 2005 recommending 1 g/m2 cytarabine in 2-hour infusions twice daily days 1 to 5, and 60 mg/m2 daunorubicin in 8-hour infusions days 1 to 3, repeated as second induction or consolidation, and with further intensive consolidation. Patients with adverse or intermediate genetic risk were offered alloSCT if feasible (details in Juliusson et al5 ). No censoring for transplant was performed.
The possible discrepancy between the result in our study as compared with previous studies2,6,7 may be in part due to the more intensive induction, using intermediate-high doses of cytarabine rather than standard 3+7 dose. Also, our patients were older (median, 64 years), and thus had a somewhat higher early death rate (7.2% within 30 days). There may be differences in management, for example, when treating proliferative AML with high WBC, where there is a choice between immediate intensive treatment and pretreatment with hydroxyurea to reduce risk of tumor lysis syndrome. In all of the studies, the TDT was shorter with high WBC, and, in our study, those who had the shortest TDT, that is, 0 to 1 days, had a median WBC of 33 × 109/L, and 40% had WBC >50 × 109/L. This influences early death rates, but despite more early deaths, the long-term survival was better in the group that received immediate treatment because the most difficult challenge is not early death and achievement of CR but relapse. Our study is strictly population based, but the registry does not record the reason for delayed initiation of treatment, and thus there are many possibilities with potential impact on our results.
Our data support the interpretation that, in routine clinical practice, patients with typical aggressive AML generally receive very rapid management and benefit from this management. With increasing age, lower blast counts, and previous medical history, there is commonly a short delay before treatment, which may be due to clinical optimization, waiting for genetic test results, and/or discussing alternative options for treatment with patients and relatives. This is likely also beneficial, as judged from clinical experience without formal scientific support.
However, from available data, we cannot claim that delayed treatment in patients of any age with typical AML is without short- and long-term risk.2,6,7 Our primary goal should always be long-term disease control with optimal quality of life. Before accepting requirements to have extensive genetic results available prior to the start of specific intensive treatment protocols in clinical routine, we need studies to evaluate a common startup therapy with subsequent add-on according to genetic profile. This would allow for both early start of intensive therapy and the benefit of targeted therapy, also at hospitals with limited access to emergency diagnostics. If, however, clinical data would support a need for targeted therapy on day 1, further development of achievable rapid diagnostics should have priority.
Requests for data may be e-mailed to the corresponding author, Gunnar Juliusson, at gunnar.juliusson@med.lu.se.
Acknowledgments:
The Swedish AML Registry was supported by the Swedish Association of Local Authorities and Regions (SKR), Region Skåne, and Regionalt Cancercentrum Syd. The research was supported by the Swedish Cancer Society.
Clinical data were collected and reported by all Swedish hematology departments.
Contribution: G.J. designed the study and wrote the manuscript; O.H. performed statistical analyses; and G.J., O.H., V.L.L., S.L., and M.H., and members of the Swedish AML Group, contributed to interpretation and discussion.
Conflict-of-interest disclosure: The authors declare no competing financial interests.
A complete list of the members of the Swedish AML Group appears in “Appendix.”
Correspondence: Gunnar Juliusson, Department of Hematology, Skåne University Hospital, S-221 85 Lund, Sweden; e-mail: gunnar.juliusson@med.lu.se.
Appendix: group members
The Swedish AML Group currently consists of Petar Antunovic (Linköping, Sweden), Jörg Cammenga (Linköping, Sweden), Stefan Deneberg (Stockholm, Sweden), Anna Eriksson (Uppsala, Sweden), Martin Höglund (chairman; Uppsala, Sweden), Gunnar Juliusson (registry chairman; Lund, Sweden), Martin Jädersten (Stockholm, Sweden), Vladimir Lazarevic (secretary; Lund, Sweden), Sören Lehmann (Uppsala, Sweden), Stig Lenhoff (stem cell transplantation; Lund, Sweden), Fryderyk Lorenz (Umeå, Sweden), Lars Möllgård (Göteborg, Sweden), Gustav Orrsjö (Göteborg, Sweden), Bertil Uggla (Örebro, Sweden), Lovisa Wennström (Göteborg, Sweden), and Emma Ölander (Sundsvall, Sweden).

