

Key Points
PML reduces ROS but stimulates metabolism and ELANE expression in iPSC-derived CD34+CD45+ cells from ELANE-SCN with NE misfolding mutations.
PML dampens granulocyte colony-stimulating factor responsiveness in a CSF3 therapy-refractory case of ELANE-SCN.

Abstract
Mutations in ELANE cause severe congenital neutropenia (SCN), but how they affect neutrophil production and contribute to leukemia predisposition is unknown. Neutropenia is alleviated by CSF3 (granulocyte colony-stimulating factor) therapy in most cases, but dose requirements vary between patients. Here, we show that CD34+CD45+ hematopoietic progenitor cells (HPCs) derived from induced pluripotent stem cell lines from patients with SCN that have mutations in ELANE (n = 2) or HAX1 (n = 1) display elevated levels of reactive oxygen species (ROS) relative to normal iPSC-derived HPCs. In patients with ELANE mutations causing misfolding of the neutrophil elastase (NE) protein, HPCs contained elevated numbers of promyelocyte leukemia protein nuclear bodies, a hallmark of acute oxidative stress. This was confirmed in primary bone marrow cells from 3 additional patients with ELANE-mutant SCN. Apart from responding to elevated ROS levels, PML controlled the metabolic state of these ELANE-mutant HPCs as well as the expression of ELANE, suggestive of a feed-forward mechanism of disease development. Both PML deletion and correction of the ELANE mutation restored CSF3 responses of these ELANE-mutant HPCs. These findings suggest that PML plays a crucial role in the disease course of ELANE-SCN characterized by NE misfolding, with potential implications for CSF3 therapy.
Introduction
Severe congenital neutropenia (SCN) is a genetically heterogeneous disease that, when left untreated, leads to life-threatening bacterial infections from the lack of neutrophils.1 Autosomal dominant or sporadic mutations in ELANE, the gene encoding neutrophil elastase (NE), are the most frequent cause of SCN, whereas mutations in HAX1, encoding a multifunctional protein associated with mitochondrial integrity and cytoskeleton organization, are responsible for the autosomal recessive form of SCN originally described as Kostmann syndrome.2,3 Most patients with SCN receive life-long therapy with colony-stimulating factor 3 (CSF3/granulocyte colony-stimulating factor [G-CSF]) to alleviate the neutrophilic differentiation block. Although the majority of patients respond favorably to relatively modest dosages of CSF3 (5-10 μg/kg per day), others need more excessive dosages (>50-100 μg/kg per day) to reach clinically beneficial neutrophil levels, whereas some patients fail to respond to CSF3 therapy altogether.4 Patients with SCN have an increased risk of developing myelodysplastic syndrome (MDS) or acute myeloid leukemia (AML) while under CSF3 treatment. This particularly applies to patients needing high CSF3 dosages to alleviate neutropenia.5,6
How ELANE, HAX1, and other mutations causing SCN affect neutrophil production is still largely unknown. A prevailing hypothesis is that cellular stresses, in ELANE-SCN caused by NE protein misfolding and in HAX1-SCN by mitochondrial leakage, are drivers of the neutropenia.3,7,8 However, the wide spectrum of ELANE mutations found in SCN are not all predicted to cause NE misfolding; therefore, alternative mechanisms of how ELANE mutations cause neutropenia have been proposed.9-11 This heterogeneity of mutations may explain the variability in CSF3 responses seen in patients and possibly also determine leukemia risk.4,5,9
The promyelocytic leukemia protein (PML), originally identified as a fusion partner in a chromosomal translocation causing acute promyelocytic leukemia, has been studied extensively for its role in controlling cell cycle, DNA damage, and inflammation.12-17 Particularly, these studies dealt with the role of PML nuclear bodies (PML-NBs), hollow spherical structures that contain a plethora of regulatory molecules controlling the previously mentioned processes. Moreover, PML-NBs have been implicated in degrading misfolded proteins by a mechanism not involving the canonical unfolded protein response (UPR) signaling pathways.18 Finally, PML plays an important role in how cells deal with oxidative stress caused by reactive oxygen species (ROS).19 Whereas nuclear factor erythroid 2-related factor 2 (NRF2) transcriptionally activates antioxidant pathways at relatively low levels of ROS, this role can be taken over by PML upon the acute generation of excess ROS (eg, induced by exposure of cells to arsenic trioxide [As2O3] or irradiation).19
To investigate the involvement of PML in SCN, we created patient- and control-derived induced pluripotent stem cells (iPSCs) and generated CD34+CD45+ hematopoietic progenitor cells (HPCs) from these lines. We show that PML-NBs are elevated in SCN-HPCs with predicted NE misfolding mutations and that PML deletion reduces the metabolic activity and partly restores CSF3 responses of these cells. In addition, we show that loss of PML reduces the levels of mutant ELANE transcript and NE protein, indicating that PML may aggravate the SCN phenotype through a feed-forward mechanism.
Materials and methods
Patient samples
Ficoll-gradient separated bone marrow (BM) and blood cells were obtained and frozen according to established procedures for viable cell cryopreservation. The study was performed under the permission of the institutional review boards of the Erasmus Medical Center.
Generation of iPSC
BM fibroblasts cultured from patients with SCN harboring ELANE mutation p.I60F (NC_000019.10:g.852986A>T), ELANE mutation p.R103L (NC_000019.10:g.853345G>T), or HAX1 mutation p.W44X (NC_000001.11:g.154273412_154273413insA), and from a healthy control BM were reprogrammed, as described previously.20 Cells were cultured in mTeSR1 (STEMCELL Technologies) on Geltrex LDEV-Free Reduced Growth Factor Basement Membrane Matrix (Thermo Fisher Scientific) and were regularly checked for pluripotency, correct karyotype and their ability to generate hematopoietic progenitor cells and mature neutrophils.
CRISPR/Cas9-mediated genome editing
CRISPR/Cas9-mediated genome editing was used to create PML−/− iPSCs, where a stop codon was introduced in exon 3, or correct the ELANE-I60F mutation. In short, 2 ×10⁶ iPSCs were transfected by electroporation with 500 ng px330 (Cas9 plasmid, #42230 Addgene), containing a gene-specific guide RNA, and 1500 ng recombination template containing PML with a stop codon or ELANE wild-type sequence and a neomycin selection cassette, using the 4D-Nucleofector System (Lonza), program CA-137. G418 selection (50 µg/mL) started 48 hours after electroporation. Single clones were picked and screened for homozygous integration of the stop codon and absence of PML protein, or correct integration of the wild-type ELANE sequence in the ELANE-I60F mutant allele. All clones were checked for retainment of pluripotency.
Hematopoietic induction
HPCs (CD34+CD45+) were produced with the STEMdiff Hematopoietic Kit (STEMCELL Technologies) according to the manufacturer’s protocol. Suspension cells were harvested at day 12 of the protocol and used for further downstream analysis.
Neutrophil differentiation
To expand myeloid progenitors and subsequently differentiate them into mature neutrophils, suspension cells, harvested at day 12 of the hematopoietic induction protocol, were treated as described previously.21 In short, 105 cells/mL were plated in a nontissue culture-treated plate in Iscove modified Dulbecco medium (Life Technologies) complemented with 10% defined fetal bovine serum (Hyclone), 10 ng/mL interleukin 3 (IL-3; R&D Systems), 10 ng/mL granulocyte-macrophage colony-stimulating factor (Peprotech), 50 ng/mL stem cell factor (CellGenix GmbH), and 50 ng/mL CSF3 (Filgastrim; Zarzio). After 4 days, medium was switched to Iscove modified Dulbecco medium complemented with 10% defined fetal bovine serum and 50 ng/mL CSF3. Cells were harvested 5 days later and used for subsequent fluorescence-activated cell sorting (FACS) analysis with the EuroFlow AML tube 1, as described previously.22,23
Magnetic-activated cell sorting purification and immunofluorescence stainings
Suspension cells expressing CD45 were enriched using CD45 Microbeads (Miltenyi Biotec) and subsequent magnetic-activated cell sorting separation according to the manufacturer’s protocol. Cells were attached to glass slides with Cytospin 4 and fixed in 4% paraformaldehyde (Polysciences) on ice for 20 minutes. Cells were washed with phosphate-buffered saline (PBS) and the primary antibodies (PML 1:1000, #M041-3 MBL, and NRF2 1:200, #ab31163 Abcam) were incubated overnight at 4°C in 0.05% Saponin (diluted in PBS; Merck). After washing 3 × 5 minutes in 0.05% Saponin, cells were incubated with the secondary antibodies (goat anti mouse Alexa Fluor 488, 1:200 Life or donkey anti rabbit Cy3 1:800, Bio-Connect) for 1 hour at 37°C. Cells were then washed 3 × 5 minutes in 0.05% Saponin and 2 × 5 minutes in PBS after which Hoechst 34580 (1:3000; Merck) was added for 10 minutes. Slides were mounted with ProLong Diamond Antifade Mountant (Merck) and imaged on a SP5 or SP8 confocal microscope (Leica). Quantifications were performed using Fiji software.24
Seahorse assay
The Agilent Seahorse XFe24 Cell Culture microplate (Agilent) was coated with 22.4 µg/mL Cell-Tak Cell and Tissue Adhesive (Corning) for 20 minutes at room temperature. Suspension cells, obtained after 12 days of hematopoietic induction, were harvested and subsequently live cells were sorted using 7AAD. Sorted live cells (1.25 × 10⁵ per well) were added to the coated microplate and centrifuged for 5 minutes at 200g to form a monolayer of cells at the bottom of the well. Cell numbers and oligomycin, carbonyl cyanide-p-trifluoromethoxyphenylhydrazone, and antimycin concentrations (all 1.0 µM) were determined after optimalization. Per condition, 5 wells were used for the Seahorse Mitochondrial Stress Test, which was performed according to the manufacturer’s instructions and measured on a XFe24 analyzer. Data were analyzed with the Seahorse Wave Desktop Software (Agilent).
Colony-forming unit assays
ELANE-I60F patient BM cells (4 × 10⁴/mL) or BM cells derived from a healthy control were seeded in triplicate for colony formation in methylcellulose (H4230, STEMCELL Technologies) with increasing concentrations of CSF3 (0, 1, 3.33, 10, 33.3, 100 ng/mL). Colonies were counted after 14 days of culture. A similar protocol was used for the iPSC-derived HPCs, where suspension cells were harvested after 12 days of hematopoietic differentiation and seeded (1 × 10⁴/mL) in colony cultures with CSF3 concentrations as described previously.
RNA isolation and RNA sequencing
RNA was isolated from CD34+CD45+ HPCs using TRIzol (Thermo Fisher Scientific) and GenElute-LPA (Sigma-Aldrich) according to the manufacturer’s protocol. Complementary DNA was generated with version 4 of the SMARTer Ultra Low Input RNA Kit for sequencing (Clontech). Sequencing libraries were generated using the TruSeq Nano DNA Sample Preparation Kit (Illumina), according to the low sample protocol and run on HiSeq 2500 or Novaseq 6000 instruments (Illumina).
Bioinformatics and statistics
Demultiplexing was performed using the CASAVA software (Illumina) allowing for 1 mismatch in the barcodes. Subsequently, SMARTer adapters and poly-A tails were removed (fqtrim; https://ccb.jhu.edu/software/fqtrim/) and quality metrics were estimated (FastQC, Babraham Bioinformatics and MultiQC; http://multiqc.info) for all of the resulting fastq files. Reads were then aligned against the Human Transcriptome (Gencode v19)/Genome (hg19) using the STAR aligner.25 Abundance estimation was performed using Cufflinks (refSeq26 ), and raw counts were measured with the HTSeq-count software set in union mode.27 Next, the measured raw counts were used to create clustering and principal component plots and to perform differential expression analysis using a combination of DESeq228 and R (https://www.r-project.org/). Finally, gene set enrichment analysis (GSEA) on the curated gene sets C2 and the hallmark pathways H was done using the GSEA software based on the preranked ASHR log2 fold change, where a false discovery rate <0.05 was considered significant.29,30 Transcripts per million (TPM) were calculated using StringTie.31
Quantification and statistical analysis
Data are presented as mean ± standard error of the mean. Comparison of 2 groups was performed using an unpaired Student t test. Statistical analyses were performed using GraphPad Prism 8.0 (GraphPad Software) or DESeq2. A value of P < .05 was considered significant.
Results
Elevated ROS levels and activation of the NRF2 antioxidant pathway in SCN-iPSC-derived HPCs
Both mutations in ELANE and HAX1 have been reported to cause increased ROS levels in promyelocytes,3,7,10,11,32 but whether more immature myeloid precursors of patients with SCN already experience oxidative stress because of elevated ROS has not previously been addressed. CellROX Deep Red analysis of HPCs derived from SCN-iPSCs with different mutations (ELANE-R103L [NC_000019.10:g.853345G>T], ELANE-I60F [NC_000019.10:g.852986A>T], and HAX1-W44X [NC_000001.11:g.154273412_154273413insA]) showed higher levels of ROS in SCN-HPCs compared with normal control HPCs (Figure 1A). Indicative of elevated ROS levels, NRF2, the master redox regulator,33 was translocated to the nucleus and subsequently upregulated GSR, encoding the antioxidant enzyme glutathione reductase (Figure 1B-C).
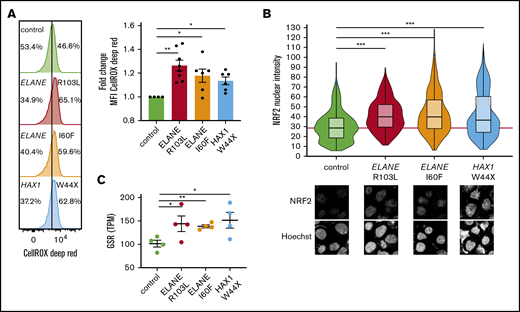
SCN-iPSC-derived CD34+CD45+cells show elevated ROS levels and increased nuclear translocation of NRF2. (A) Representative FACS histograms and quantifications of mean fluorescent intensities (MFI) showing increased levels of CellROX Deep Red in SCN HPCs. Data are from 3 independent experiments on 2 clones per genotype. (B) Quantification of the nuclear translocation of NRF2 by immunofluorescence stainings of HPCs showing increased nuclear NRF2 levels in SCN HPCs. The red line indicates the median NRF2 nuclear intensity for the control HPCs. Data are pooled from 2 independent clones and 5 independent experiments. Total cells analyzed: control, n = 765; ELANE-R103L, n = 721; ELANE-I60F, n = 677; HAX1-W44X, n = 574. (C) Expression of the antioxidant glutathione reductase (GSR) in TPM obtained from 2 different iPSC clones and 2 independent experiments. *P < .05, **P < .01, ***P < .001.
SCN-iPSC-derived CD34+CD45+cells show elevated ROS levels and increased nuclear translocation of NRF2. (A) Representative FACS histograms and quantifications of mean fluorescent intensities (MFI) showing increased levels of CellROX Deep Red in SCN HPCs. Data are from 3 independent experiments on 2 clones per genotype. (B) Quantification of the nuclear translocation of NRF2 by immunofluorescence stainings of HPCs showing increased nuclear NRF2 levels in SCN HPCs. The red line indicates the median NRF2 nuclear intensity for the control HPCs. Data are pooled from 2 independent clones and 5 independent experiments. Total cells analyzed: control, n = 765; ELANE-R103L, n = 721; ELANE-I60F, n = 677; HAX1-W44X, n = 574. (C) Expression of the antioxidant glutathione reductase (GSR) in TPM obtained from 2 different iPSC clones and 2 independent experiments. *P < .05, **P < .01, ***P < .001.
Accumulation of PML-NBs in ELANE-SCN HPCs with predicted NE-misfolding mutations
PML-NBs are formed on acute generation of excessive oxidative stress to neutralize the effects of ROS that are not being coped with by the NRF2 antioxidant pathway.19 Accordingly, the number of PML-NBs significantly increased after incubation of control HPCs with As2O3, which induces excessive oxidative stress (supplemental Figure 1A-B). In ELANE-I60F HPCs, higher numbers of PML-NBs were found relative to controls in the absence of As2O3, which was not seen in ELANE-R103L or HAX1-W44X HPCs (Figure 2A). Incubation with the antioxidant N-acetylcysteine significantly reduced ROS levels and the number of PML-NBs in ELANE-I60F cells, corroborating that in ELANE-I60F HPCs, PML-NBs were elevated by endogenous oxidative stress (supplemental Figure 1C-D). Comparison of the predicted structural alterations (https://www3.cmbi.umcn.nl/hope/)34 caused by the ELANE mutations showed that the ELANE-R103L mutation alters a positively charged amino acid (R) into a smaller neutral amino acid (L) at the surface of the protein, thereby possibly affecting interactions with other molecules (Figure 2B). In contrast, the ELANE-I60F alteration causes a structural change in the core of the protein, by introducing a bulky amino acid, that predicts protein misfolding (Figure 2B). To exclude that the increased numbers of PML-NBs was a feature of iPSC-derived, rather than bona fide BM-derived HPCs, we quantified PML-NBs in CD34+ cells from primary SCN BM samples. These analyses confirmed that PML-NBs are increased in ELANE-I60F HPCs relative to controls (Figure 2C). Importantly, this was also seen in HPCs from a second patient with SCN with a misfolding mutation (p.P139L NC_000019.10:g. 855614C>T), but not in HPCs from 2 patients with ELANE-SCN that have mutations (p.I120T NC_000019.10:g. 853396T>C, p.S204TfsX11 NC_000019.10:g. 855962_855969dup) not predicting NE misfolding (Figure 2D).
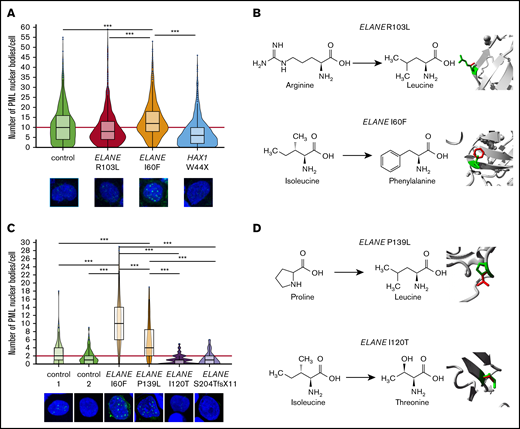
Increased numbers of PML-NBs in ELANE-SCN HPCs with predicted NE-misfolding mutations. (A) Quantifications of the number of PML-NBs per cell, by immunofluorescence stainings, shows increased numbers of PML-NBs in ELANE-I60F derived HPCs (data are pooled from 2 independent clones, 5 independent experiments, and 2 different stainings resulting in control, n = 1119; ELANE-R103L, n = 720; ELANE-I60F, n = 732; HAX1-W44X, n = 914, where n = the number of cells). The red line indicates the median number of PML-NBs/cell for the control HPCs. (B) Amino acid alterations of the ELANE-R103L and ELANE-I60F mutations, with a closeup of the mutation in ribbon-presentation. The wild-type amino acid is depicted in green and the mutant in red. (C) Quantifications of the number of PML-NBs in CD34+ bone marrow cells, showing increased numbers of PML-NBs in ELANE-mutant HPCs with predicted NE misfolding (I60F and P139L). The red line indicates the median number of PML-NBs/cell for the control HPCs. Cells analyzed: control 1, n = 89; control 2, n = 127; ELANE-I60F, n = 79; ELANE-P139L, n = 63; ELANE-I120T, n = 103; and ELANE-S204TfsX11 n = 74. (D) Amino acid alterations of the ELANE-P139L and ELANE-I120T mutations, depicted as outlined under panel B. ***P < .001.
Increased numbers of PML-NBs in ELANE-SCN HPCs with predicted NE-misfolding mutations. (A) Quantifications of the number of PML-NBs per cell, by immunofluorescence stainings, shows increased numbers of PML-NBs in ELANE-I60F derived HPCs (data are pooled from 2 independent clones, 5 independent experiments, and 2 different stainings resulting in control, n = 1119; ELANE-R103L, n = 720; ELANE-I60F, n = 732; HAX1-W44X, n = 914, where n = the number of cells). The red line indicates the median number of PML-NBs/cell for the control HPCs. (B) Amino acid alterations of the ELANE-R103L and ELANE-I60F mutations, with a closeup of the mutation in ribbon-presentation. The wild-type amino acid is depicted in green and the mutant in red. (C) Quantifications of the number of PML-NBs in CD34+ bone marrow cells, showing increased numbers of PML-NBs in ELANE-mutant HPCs with predicted NE misfolding (I60F and P139L). The red line indicates the median number of PML-NBs/cell for the control HPCs. Cells analyzed: control 1, n = 89; control 2, n = 127; ELANE-I60F, n = 79; ELANE-P139L, n = 63; ELANE-I120T, n = 103; and ELANE-S204TfsX11 n = 74. (D) Amino acid alterations of the ELANE-P139L and ELANE-I120T mutations, depicted as outlined under panel B. ***P < .001.
PML knockout induces NRF2 nuclear translocation in ELANE-I60F HPCs
Because NRF2 and PML-NBs both neutralize ROS levels, we wondered to what extent deletion of PML in the ELANE-I60F and control HPCs affected NRF2 activation. Disruption of PML expression by introducing a stop codon in exon 3 (supplemental Figure 2A-B) resulted in the complete absence of PML-NBs (Figure 3A), but did not affect the generation of HPCs (supplemental Figure 2C-D). ELANE-I60F PML−/− HPCs showed significantly increased nuclear translocation of NRF2, confirming that PML-NBs reduced ROS levels, leading to lower NRF2 activation (Figure 3B). No major differences in total ROS levels were seen between PML proficient and deficient ELANE-I60F HPCs, indicating that NRF2, possibly in combination with other antioxidant pathways, compensated for the loss of PML (Figure 3C). In addition, As2O3 treatment of ELANE-R103L cells, which previously did not show increased numbers of PML-NBs but did show increased ROS levels and NRF2 translocation (Figures 1 and 2A), resulted in increased numbers of PML-NBs but not in increased ROS levels (supplemental Figure 1E-F), further strengthening the observation that both PML-NBs and NRF2 control ROS levels. No significant differences in nuclear NRF2 were seen between PML proficient and deficient control HPCs, consistent with earlier work showing that, under physiological ROS conditions, PML-NBs do not play a major role in governing antioxidant responses (Figure 3D).19
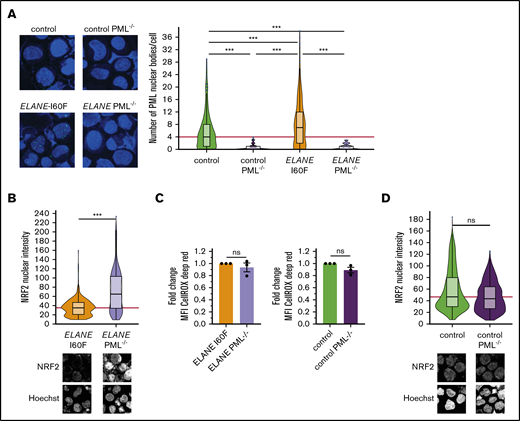
PML acts as a ROS sensor in ELANE-I60F HPCs. (A) Representative immunofluorescent image showing complete loss of PML-NBs after introduction of a stop codon in exon 3 of the PML gene and subsequent PML-NB quantification. The red line indicates the median number of PML-NBs/cell for the control HPCs. Number of cells analyzed (n): control, n = 441; control PML−/−, n = 175; ELANE-I60F, n = 353; ELANE-I60F PML−/−, n = 172. (B,D) Quantifications of immunofluorescent images showing increased nuclear NRF2 levels in ELANE-I60F PML-deficient HPCs (B), but not in control (D). Data are pooled from 3 independent experiments (ELANE-I60F, n = 365; ELANE(-I60F) PML−/−, n = 370; control, n = 631; control PML−/−, n = 644, where n = the number of cells). The red line indicates the median number of NRF2 nuclear intensity for the PML-proficient HPCs. Microscope settings (laser power) differed between figures. (C) Relative quantification of the mean fluorescent intensity (MFI) showing no increased CellROX Deep Red levels after PML knockout, where PML-proficient cells (ELANE-I60F or control) were used as baseline. Data are from 3 independent experiments. ***P < .001.
PML acts as a ROS sensor in ELANE-I60F HPCs. (A) Representative immunofluorescent image showing complete loss of PML-NBs after introduction of a stop codon in exon 3 of the PML gene and subsequent PML-NB quantification. The red line indicates the median number of PML-NBs/cell for the control HPCs. Number of cells analyzed (n): control, n = 441; control PML−/−, n = 175; ELANE-I60F, n = 353; ELANE-I60F PML−/−, n = 172. (B,D) Quantifications of immunofluorescent images showing increased nuclear NRF2 levels in ELANE-I60F PML-deficient HPCs (B), but not in control (D). Data are pooled from 3 independent experiments (ELANE-I60F, n = 365; ELANE(-I60F) PML−/−, n = 370; control, n = 631; control PML−/−, n = 644, where n = the number of cells). The red line indicates the median number of NRF2 nuclear intensity for the PML-proficient HPCs. Microscope settings (laser power) differed between figures. (C) Relative quantification of the mean fluorescent intensity (MFI) showing no increased CellROX Deep Red levels after PML knockout, where PML-proficient cells (ELANE-I60F or control) were used as baseline. Data are from 3 independent experiments. ***P < .001.
SCN mutations result in distinct transcriptional profiles in HPCs
To further study how ELANE and HAX1 mutations affect cellular responses of HPCs, we performed RNA sequencing on FACS purified CD34+CD45+ cells derived from 2 different iPSC clones, stemming from 2 independent hematopoietic induction experiments for each genotype. Principal component analysis of these transcriptome data showed distinct clustering for each SCN subtype and controls (supplemental Figure 3A). The homozygous HAX1-W44X mutation is predicted to activate nonsense-mediated messenger RNA decay.35 This was confirmed by GSEA, which showed strongly elevated nonsense-mediated messenger RNA decay–related transcripts in these HAX1 mutant HPCs, but not in the ELANE mutant subtypes (supplemental Figure 3B; data not shown). In line with the fact that loss of HAX1 results in mitochondrial leakage,3 MitoTracker Red CM-H2XRos and TMRM stainings showed reduced mitochondrial membrane potential in HAX1 mutant HPCs (supplemental Figure 3C). Surprisingly, no upregulation of transcripts linked to the canonical unfolded protein response (UPR) pathway in ELANE-I60F HPCs was seen, as would be predicted from a mutation leading to protein misfolding (supplemental Figure 3D-E). Transcriptome analysis on more mature myeloid cells derived from these HPCs, by culturing the cells in the presence of CSF3, did not show upregulation of classical UPR-related genes and pathways (supplemental Figure 3F-H). Because PML-NBs have also been shown to control degradation of misfolded proteins, independent of the canonical UPR,18 these data suggest that a PML-dependent mechanism, rather than the classical UPR, controlled levels of misfolded NE in the ELANE-I60F HPCs.
PML activates metabolic pathways in ELANE-I60F HPCs
To assess which additional intracellular processes are controlled by PML, we compared the transcriptomes from HPCs generated from PML-proficient and PML-deficient ELANE-I60F and control iPSC lines. Deletion of PML reduced MYC and mTORC1-induced transcription in HPCs from ELANE-I60F, but not control HPCs, suggesting that PML drives metabolic pathways in these ELANE mutant HPCs (Figure 4A). Oxygen consumption assays showed that PML enhanced basal and maximal respiration as well as adenosine triphosphate (ATP) production in ELANE-I60F, which was not seen in control HPCs (Figure 4B). In addition, transcriptional signatures indicated that PML activated cell cycling of ELANE-I60F HPCs, which translated into a moderately elevated fraction of cells in S-phase, whereas this was not seen in control HPCs (supplemental Figure 4A-B).
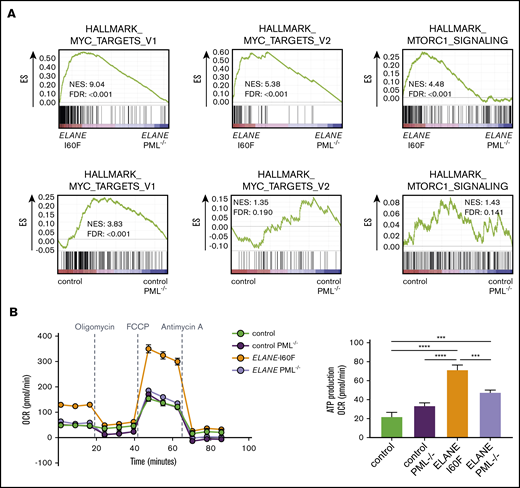
PML activates metabolic pathways in ELANE-I60F HPCs. (A) GSEA comparing PML proficient and deficient cells showing that PML induces MYC and mTORC1 signaling in ELANE-I60F, but not in control HPCs. Data are derived from 3 independent experiments. (B) Oxygen consumption rate (OCR) measured with the Seahorse mitochondrial stress test (Agilent) showing PML-dependent increases in basal respiration, ATP, and maximum respiration in ELANE-I60F cells (n = 5). FDR, false discovery rate; NES, normalized enrichment score. ***P < .001, ****P < .0001.
PML activates metabolic pathways in ELANE-I60F HPCs. (A) GSEA comparing PML proficient and deficient cells showing that PML induces MYC and mTORC1 signaling in ELANE-I60F, but not in control HPCs. Data are derived from 3 independent experiments. (B) Oxygen consumption rate (OCR) measured with the Seahorse mitochondrial stress test (Agilent) showing PML-dependent increases in basal respiration, ATP, and maximum respiration in ELANE-I60F cells (n = 5). FDR, false discovery rate; NES, normalized enrichment score. ***P < .001, ****P < .0001.
PML induces expression of ELANE-I60F
Transcriptome analysis further showed that ELANE was highly expressed in ELANE-I60F HPCs, relative to controls, whereas this increase in transcript levels was not observed in ELANE-R103L and HAX1-W44X HPCs (Figure 5A). Both wild-type and mutant transcripts could be detected in an approximately equal ratio in ELANE-I60F HPCs (supplemental Figure 5A). PML knockout significantly reduced transcription of both the normal and mutant alleles in the ELANE-I60F HPCs (Figure 5B; supplemental Figure 5A), implying that PML drives the expression of ELANE-I60F and thereby exacerbates the disease phenotype. Extending this observation to protein levels, NE was detected at significantly higher levels in ELANE-I60F HPCs cells compared with control (Figure 5C). In both ELANE-I60F and control PML−/− HPCs, NE levels were strongly reduced, thus confirming the critical role of PML in ELANE expression in HPCs (Figure 5C). To exclude that this was a unique feature of the ELANE-I60F mutation in iPSC-derived HPCs, we analyzed NE expression in the CD34+ HPCs from the primary BM samples shown in Figure 2C. In addition to the elevated formation of PML-NBs, NE protein levels were higher in the HPCs from patients with SCN with the NE-misfolding mutations (I60F and P139L) than in those from patients with other ELANE mutations or control HPCs (Figure 5D).
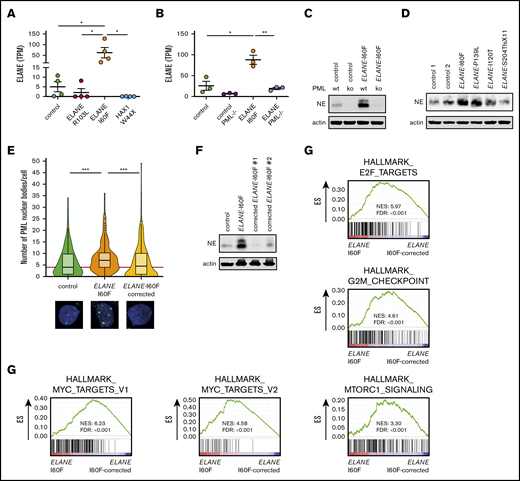
PML induces expression of ELANE-I60F. (A-B) Expression of ELANE in TPM showing upregulated expression in ELANE-I60F, but not ELANE-R103L and HAX1-W44X (data are derived from 2 independent clones and 2 independent experiments) (A), and increased levels of ELANE messenger RNA in ELANE-I60F HPCs, which is reduced to control levels when PML is absent (n = 3 independent experiments) (B). (C) Immunoblot showing PML-dependent NE protein abundance, with increased levels in ELANE-I60F cells. (D) Immunoblot of patient BM cells showing increased NE protein abundance in ELANE-mutant cells with predicted NE misfolding (I60F and P139L), but not others (I120T and S204TfsX11). (E) Quantification of immunofluorescence images showing increased, ELANE-I60F–driven numbers of PML-NBs. Data are pooled from 3 independent experiments and 3 independent ELANE-I60F–corrected clones resulting in; control: n = 126; ELANE-I60F: n = 144; ELANE-I60F corrected n = 442, where n = the number of cells. The red line indicates the median number of PML-NBs/cell for the control HPCs. (F) Immunoblot showing increased NE protein abundance in ELANE-I60F cells, which is reduced to control levels upon correction of the mutation, as shown in 2 independent clones. (G) GSEA comparing ELANE-I60F HPCs with corrected ELANE-I60F HPCs (2 independent experiments and 3 independent corrected clones) showing increased MYC, mTORC1, and cell cycle–related signatures in ELANE-I60F HPCs. ELANE PML−/−, ELANE-I60F PML−/−. *P < .05, **P < .01, ***P < .001.
PML induces expression of ELANE-I60F. (A-B) Expression of ELANE in TPM showing upregulated expression in ELANE-I60F, but not ELANE-R103L and HAX1-W44X (data are derived from 2 independent clones and 2 independent experiments) (A), and increased levels of ELANE messenger RNA in ELANE-I60F HPCs, which is reduced to control levels when PML is absent (n = 3 independent experiments) (B). (C) Immunoblot showing PML-dependent NE protein abundance, with increased levels in ELANE-I60F cells. (D) Immunoblot of patient BM cells showing increased NE protein abundance in ELANE-mutant cells with predicted NE misfolding (I60F and P139L), but not others (I120T and S204TfsX11). (E) Quantification of immunofluorescence images showing increased, ELANE-I60F–driven numbers of PML-NBs. Data are pooled from 3 independent experiments and 3 independent ELANE-I60F–corrected clones resulting in; control: n = 126; ELANE-I60F: n = 144; ELANE-I60F corrected n = 442, where n = the number of cells. The red line indicates the median number of PML-NBs/cell for the control HPCs. (F) Immunoblot showing increased NE protein abundance in ELANE-I60F cells, which is reduced to control levels upon correction of the mutation, as shown in 2 independent clones. (G) GSEA comparing ELANE-I60F HPCs with corrected ELANE-I60F HPCs (2 independent experiments and 3 independent corrected clones) showing increased MYC, mTORC1, and cell cycle–related signatures in ELANE-I60F HPCs. ELANE PML−/−, ELANE-I60F PML−/−. *P < .05, **P < .01, ***P < .001.
Correction of the ELANE-I60F mutation reverses the PML-mediated phenotype
To exclude that the increased formation of PML-NBs and higher expression of NE resulted from variations between the iPSC lines related to, for example, reprogramming or differences in (epi)genetic states of the lines, we corrected the ELANE-I60F mutation by CRISPR-Cas9 mediated genome editing in a fully isogenic setting (supplemental Figure 6). Immunofluorescent stainings showed that the numbers of PML-NBs in the corrected HPCs returned to basal levels (Figure 5E). Similarly, immunoblot analysis of 2 independent corrected clones showed that the increased NE levels in ELANE-I60F HPCs were reduced to control levels in corrected HPCs (Figure 5F). In line with PML-induced expression of metabolic and cell cycle–related pathways, GSEA showed significantly reduced expression of MYC targets, mTORC1 signaling, E2F targets, and G2M checkpoint in ELANE-I60F corrected lines (Figure 5G). These data establish that the increase in PML-NB formation, NE expression, and metabolic/cell cycle–related transcripts in ELANE-I60F HPCs were solely caused by the I60F amino acid alteration.
PML inhibits the CSF3 response of ELANE-I60F myeloid progenitors
The patient with SCN from whom the ELANE-I60F iPSC line was derived showed a poor clinical response to CSF3, where treatment with an excessive dosage of 60 to 70 μg/kg CSF3 resulted in only a modest increase in mature granulocytes. This was confirmed in granulocyte colony-forming unit (CFU-G) colony assays with titrated dosages of CSF3, showing that, although BM cells from the patient with HAX1-W44X SCN and 2 healthy controls show a dosage dependent increase in colony formation, the ELANE-I60F CFUs did not respond to CSF3 dosages exceeding 100 ng/mL (Figure 6A). Notably, colony formation in the presence of a myeloid cytokine cocktail consisting of IL-3, granulocyte-macrophage colony-stimulating factor, and CSF3 was within the normal range (ie, 127 colonies per 105 Ficoll-purified BM cells plated, where the normal reference of control BM cells in our laboratory is between 90 and 800 colonies per 105 cells). Thus, the lack of CSF3 response was not caused by a loss of myeloid progenitors per se. Similar CSF3 titration experiments showed that ELANE-I60F iPSC-derived HPCs were hyporesponsive to increasing dosages of CSF3 in CFU-G assays, which was restored after correction of the mutation (Figure 6B). A comparable restoration of the CSF3 response was seen in PML-deficient ELANE-I60F HPCs. Flow cytometric analysis of CD11b expression, a marker for myeloid differentiation, showed that ELANE-I60F HPCs produced significantly less CD11b+ cells relative to control, upon switching to CSF3-containing suspension cultures, consistent with a reduced response to CSF3. In agreement with the inhibitory effects of PML seen in colony assays, PML deletion almost completely restored the percentage of cells expressing CD11b (Figure 6C, left). Additionally, although significantly increased numbers of CD117+ immature myeloid cells (myeloblasts/promyelocytes) remained present in the ELANE-I60F cultures compared with control cells, this fraction decreased upon deletion of PML (Figure 6C, right). Corroborating these findings, cytologic analysis showed that ELANE PML−/− and ELANE-I60F gene-corrected cells differentiated toward mature neutrophils in these cultures, whereas ELANE-I60F cells mainly accumulated in more immature stages of myeloid differentiation (Figure 6D). Taken together, these data imply that PML contributes to the poor CSF3 response and decreased neutrophil differentiation seen in this patient with SCN.
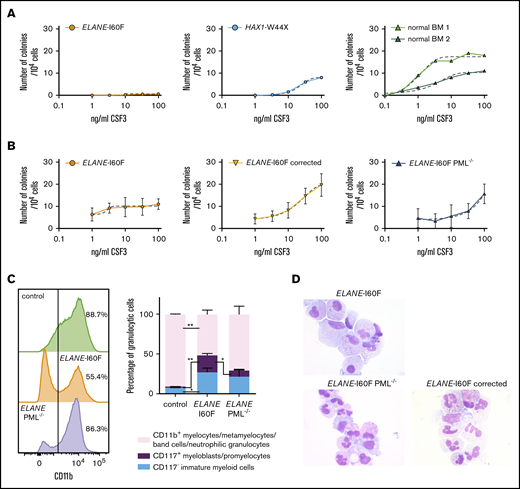
PML inhibits the CSF3 response of ELANE-I60F HPCs. (A) CFU-G assays on ELANE-I60F bone marrow cells showing a very limited CSF3 response with increasing dosages of CSF3, where HAX1-W44X and normal bone marrow cells show a CSF3-induced increase in colony formation. (B) CFU-G assays on iPSC-derived HPCs showing a similar hyporesponsiveness in ELANE-I60F cells, which is restored upon correction of the mutation and partly restored by the removal of PML (data are pooled from 3 independent experiments performed in triplicate). Dashed line indicates a nonlinear fitted curve. (C) Representative FACS histogram depicting CD11b expression (left) and subsequent quantifications of the myeloid cells present in CSF3-containing liquid culture (right; n = 3) showing an elevated ratio of immature vs mature myeloid cells in ELANE-I60F cells relative to controls, which was partly reverted to normal after PML knockout (ELANE PML−/−, ELANE-I60F PML−/−). *P < .05, **P < .01. (D) Representative May Grünwald-Giemsa–stained images of parental, PML-deficient, and corrected ELANE-I60F cells.
PML inhibits the CSF3 response of ELANE-I60F HPCs. (A) CFU-G assays on ELANE-I60F bone marrow cells showing a very limited CSF3 response with increasing dosages of CSF3, where HAX1-W44X and normal bone marrow cells show a CSF3-induced increase in colony formation. (B) CFU-G assays on iPSC-derived HPCs showing a similar hyporesponsiveness in ELANE-I60F cells, which is restored upon correction of the mutation and partly restored by the removal of PML (data are pooled from 3 independent experiments performed in triplicate). Dashed line indicates a nonlinear fitted curve. (C) Representative FACS histogram depicting CD11b expression (left) and subsequent quantifications of the myeloid cells present in CSF3-containing liquid culture (right; n = 3) showing an elevated ratio of immature vs mature myeloid cells in ELANE-I60F cells relative to controls, which was partly reverted to normal after PML knockout (ELANE PML−/−, ELANE-I60F PML−/−). *P < .05, **P < .01. (D) Representative May Grünwald-Giemsa–stained images of parental, PML-deficient, and corrected ELANE-I60F cells.
Discussion
By generating iPSC models, we addressed how CD34+CD45+ HPCs from patients with SCN are affected by mutations in ELANE or HAX1, with emphasis on the levels of oxidative stress. We showed that, although elevated ROS levels and activation of the NRF2 antioxidant pathway were detectable in all cases tested, increased PML-NB formation was seen in a subgroup of ELANE-SCN patients with mutations leading to NE protein misfolding. Elevated PML-NB formation is a characteristic of cells undergoing acute and more excessive oxidative stress than cells under more physiological conditions.19 The focus of this study was to unravel the function of PML in these cases.
Previous studies have shown that ELANE mutations evoke “classical” UPR responses in both mouse and human SCN models, likely caused by NE misfolding.11,36 However, in a more recent study, mutant ELANE failed to induce an UPR, even though the mutation predicted NE misfolding.37 A possible explanation for this discrepancy is that the wide spectrum of ELANE-mutations in patients with SCN differentially affect NE protein structure and folding.9,10 It is therefore not inconceivable that different structural changes might result in variable degrees of NE misfolding and consequently activate different (ie, canonical vs PML-mediated, UPR responses).
Our findings fit into a model (Figure 7) in which ELANE mutations that result in NE protein misfolding (eg, by insertion of a bulky amino acid in the core of the protein) induce an increased level of oxidative stress in CD34+CD45+ HPCs. As a consequence, PML-NBs are being formed, which not only act to reduce excessive ROS levels, but also stimulate metabolism and, to a lesser extent, proliferation of the HPCs. In addition, PML dampened the CSF3 responsiveness of ELANE-I60F HPCs in vitro, providing a possible explanation for the ineffective clinical CSF3 response in this patient. Finally, transcription of (mutant) ELANE and NE protein expression strongly depended on PML, suggestive of a PML-driven feed-forward loop aggravating the consequences of the NE misfolding mutation.
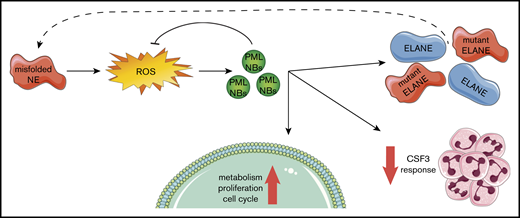
Graphical representation of the PML-mediated responses in ELANE-I60F HPCs.ELANE mutations with predicted NE misfolding result in excessive doses of ROS, inducing the formation of PML-NBs. PML-NBs are important for reducing ROS levels, while also inducing metabolism, proliferation, and cell cycling. In addition, PML reduces the response to CSF3 and induces the transcription of (mutant) ELANE, providing a feed-forward mechanism.
Graphical representation of the PML-mediated responses in ELANE-I60F HPCs.ELANE mutations with predicted NE misfolding result in excessive doses of ROS, inducing the formation of PML-NBs. PML-NBs are important for reducing ROS levels, while also inducing metabolism, proliferation, and cell cycling. In addition, PML reduces the response to CSF3 and induces the transcription of (mutant) ELANE, providing a feed-forward mechanism.
Even though a confirmation of the ELANE-I60F iPSC-derived data were obtained in primary CD34+ cells from this patient with SCN, as well as in a patient with SCN with another predicted misfolding mutation (ELANE-P139L), it still needs to be addressed to what extent cases of SCN with NE misfolding mutations other than ELANE-I60F and ELANE-P139L fit into the model shown in Figure 7. Keeping in mind that a large number of different ELANE mutations have been reported in both SCN and cyclic neutropenia (CyN), some of which overlap between the 2 conditions,9 additional unknown host factors must have an impact on disease characteristics, such as determining (1) cyclic vs severe neutropenia, (2) risk of leukemic transformation, and (3) response to CSF3 treatment and variations in doses.
Despite these limitations, we propose that SCN cases in which CD34+ cells accumulate increased numbers of PML-NBs because of specific ELANE mutations predicting NE-misfolding represent a distinct subgroup of patients with specific clinical features. First of all, as increased ROS levels lead to more severe oxidative damage, these patients may face a higher risk to develop MDS or AML than patients with lower levels of oxidative stress in their HPCs. This is in line with the fact that patients with SCN who do not respond well to CSF3 treatment have a much higher chance to progress to MDS or AML than good responders.5,6,38
The finding that PML enhanced MYC and mTORC1 signaling in ELANE-I60F HPCs, leading to increased metabolic and proliferative activity, supports the notion of increased potential for progression to leukemia.39,40 This appears in contrast with earlier studies showing that PML represses the AKT/mTOR pathway under hypoxic conditions in, for example, models of neoangiogenesis.41,42 Potential explanations for this discrepancy might relate to the fact that PML functions can be divergent depending on the oxidative state of cells (ie, hypoxic vs hyperoxic) or depend on the cell type or developmental stage of cells. In line with this, although PML has well-documented tumor suppressive functions, more recent evidence suggests that, depending on the cellular context, PML also has oncogenic properties.43,44 Further studies are needed to resolve this issue and also to elucidate how PML and upregulation of mTORC1 signaling are transcriptionally connected.
Finally, the observation that expression of NE levels in the ELANE-I60F HPCs strongly depended on PML is intriguing. RNA-sequencing data indicated that transcription of both wild-type and mutant ELANE alleles fully depended on the presence of PML. PML chromatin immunoprecipitation sequencing data from the PML-RARα zinc-inducible U937 cell line (UPR9) showed that PML binds to the promoter/enhancer region of ELANE,45 which could suggest that PML directly controls its transcription. Although suggestive of a PML-mediated feed-forward loop as illustrated by the dashed arrow in Figure 7, the possibility that mutant NE is, at least partly, degraded by a PML-driven mechanism should be taken into account, similar to the mechanism shown in a model of neurodegeneration.18
In summary, this study sheds further light on the complex and heterogeneous natural history of SCN and identified a subset of patients with ELANE-SCN characterized by the activation of PML-mediated responses of hematopoietic progenitors, which may ultimately help to design new strategies for disease management for these cases.
For original data, please contact i.touw@erasmusmc.nl.
Acknowledgments
The authors thank Tom Cupedo and Rebekka K. Schneider for valuable comments on the manuscript.
This work was supported by grants from KWF Kankerbestrijding (EMCR 2013-5755 and EMCR 2014-6780) and the Cancer Genome Editing Center of the Erasmus MC Cancer Institute funded by the Daniel den Hoed Foundation.
Authorship
Contribution: P.A.O. and I.P.T. conceptualized the study; P.A.O., D.A.B., and H.W.J.d.L. undertook methodology; P.A.O. and R.M.H. provided formal analysis; P.A.O., D.A.B., O.R., P.M.H.v.S., H.W.J.d.L., S.B., V.H.J.v.d.V., and E.M.J.B. investigated; M.G. provided resources; R.M.H. undertook data curation; P.A.O. and I.P.T. wrote the original draft; P.G.M., E.M.J.B., and E.M.d.P. reviewed and edited the writing; P.A.O. visualized the study; I.P.T. supervised; and I.P.T. acquired funding.
Conflict-of-interest disclosure: The authors declare no competing financial interests.
Correspondence: Ivo P. Touw, Department of Hematology, Erasmus University Medical Center, Wytermaweg 80, Rotterdam 3015 CN, The Netherlands; e-mail: i.touw@erasmusmc.nl.

