

Key Points
Attaining undetectable MRD after semi-intensive therapy or hypomethylating agents is prognostically relevant in older patients with AML.
CD34 progenitors in patients with undetectable MRD by MFC possess extensive genetic abnormalities, almost as much as leukemic MRD cells.

Abstract
The value of measurable residual disease (MRD) in elderly patients with acute myeloid leukemia (AML) is inconsistent between those treated with intensive vs hypomethylating drugs, and unknown after semi-intensive therapy. We investigated the role of MRD in refining complete remission (CR) and treatment duration in the phase 3 FLUGAZA clinical trial, which randomized 283 elderly AML patients to induction and consolidation with fludarabine plus cytarabine (FLUGA) vs 5-azacitidine. After consolidation, patients continued treatment if MRD was ≥0.01% or stopped if MRD was <0.01%, as assessed by multidimensional flow cytometry (MFC). On multivariate analysis including genetic risk and treatment arm, MRD status in patients achieving CR (N = 72) was the only independent prognostic factor for relapse-free survival (RFS) (HR, 3.45; P = .002). Achieving undetectable MRD significantly improved RFS of patients with adverse genetics (HR, 0.32; P = .013). Longer overall survival was observed in patients with undetectable MRD after induction though not after consolidation. Although leukemic cells from most patients displayed phenotypic aberrancies vs their normal counterpart (N = 259 of 265), CD34 progenitors from cases with undetectable MRD by MFC carried extensive genetic abnormalities identified by whole-exome sequencing. Interestingly, the number of genetic alterations significantly increased from diagnosis to MRD stages in patients treated with FLUGA vs 5-azacitidine (2.2-fold vs 1.1-fold; P = .001). This study supports MRD assessment to refine CR after semi-intensive therapy or hypomethylating agents, but unveils that improved sensitivity is warranted to individualize treatment and prolong survival of elderly AML patients achieving undetectable MRD.
Introduction
Acute myeloid leukemia (AML) is the most common acute leukemia in adults and its prevalence significantly increases in the elderly.1 The 5-year survival rate for adults younger than 60 years of age is ∼40% and decreases to 10% in patients above this age.2 This has been attributed to more frequent presence of adverse cytogenetics3 and comorbidities that commonly impact treatment decisions to minimize side effects.4 However, even those patients who tolerate intensive induction chemotherapy and achieve complete remission (CR) have poor outcome.1
Detection of measurable residual disease (MRD) refines outcome prediction of younger and elderly AML patients in CR after intensive chemotherapy.5 However, the role of MRD in elderly AML has been poorly investigated due to the reluctance of treating older patients with intensive chemotherapy, together with the renewed interest in low-intensity therapy such as hypomethylating agents (HMAs)6 that may induce a survival benefit in patients unable to achieve CR.7 That notwithstanding, new nonintensive approaches (ie, HMA or low-dose cytarabine combined with bcl-2 inhibitors) have increased the chances of achieving CR, some of which have been demonstrated to be MRD−.6,8-10 Furthermore, preemptive therapy with 5-azacitidine (AZA) was shown to prevent or substantially delay relapse in MRD+ AML patients.11 Herein, we investigated the role of MRD in refining CR and treatment duration of elderly AML patients treated with semi-intensive chemotherapy vs HMA in the context of a phase 3 randomized clinical trial with centralized MRD assessment.
Patients and methods
Patients
Two hundred eighty-three patients aged over 65 years with newly diagnosed AML (excluding those with acute promyelocytic leukemia according to World Health Organization [WHO] criteria12 ) and with an Eastern Cooperative Oncology Group performance status (PS) <4, were enrolled in the Programa para el Estudio de la Terapéutica en Hemopatías Malignas (PETHEMA) phase 3 FLUGAZA clinical trial. Exclusion criteria included prior treatment with HMAs or standard chemotherapy for AML secondary to myelodysplastic syndrome or myeloproliferative neoplasms, inadequate renal or hepatic function unless they were attributable to AML activity, and presence of other major coexisting illnesses (except in situ carcinoma or concomitant malignancy in CR for more than 1 year). All patients provided written informed consent, and the trial was approved by appropriate institutional review boards or ethics committees at all sites and the study was conducted according to the Declaration of Helsinki as amended in Fortaleza, Brazil and the Harmonization E6 Guidelines for Good Clinical Practice.
Treatment
Patients were randomized 1:1 to receive open-label treatment with either AZA or low-dose Ara-C plus fludarabine (FLUGA). The induction phase consisted of 3 cycles. Patients in the experimental arm received subcutaneous (s.c.) AZA in standard doses (75 mg/m2) on days 1 to 7 of each cycle (5-2-2 administration was allowed). Concomitant oral HU (0.5-1 g every 8 hours) was administered in addition to AZA when white blood cell counts (WBCs) were between 15 × 109/L and 50 × 109/L until leukocytes decreased to <15 × 109/L. Patients with WBC >50 × 109/L assigned to the AZA arm, received the FLUGA scheme instead of AZA in cycle 1. Patients in the control arm received Ara-C (75 mg/m2) by s.c. administration or 6-hour IV perfusion when they were outpatient or hospitalized, respectively, together with FLU, either oral at 40 mg/m2 if outpatient or IV at 25 mg/m2 if hospitalized, on days 2 to 6 (days 2 to 5 when they were ≥75 years old). Patients in this arm also received s.c. filgrastim (granulocyte-colony stimulating factor) (5 µg/kg) on days 1 to 3 except when WBC were >25 × 109/L. Cycles were repeated every 28 days. Criteria to receive treatment as inpatient included WBC >25 × 109/L, high risk of tumor lysis syndrome, coagulopathy or other serious uncontrolled complication. Patients in complete remission (CR), complete remission with incomplete blood count recovery (CRi), partial remission, hematology improvement or stable disease after induction continued with consolidation, which consisted of 6 cycles that also lasted for 28 days. In the experimental arm, the dose, way and days of administration of AZA were the same than those used during induction. In the control arm, daily doses and ways of administration of FLUGA were the same than those used during induction, but drugs were given only on days 1 and 2 of every cycle (mini-FLUGA). All patients could receive supportive care (transfusions, antimicrobial and antifungal agents) as per institutional standard practice. An allogeneic hematopoietic stem cell transplant was not indicated as part of the frontline strategy in this clinical trial.
At the end of the ninth cycle, patients in CR/CRi had bone marrow (BM) aspirates for assessment of MRD. Those with MRD levels ≥0.01% continued treatment (AZA or mini-FLUGA) until relapse or progressive disease were documented. Patients whose MRD levels were <0.01% suspended treatment and proceeded to follow-up (Figure 1). The main outcomes of the PETHEMA phase 3 FLUGAZA clinical trial are reported in an independent manuscript.
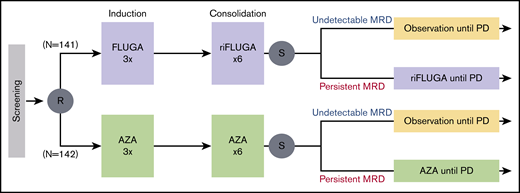
Scheme of the PETHEMA phase 3 FLUGAZA clinical trial. A total of 283 patients were accrued and 78 achieved complete response with or without incomplete blood count recovery (CR/CRi).
Scheme of the PETHEMA phase 3 FLUGAZA clinical trial. A total of 283 patients were accrued and 78 achieved complete response with or without incomplete blood count recovery (CR/CRi).
Genetic risk stratification
Genetic data for risk stratification was available in 67 of the 72 patients in CR/CRi and MRD assessment. Briefly, patients were classified with favorable, intermediate and adverse cytogenetics according to the 2010 Medical Research Council (MRC) criteria13 modified to include whenever available, data on CEBPA (N = 25), NPM1/FLT3-ITD (N = 58), and RUNX1/ASXl1/TP53 (N = 54) mutational status determined by targeted sequencing. Accordingly, patients were stratified into favorable (ie, CBF leukemia, biallelic mutated CEBPA and/or normal/intermediate karyotype with mutated NPM1 without FLT3-ITD; N = 15), intermediate (N = 13), and adverse (ie, adverse cytogenetics according to MRC criteria, FLT3-ITD allelic ratio > 0.5 and/or mutated RUNX1/ASXl1/TP53; N = 39) genetic risk. Patients with adverse genetic risk had significantly inferior relapse-free (P = .02) and overall survival (OS; P = .001).
MRD assessment
Patients enrolled in the FLUGAZA clinical trial had EDTA-anticoagulated BM aspirates sent at ambient temperature in ≤24h to one of the PETHEMA central laboratories for the identification of leukemia-associated immunophenotypes (LAIP) and aberrant differentiation/maturation profiles (different-from-normal [DfN]) at diagnosis, and to monitor MRD in patients in CR/CRi at cycles 3 and 9 using multidimensional flow cytometry (MFC).
At diagnosis, the EuroFlow lyse-wash-and-stain standard sample preparation protocol (SOP) adjusted to 106 nucleated cells, together with 5 of the 7 monoclonal antibody (mAb; 8-color) combinations of the MDS/AML EuroFlow panel were used to identify LAIP/DfN (Pacific Blue [PacB], Pacific Orange [PacO], fluorescein [FITC], phycoerythrin [PE], peridinin chlorophyll protein-cyanine 5.5 [PerCPCy5.5], phycoerythrin-cyanine 7 [PECy7), allophycocyanin [APC], allophycocyanin-hilite 7 [APCH7]): (1) HLADR, CD45, CD16, CD13, CD34, CD117, CD11b, CD10; (2) HLADR, CD45, CD35, CD64, CD34, CD117, CD300e, CD14; (3) HLADR, CD45, CD36, CD105, CD34, CD117, CD33, CD71; (4) HLADR, CD45, NuTdT, CD56, CD34, CD117, CD7, CD19; and (5) HLADR, CD45, CD15, NG2, CD34, CD117, CD22, CD38.14 The same SOPs and panel were used to create a reference data set of normal hematopoietic cells from healthy adults (N = 30). Data acquisition was performed in a FACSCanto II flow cytometer (BD Biosciences, San Jose, CA) using the FACSDiva 6.1 software (BD). Data analysis was performed using the Infinicyt software (Cytognos SL, Salamanca, Spain). Patient-specific panels (mean of 2 combinations per patient; range, 1-4) were designed for MRD assessment based on previously identified maturation arrest, lineage commitment and LAIPs (ie, “LAIP-based DfN approach”5 ), maintaining markers’ position from diagnosis to MRD (ie, conjugated with the same fluorochrome) to enable merging of diagnostic and MRD files using the “merge” option of the Infinicyt software. The “backbone” markers HLADR, CD45, CD34 and CD117 present in diagnostic panels were kept in all patient-specific MRD combinations. “Empty” positions (ie, FITC, PE, APC, and APCH7) were used to place markers aiming at the identification of hematopoietic nucleated cells with LAIP/DfN. This approach provided a digital fingerprint of leukemic blasts at diagnosis during MRD assessment (example provided in supplemental Figure 1). Approximately 1 million events per tube were measured for assessing MRD with an estimated sensitivity of 0.01%. An interobserver analysis was performed in selected cases to confirm results.
MRD was assessed in 64 patients in CR/CRi at cycle 3 and in 38 cases in CR/CRi at cycle 9. Overall, 72 patients had evaluable MRD at any time point and 21 in both time points (ie, cycles 3 and 9). Their demographics clinical-biological characteristics are summarized in Table 1.
Characteristics and treatment of the 72 patients achieving complete remission and having MRD assessed in the PETHEMA phase 3 FLUGAZA clinical trial
| Characteristic | Value |
|---|---|
| Age at diagnosis, y | |
| Median | 73 |
| Range | 65-87 |
| White cell count (×103/μL) at diagnosis, no. (%) | |
| <100 | 48 (67) |
| ≥100 | 24 (33) |
| Risk group, no. (%) | |
| Favorable | 15 (21) |
| Intermediate | 13 (18) |
| Adverse | 39 (54) |
| Missing | 5 (7) |
| Treatment, no. (%) | |
| FLUGA | 36 (50) |
| AZA | 36 (50) |
| Median follow-up | |
| Median | 31 |
| Range | 7-58 |
Fluorescence-activated cell sorting
Patient-specific aberrant phenotypes identified with MFC were used for highly purified fluorescence-activated cell sorting (FACS) sorting of leukemic cells at diagnosis and after treatment (ie, MRD) in a FACSAria IIb flow cytometer (BD). At diagnosis, T cells were FACS sorted as control for germline variants (supplemental Figure 2). In patients with undetectable MRD, CD34+ hematopoietic progenitor cells (HPCs) were isolated by FACS to investigate the presence of genetic MRD (gMRD15 ).
Whole-exome sequencing
The quality of genomic DNA extracted from tumor and T cells (coisolation of DNA and RNA is described in supplemental Methods) was evaluated by Agilent 4200 Tape Station using Genomic DNA ScreenTape system (Agilent), and DNA concentration quantified by Qubit System (Invitrogen). DNA was then fragmented to an average size of 225 bp using a Covaris S220 ultrasonicator (Covaris). Target enrichment was performed with SureSelectXT Human All Exon V6 Capture Library (Agilent Technologies) and sequence targets were captured and amplified in accordance with manufacturer’s recommendations. Enriched libraries were used for 150 base sequencing in a NovaSeq 6000 (Illumina) following manufacturer’s instructions. Sequencing resulted in a mean read depth of 95× (range, 12× to 1147×).
Whole-exome data analysis
Variants were annotated using the bioinformatics software HD Genome One (DREAMgenics, Oviedo, Spain), using several databases containing functional (Ensembl, CCDS, RefSeq, Pfam), populational (dbSNP, 1000 Genomes, ESP6500, ExAC) and cancer-related (COSMIC – Release 87, ICGC – Release 27) information. In addition, 9 scores from algorithms for prediction of the impact caused by nonsynonymous variants on the structure and function of the protein were used (SIFT, PROVEAN, Mutation Assessor, Mutation Taster, LRT, MetaLR, MetaSVM, FATHMM, and FATHMM-MKL),16-22 and 1 score (GERP++) for evolutionary conservation of the affected nucleotide.23 Indel realignment was performed to correct underestimated allele frequencies. Variants with a population allele frequency higher than 0.01 were excluded. Variants detected in germline samples were excluded. Only mutations with a coverage higher than 9 in all samples from a patient were selected. Only variants detected in a sample with a mutated allele count ≥3 were selected. The detection of copy-number abnormalities (CNA) was performed by a modified version of the exome2cnv algorithm,24 incorporating a combination of read depth and allelic imbalance computations for CNA assessment. For each patient, the algorithm uses its normal sample as background for computing CNA. For visualization of recurrently mutated genes, an Oncoprint image was built using ComplexHeatmap25 and circlize26 R packages.
Statistical analysis
The cumulative incidence of relapse (CIR) was evaluated with the use of the method of Gray and the Fine and Gray model for competing risks, and was measured from the date of MRD assessment until the date of relapse; patients not known to have relapsed were censored on the date they were last examined; patients who died without relapse were counted as a competing cause of failure.27 Relapse-free survival (RFS) was measured from the date of MRD assessment until the date of relapse or death from any cause; patients not known to have relapsed or died at last follow-up were censored on the date they were last examined.27 Overall survival (OS) was measured from the date of MRD assessment until the date of or death from any cause; patients not known to have died at last follow-up were censored on the date they were last examined.27 Survival analyses were conducted in landmarks after induction and consolidation. Differences within subgroups were tested for statistical significance with the (2-sided) log-rank test, and hazard ratios (HRs) with 2-sided 95% confidence intervals (CIs) were estimated with a Cox regression model. Multivariate proportional hazards models were constructed for CIR, RFS, and OS. Covariates included genetic risk stratification, treatment arm and MRD status. The χ2 test was used to estimate the statistical significance of differences between groups. All significance tests are 2-tailed, with a P value of .05 used as the threshold for statistical significance. Statistical analyses were performed with Stata (version 15.0; StataCorp LP) and SPSS (version 20.0; IBM, Chicago, IL).
Results
Prognostic value of MRD assessment after semi-intensive chemotherapy and HMA
Of the 283 patients enrolled in the phase 3 PETHEMA/FLUGAZA clinical trial, 72 achieved CR/CRi and were tested for MRD; 13 (18%) had negative MRD by MFC using a cutoff of 0.01%. As compared with cases in whom MRD persisted after induction (N = 51 of 64; 80%), those with undetectable MRD (N = 13 of 64; 20%) had significantly prolonged RFS (median of 7 vs 19 months, respectively; HR, 0.34, P = .005; Figure 2A) and OS (median of 13 vs 25 months, respectively; HR, 0.45; P = .030; Figure 2B). By contrast, differences in RFS and OS according to patients’ MRD status after consolidation failed to reach statistical significance (supplemental Figure 3). Of note, risk stratification when considering MRD as a continuous variable (down to 0.001%) yielded significant differences in both time points. Patients with persistent MRD after induction showed inferior RFS (HR, 1.17; P = .003) and OS (HR, 1.25; P < .001); those with detectable MRD after consolidation displayed poorer RFS (HR, 1.25; P = .005) and OS (HR, 1.24; P = .011).

Outcome according to CRMRDstatus in older AML patients treated with low-intensive therapy or hypomethylating agents. RFS (A) and OS (B) of patients in CR/CRi according to persistence (ie, ≥0.01%) vs undetectable (ie, <0.01%) MRD after induction. (C) Patients with undetectable MRD are listed according to their outcome: OS is depicted by gray bars, whereas progression and deaths are identified by orange and purple boxes, respectively. P values were determined by the 2-sided log-rank test.
Outcome according to CRMRDstatus in older AML patients treated with low-intensive therapy or hypomethylating agents. RFS (A) and OS (B) of patients in CR/CRi according to persistence (ie, ≥0.01%) vs undetectable (ie, <0.01%) MRD after induction. (C) Patients with undetectable MRD are listed according to their outcome: OS is depicted by gray bars, whereas progression and deaths are identified by orange and purple boxes, respectively. P values were determined by the 2-sided log-rank test.
Clinical significance of undetectable MRD in elderly AML
We found no significant differences in undetectable MRD rates achieved by elderly AML patients stratified by age, WHO diagnostic category, WBC, and genetic risk (data not shown). Of note, achieving undetectable MRD significantly improved RFS of patients with adverse genetics (HR, 0.32; P = .013) (supplemental Figure 4).
Although there was a trend for lower CR/CRi rates in patients treated with HMA vs semi-intensive therapy (23% vs 33%; P = .058), there were no significant differences in MRD− rates among patients in CR/CRi after AZA vs FLUGA (5 of 36 [14%] vs 8 of 36 [23%], respectively; P = .54). These results suggest that albeit slightly less frequent, the quality of CR/CRi measured by MRD− rates was similar between the 2 arms. Among those with persistent MRD, RFS was significantly longer in patients treated with AZA vs FLUGA (supplemental Figure 5). On multivariate analysis including genetic risk and treatment arm, MRD status was the only factor with independent prognostic value for CIR (HR, 2.95; P = .002) and RFS (HR, 3.45; P = .002) (Table 2). Nevertheless, the risk of relapse for those with undetectable MRD after 9 cycles and subsequent treatment interruption was high, with only 2 of the 13 patients remaining relapse-free and alive at the latest follow-up (Figure 2C). This finding suggests that treatment interruption after nonintensive approaches could lead to rapid relapse, probably because persistent disease was not detected using MFC.
Multivariate analysis of prognostic factors and treatment arm for CIR, RFS, and OS
| Risk factor | CIR | RFS | OS | |||
|---|---|---|---|---|---|---|
| HR (95% CI) | P | HR (95% CI) | P | HR (95% CI) | P | |
| Genetics* | 1.56 (0.90-2.71) | .113 | 1.47 (0.81-2.69) | .208 | 1.09 (0.60-2.00) | .769 |
| Treatment† | 1.28 (0.75-2.18) | .361 | 1.70 (0.99-2.92) | .052 | 1.17 (0.68-2.02) | .570 |
| MRD‡ | 2.95 (1.48-5.90) | .002 | 3.45 (1.60-7.45) | .002 | 1.85 (0.91-3.79) | .090 |
Multivariate analysis of prognostic factors and treatment arm for CIR, RFS, and OS in patients achieving complete remission with or without incomplete blood count recovery, with available genetic risk stratification and MRD assessment (N = 67), in the PETHEMA phase 3 FLUGAZA clinical trial.
Genetics: adverse vs intermediate/favorable risk.
Treatment: fludarabine and cytarabine vs azacitidine.
MRD: positive vs negative.
Applicability of MFC-based MRD assessment in elderly AML
To better understand the limitations of MFC-based MRD assessment in identifying patients with long-term survival and driven by the paucity of data about immunophenotyping in elderly AML,28,29 we investigated the level of phenotypic divergence/overlap between leukemic cells vs their normal maturation-stage counterpart in healthy adults (N = 30; age range, 20-24 years). Namely, in patients whom ≥50% leukemic cells expressed CD34, their phenotypic profile was compared with that of CD34+ progenitors from healthy adults. In patients in whom <50% leukemic cells expressed CD34 but ≥50% expressed CD117, these were compared with CD117+ myeloid or erythroid progenitors from healthy adults, depending on the lineage commitment of leukemic cells. In patients in whom <50% leukemic cells expressed CD34 and CD117, their phenotypic profile was compared with that of the total neutrophil, monocytic or erythroid lineage from healthy adults, depending on the lineage commitment of leukemic cells. After merging immunophenotypic data from patients and healthy adults, cells were plotted using principal component analysis and represented according to their median value of expression for any given 8 markers in the combination (leukemic cells) or to the standard deviation (normal counterpart). In each combination, a score of −1, 0, or 1 was given if leukemic cells were plotted inside, over or outside the standard deviation of the normal counterpart. As a result, patients could be scored from −5 (full phenotypic overlap with the normal counterpart) to 5 (full phenotypic divergence with respect to the normal counterpart) (Figure 3A). Overall, this unbiased scoring approach unveiled that only 6 of 265 (2%) patients harbored leukemic cells showing phenotypic profiles fully overlapping with their normal maturation-stage counterpart (Figure 3B). Three of these cases had blasts with myelomonocytic or monocytic differentiation. Thus, these results indicate that MFC was empowered to identify aberrant phenotypes present in leukemic cells from most older AML patients at diagnosis.
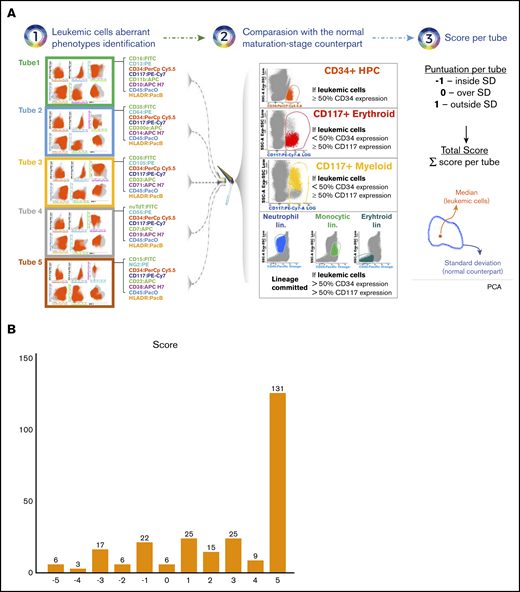
Phenotypic divergence and overlap between leukemic cells in elderly AML vs their normal maturation-stage counterpart in healthy adults. (A) Bone marrow samples from older AML patients (N = 265) and healthy adults (N = 30; age range, 20-24 years) were immunophenotyped with the first 5 combinations of the EuroFlow panel for the diagnostic classification of MDS/AML. Patient-specific aberrant phenotypes were identified and the total leukemic cells were exported into new FCS files without the remaining nucleated cells. Files from patients in whom ≥50% leukemic cells expressed CD34 were merged with files containing CD34+ progenitors from healthy adults; files from patients whom <50% leukemic cells expressed CD34 but ≥50% expressed CD117, were merged with files containing CD117+ myeloid or erythroid progenitors from healthy adults, depending on the lineage commitment of leukemic cells; files from patients whom <50% leukemic cells expressed CD34 and CD117 were merged with files containing the total neutrophil, monocytic, or erythroid lineage from healthy adults, depending on the lineage commitment of leukemic cells. After merging FCS files of leukemic cells from patients and the corresponding normal-cell counterpart from healthy adults, cells were plotted using principal component analysis (PCA) and represented according to their median value of expression for any given 8 markers in the combination (leukemic cells) or to the standard deviation (SD) (normal counterpart). In each combination, a score of −1, 0, or 1 was given if leukemic cells were plotted inside, over or outside the SD of the normal counterpart. Thus, patients could be scored from −5 (full phenotypic overlap with the normal counterpart) to 5 (full phenotypic divergence with respect to the normal counterpart). (B) Number of patients with each score based on the principal component analysis of merged data.
Phenotypic divergence and overlap between leukemic cells in elderly AML vs their normal maturation-stage counterpart in healthy adults. (A) Bone marrow samples from older AML patients (N = 265) and healthy adults (N = 30; age range, 20-24 years) were immunophenotyped with the first 5 combinations of the EuroFlow panel for the diagnostic classification of MDS/AML. Patient-specific aberrant phenotypes were identified and the total leukemic cells were exported into new FCS files without the remaining nucleated cells. Files from patients in whom ≥50% leukemic cells expressed CD34 were merged with files containing CD34+ progenitors from healthy adults; files from patients whom <50% leukemic cells expressed CD34 but ≥50% expressed CD117, were merged with files containing CD117+ myeloid or erythroid progenitors from healthy adults, depending on the lineage commitment of leukemic cells; files from patients whom <50% leukemic cells expressed CD34 and CD117 were merged with files containing the total neutrophil, monocytic, or erythroid lineage from healthy adults, depending on the lineage commitment of leukemic cells. After merging FCS files of leukemic cells from patients and the corresponding normal-cell counterpart from healthy adults, cells were plotted using principal component analysis (PCA) and represented according to their median value of expression for any given 8 markers in the combination (leukemic cells) or to the standard deviation (SD) (normal counterpart). In each combination, a score of −1, 0, or 1 was given if leukemic cells were plotted inside, over or outside the SD of the normal counterpart. Thus, patients could be scored from −5 (full phenotypic overlap with the normal counterpart) to 5 (full phenotypic divergence with respect to the normal counterpart). (B) Number of patients with each score based on the principal component analysis of merged data.
Genomic landscape of CD34 progenitors and leukemic cells at MRD stages
We then hypothesized that in patients with undetectable MRD, phenotypically normal CD34+ progenitors would contain cells with leukemic-initiating potential that could be identified on genetic (rather than phenotypic) grounds. As such, we performed WES in CD34+ HPCs from 4 patients with undetectable MRD and compared their genomic landscape of blasts at diagnosis (supplemental Figure 2).
Mutations and copy-number abnormalities (CNAs) consistent with gMRD15 were systematically identified in CD34+ HPC from patients with undetectable MRD by MFC (Figure 4A; supplemental Figure 6A). The percentage of concordant mutations and CNAs between leukemic cells at diagnosis and CD34+ progenitors from patients in CRMRD was 25%, whereas the frequency of genetic alterations becoming undetectable or detectable after treatment was 34% and 41%, respectively. Only a few genes were mutated in >1 patient and none were AML drivers, although some had been ascribed a role in AML pathogenesis (eg, CYP2A6,30 LETM1,31 PTPRE,32 and PKD1L233 ; supplemental Table 1).

Genomic landscape of CD34 progenitors and leukemic cells at MRD stages. Patients with undetectable (A) (N = 4) and persistent MRD (B) (N = 6) after FLUGA (light purple) or AZA (light green). Genes are distributed in rows, and columns represent paired baseline and phenotypically normal CD34 progenitors (HPCs) in patients with undetectable MRD, or paired diagnostic and blasts in patients with persistent MRD. Venn diagram shows the percentage of mutations and CNAs in blasts or HPCs detectable only at baseline, detectable only at MRD, and detectable in both time points. P value was determined by Pearson χ2 for differences between treatment arms.
Genomic landscape of CD34 progenitors and leukemic cells at MRD stages. Patients with undetectable (A) (N = 4) and persistent MRD (B) (N = 6) after FLUGA (light purple) or AZA (light green). Genes are distributed in rows, and columns represent paired baseline and phenotypically normal CD34 progenitors (HPCs) in patients with undetectable MRD, or paired diagnostic and blasts in patients with persistent MRD. Venn diagram shows the percentage of mutations and CNAs in blasts or HPCs detectable only at baseline, detectable only at MRD, and detectable in both time points. P value was determined by Pearson χ2 for differences between treatment arms.
To have further insight into the levels of gMRD found in phenotypically normal CD34+ HPC from patients with undetectable MRD, we performed a similar comparison between leukemic cells at diagnosis vs MRD stages in 6 cases with persistent MRD (Figure 4B; supplemental Figure 6B). Overall, we found similar levels of concordant mutations (42%) as well as of those becoming undetectable or detectable after treatment (14% and 44%, respectively). Most mutations were nonrecurrent, though in these patients known AML-related mutations such as DNMT3A and RUNX1 were observed (supplemental Table 2). Overall, these results underpin that the extent of gMRD in patients achieving CRMRD by MFC is similar to that found in those with persistent MRD.
A further analysis including both patients with undetectable and persistent MRD, unveiled a significant increase in the number of genetic alterations from diagnosis to MRD stages in those treated with FLUGA vs AZA (2.2-fold vs 1.1-fold; P = .001). Although we cannot exclude the effect of high diversity of preleukemic clones and selection during treatment, these findings could be partially related to the mutagenic potential of antimetabolites.34
Discussion
The clinical significance of MRD in elderly AML patients is inconsistent between those treated with intensive therapy and cases receiving HMAs; achieving MRD negativity prolonged OS of the former35,36 but not the latter.9 No results have been reported in patients treated with semi-intensive therapy. Here, we found that patients in CR/CRi with undetectable MRD had significantly improved CIR and RFS as compared with cases with persistent MRD, though not OS when using a cutoff of 0.01%.
The treatment landscape of AML is evolving from a curative/intensive vs palliative/low-intensity binary approach into new algorithms that incorporate mutation-specific targeted therapies, apoptosis-inducing small molecules, and monoclonal antibodies.10,37,38 Accordingly, there is renewed interest in the role of biomarkers to measure depth of response in elderly AML.6 Similarly to that found in candidates to intensive therapy,39 this study confirms that CRMRD supersedes morphological CR and is an independent prognostic factor in older AML patients, treated with semi-intensive chemotherapy or HMA. Thus, it could be important to consider these results during the design of new clinical trials and treatment endpoints in elderly AML.
The utility of AZA to substantially delay hematological relapse in AML patients achieving CR after conventional chemotherapy or allogeneic hematopoietic stem cell transplantation and detectable MRD, was recently shown; this was in part due to the achievement of MRD negativity in one-third of patients.11 Here, we found limited value of prolonged treatment with FLUGA or AZA in patients with persistent MRD, and it could be hypothesized if changing regimens rather than prolonging them could have improved outcomes. Furthermore, we observed that most MRD− patients relapsed soon after treatment interruption, which uncovers the presence of leukemic cells undetectable by MFC based MRD assessment. Thus, alternative trial design and enhanced sensitivity may be prerequisites for future studies exploring MRD-guided therapy for older patients with AML.
The applicability and performance of MRD monitoring using MFC in younger AML patients is well-established.40 By contrast, there is limited data in the elderly.9,36 Here, we performed an unbiased and objective comparison between leukemic cells from older AML patients and their corresponding normal hematopoietic counterpart. Our results were aligned with the consensus of high applicability of MFC in AML,5 and confirmed the presence of aberrant phenotypes in leukemic cells from most older AML patients. However, this study unveiled that phenotypically normal CD34+ progenitors possess substantial genetic abnormalities in cases with negative MRD. Accordingly, the identification of more specific leukemic antigens together with improved sensitivity of MRD testing by MFC, and possibly the combined use of this method with next-generation sequencing,41 might be warranted to identify elderly AML patients in CRMRD that may experience long-term survival and could benefit from treatment individualization based on MRD status. Notwithstanding, mutations found in phenotypically normal CD34+ HPCs were present in AML-unrelated genes, which suggests that next-generation sequencing methods should be comprehensive to cover a wide range of gMRD. In such a case, further studies should also investigate whether, beyond MRD levels, the genetic profile at remission could also help predicting risk of relapse. These studies are indeed needed to establish the practicality of applying these findings to a clinical setting.
Data was submitted to the European Genome-Phenome Archive (EGAS00001004574; https://egaarchive.org/studies/EGAS00001004574).
Acknowledgments
The authors acknowledge all investigators involved in the PETHEMA phase 3 FLUGAZA clinical trial.
This work was supported by the CIBERONC (CB16/12/00369, CB16/12/00233, CB16/12/00489, and CB16/12/00284), Instituto de Salud Carlos III/Subdirección General de Investigación Sanitaria Fondo de Investigación en Salud (FIS no. PI16/01661 and PI16/00517), and the Plan de Investigación de la Universidad de Navarra (PIUNA; 2014-18). This study was supported internationally by the Cancer Research UK, Fundación Científica de la Asociación Española Contra el Cáncer (FCAECC), and Fondazione AIRC per la Ricerca sul Cancro under the Accelerator Award Program (EDITOR [Early Detection and Intervention]).
Authorship
Contribution: B.P., M.Á.S., and P. Montesinos were responsible for study conception and design; C.S., B.P., and P. Montesinos analyzed and interpreted data; C.S. and B.P. performed statistical analysis; D.M.-C., J.-M.B., S. Vives, L.A., M.T., P. Martinez, J.S., P.H., F.R., O.S., E.L., C.G., J.-L.L., M.-B.V., J.L., J.-F.F., M.-J.S., R.A., J.M.-L., S. Villar, M.-J.C., F.P., J.F.S.-M., M.Á.S., and P. Montesinos provided study material and/or patients; C.S, B.P., and P. Montesinas wrote the manuscript; and all authors reviewed and approved the manuscript.
Conflict-of-interest disclosure: B.P. declares honoraria for lectures from, and membership on advisory boards with, Amgen, Bristol Myers Squibb (BMS), Celgene, Janssen, Merck, Novartis, Roche, and Sanofi; unrestricted grants from Celgene, EngMab, Sanofi, and Takeda; and consultancy for Celgene, Janssen, Sanofi, and Takeda. M.T. declares honoraria for lectures from Celgene, Pfizer, Novartis, Janssen, Merck Sharp & Dohme (MSD), Daiichi, and Servier SL, and membership on advisory boards with Celgene, Novartis, Roche, and Astellas. J.S. declares honoraria for lectures, and membership on advisory boards with, Daiichi Sankyo, Pfizer, Celgene, Novartis, Roche, and Amgen. F.R. declares travel grants from Celgene, Novartis, Amgen, AbbVie, Janssen, Roche, MSD, and Daiichi Sankyo; consulting fees from Celgene, Novartis, Amgen, and AbbVie; and advisory board membership with, as well as research grants from, Celgene. E.L. declares honoraria for lectures from Janssen and Novartis, and advisory board membership with Janssen, Celgene, Astellas, and Amgen. M.-B.V. declares honoraria for lectures from, and membership on advisory boards with, Janssen, BMS, Novartis, Roche, Astellas Pharma, and Jazz Pharmaceuticals. J.L. declares travel grants from Celgene, Takeda, and Gilead. C.G. declares honoraria for lectures from Celgene, Amgen, Janssen, and Pfizer, and advisory board membership with Celgene. J.M.-L. declares honoraria for lectures from, and membership on advisory boards with, Janssen, BMS, Sanofi, Novartis, Incyte, Roche, and Amgen; and membership on the boards of directors of Hosea and Altum Sequencing. J.F.S.-M. reports consultancy for BMS, Celgene, Novartis, Takeda, Amgen, MSD, Janssen, and Sanofi, and membership on the board of directors of, or advisory committees with, Takeda. M.Á.S. declares a consulting or advisory role for Teva, Daiichi Sankyo, Orsenix, AbbVie, Novartis, and Pfizer. P. Montesinos declares advisory board and speaker’s bureau membership with, as well as research support from, AbbVie, Janssen, Novartis, Pfizer, and Teva; research support, being a consultant for, and speaker’s bureau and advisory board membership with Astellas, Celgene, and Daiichi Sankyo; being a consultant for Agios, Tolero Pharmaceutical, Glycomimetics, and Forma Therapeutics; speaker’s bureau and advisory board membership with Incyte; and research support from, and advisory board membership with, Karyopharm. The remaining authors declare no competing financial interests.
A complete list of participating institutions and clinicians of the PETHEMA epidemiologic registry of acute myeloid leukemia and acute promyelocytic leukemia appears in the supplemental Appendix.
Correspondence: Pau Montesinos, Hematology Department (Torre G, Planta 7), Hospital Universitari i Politècnic La Fe, Avinguda Fernando Abril Martorell, 106 CP, 46026 Valencia, Spain; e-mail: montesinos_pau@gva.es.

