

Key Points
3D alginate spheroid model supports self-organization of lymphoma B cells and stromal cells mimicking lymphoma cell niche.
This high-throughput 3D model is suitable for testing new therapeutic agents in B-NHL.

Abstract
Non-Hodgkin B-cell lymphomas (B-NHL) mainly develop within lymph nodes as aggregates of tumor cells densely packed with their surrounding microenvironment, creating a tumor niche specific to each lymphoma subtypes. In vitro preclinical models mimicking biomechanical forces, cellular microenvironment, and 3D organization of B-cell lymphomas remain scarce, while all these parameters are key determinants of lymphomagenesis and drug resistance. Using a microfluidic method based on cell encapsulation inside permeable, elastic, and hollow alginate microspheres, we developed a new tunable 3D model incorporating lymphoma B cells, extracellular matrix (ECM), and/or tonsil stromal cells (TSC). Under 3D confinement, lymphoma B cells were able to form cohesive spheroids resulting from overexpression of ECM components. Moreover, lymphoma B cells and TSC dynamically formed self-organized 3D spheroids favoring tumor cell growth. 3D culture induced resistance to the classical chemotherapeutic agent doxorubicin, but not to the BCL2 inhibitor ABT-199, identifying this approach as a relevant in vitro model to assess the activity of therapeutic agents in B-NHL. RNA-sequence analysis highlighted the synergy of 3D, ECM, and TSC in upregulating similar pathways in malignant B cells in vitro than those overexpressed in primary lymphoma B cells in situ. Finally, our 3D model including ECM and TSC allowed long-term in vitro survival of primary follicular lymphoma B cells. In conclusion, we propose a new high-throughput 3D model mimicking lymphoma tumor niche and making it possible to study the dynamic relationship between lymphoma B cells and their microenvironment and to screen new anti-cancer drugs.
Introduction
Non-Hodgkin lymphomas (NHL) are a group of common hematological malignancies, with the majority of them originating from B cells. Follicular lymphoma (FL) and diffuse large B-cell lymphomas (DLBCL), the 2 most frequent B-cell NHL (B-NHL),1,2 result from the malignant transformation of germinal center (GC) or post-GC B cells. FL are indolent lymphomas characterized by the occurrence of the t(14;18)(q32;q21) translocation combined with additional recurrent somatic alterations.3 Two major subtypes of aggressive DLBCL, GC B-cell (GCB) and activated B-cell (ABC)–DLBCL, have been identified using gene expression profiling, reflecting their putative cell of origin and molecular alterations.4 Despite a better understanding of the pathophysiology of these tumors, frontline therapy remains based on a combination of conventional chemotherapies such as CHOP (cyclophosphamide, doxorubicin, vincristine, and prednisone) and a monoclonal antibody against CD20. Nonetheless, relapse/refractory DLBCL, corresponding to ∼30% of patients, remains a major unmet medical need with poor outcome, whereas FL is still an incurable disease.3,5 It is now widely accepted that tumors constitute a complex ecosystem composed of many cell types regulated by biological, structural, chemical, and mechanical cues that altogether participate in the effectiveness of treatment.6 The tumor microenvironment (TME) of B-NHL contains highly variable numbers of heterogeneous immune cells, stromal cells, blood vessels, and extracellular matrix (ECM), and the interplay between these elements produces a tumor niche specific to each lymphoma subtype.7,8 Dave et al9 initially revealed that the survival of patients with FL correlates with the immune signature of the tumor at diagnosis. Indeed, FL exhibits a high dependence on a GC-like microenvironment where immune and stromal cells support survival, proliferation, and migration of malignant B cells. In turn, FL cells modulate the phenotype and function of their surrounding microenvironment. In particular, FL-infiltrating stromal cells are engaged in a bidirectional crosstalk with malignant B cells within infiltrated lymph nodes (LN) and bone marrow.10-12 Conversely, DLBCL are less dependent on LN microenvironment, but specific stromal signatures impact DLBCL prognosis.7,13,14 Importantly, studies exploring functional interactions between lymphoma B cells and stromal cells generally used 2D in vitro culture models, whereas biomechanical forces and 3D organization emerge as key determinants of lymphoma pathogenesis and drug resistance. Multicellular spheroids or tumor organoids represent promising models, allowing high-throughput screening of anticancer drugs in versatile systems mixing several cell types and ECM components. While 3D culture models are increasingly developed for solid cancer,15 their transfer to lymphoma modeling is still limited and includes: (1) multicellular aggregates of lymphoma cells, which are obtained using the hanging drop and ultra-low attachment method, and are useful for testing drug efficacy but do not account for the effect of cell-cell and cell-ECM interactions,16-18 (2) 3D lymphoma organoid models integrating lymphoid-like stromal cells or integrin-specific binding peptides recapitulating more accurately lymphoma microenvironment, but difficult to handle and low-throughput,19 and (3) a DLBCL-on-chip model utilizing lymphoma and TME murine cells, enabling the in vitro modeling of DLBCL niche and associated vasculature.20 However, modeling the interactions of the TME with primary lymphoma B cells in 3D cocultures remains a challenge. In particular, 3D cocultures have been successful only with primary DLBCL cells21 but not with primary FL cells.
In the present study, using a microfluidic method based on the encapsulation of cells inside permeable, elastic, and hollow alginate microspheres,22 we developed a new tunable 3D model incorporating lymphoma B cells, together with ECM and/or stromal cells. We observed that lymphoma B cells and stromal cells formed 3D spheroids, whose internal architecture was driven by self-organization, and recapitulated some of the molecular features of FL tumors. Moreover, this approach made it possible to assess drug efficacy in a relevant in vitro B-NHL model. Finally, this 3D model allowed the survival of primary FL B cells in vitro, removing a technological bottleneck to study TME and tumor cell relationships in this still fatal malignancy.
Methods
Details regarding reagents and additional experimental methods are provided in the supplemental Methods.
Encapsulation procedure
Cell encapsulation was performed essentially as previously described.23,24 First, the microfluidic device was 3D printed and a glass capillary (∼150 µm diameter) was glued to the exit of the device. Then, three solutions loaded in syringes mounted to pumps were injected into the coaxial cones of the device. The outermost cone contained the alginate solution, the intermediate cone contained a 300 mM sorbitol solution, and the innermost cone contained the cells in sorbitol or Matrigel/sorbitol solution. Composite droplets exiting the nozzle fell in a 100 mM CaCl2 bath for gelling on. Once formed, capsules were washed with cell culture medium. Cellular capsules were cultured in Dulbecco’s modified Eagle medium supplemented with 10% FBS.
Cell lines and primary stromal and FL cells
Tonsil stromal cells (TSC) were isolated as previously described10,25 from routine tonsillectomy. SUDHL4 DLBCL and DOHH2 FL cell lines were obtained from the DSMZ cell collection. HLY1 DLBCL cell line was kindly provided by F. Meggetto (Centre de Recherches en Cancérologie de Toulouse). FL biopsies came from subjects recruited under written informed consent recovery according to the Principles of the Declaration of Helsinki and the French National Cancer Institute (INCa) ethics committee recommendations and were used to purify primary lymphoma B cells.
Immunofluorescence staining of spheroids
After fixation, immunofluorescence was performed either in capsulo or on Formalin-Fixed Paraffin-Embedded spheroid sections, as described in supplemental Methods. Images were acquired using a Zeiss LSM 510 meta confocal microscope (Zeiss) with a 25x objective (N.A 0.7) and were then processed using Fiji software.
Cell coculture and cell sorting
2D and 3D cocultures were performed over 3 and 10 days, respectively, before staining with mouse anti-human CD20 APC-H7 and mouse anti-human CD73 PE (e-Bioscience) and sorting of CD20posCD73neg B cells on a FACSAria II (BD Biosciences).
RNA-sequence analysis
RNA was extracted using the Nucleospin RNA XS Micro kit from Macherey Nagel. Libraries were prepared using the SMARTer Low Input RNA kit (Takara). All libraries were sequenced on an Illumina Hiseq2500 platform. Data normalization and differential gene expression were performed with the DESeq2 v1.26.0 R package. Significant genes were defined as P < .05 after adjustment for multiple testing by False Discovery Rate (FDR) correction and used in downstream analysis. Principal Component Analysis was visualized using the Factoextra v1.0.7 R package. Gene Set Enrichment Analysis (GSEA version 4.1.0) was used for the analysis of DOHH2 and HLY1 gene expression profile (GEP) to identify the gene sets that were enriched between 2 conditions. Results were then compared with those obtained by comparing the GEP of purified FL B cells and purified centrocyte (Affymetrix microarrays, purified centrocytes, GSE136248, n = 5; purified FL B cells, GSE85233, n = 10)26 after Limma analysis with an FDR of 5% and an absolute fold change >1.5.12
Statistical analyses
All data were expressed as means ± standard error of the mean. The significance of differences was calculated using the parametric analysis of variance or the nonparametric Mann-Whitney U or Wilcoxon tests, as appropriate. (*P < .05, **P < .01, ***P < .001, ****P < .0001).
Results
B-NHL cell lines form cohesive spheroids in scaffold-free alginate capsules
To produce spheroids from lymphoma B-cell lines, we used the cellular capsule technology, initially developed to generate spheroids from solid cancer tumor cells.22,23 Three B-NHL cell lines have been selected for encapsulation as representative models for GCB-DLBCL (SUDHL4), ABC-DLBCL (HLY1), and FL (DOHH2). From image-based analysis (N = 656), the average capsule diameter was 215.9 ± 1.3 µm, and the capsules contained an average of 18.2 ± 0.8 cells per capsule (N = 48) (supplemental Figure 1). During the first 11 days, SUDHL4 and HLY1 proliferated and aggregated to form spheroids. Contrastingly, DOHH2 cells were not able to grow and form spheroids even after 17 days (Figure 1A), suggesting their requirement of a supportive microenvironment in the context of the low number of cells seeded in each individual capsule. Culture of the 3 B-NHL cell lines in limiting dilution conditions in 2D confirmed the low clonality potential of DOHH2 compared with SUDHL4 (supplemental Figure 2). However, HLY1 similarly exhibited a limited clonal activity whereas they efficiently proliferated in 3D spheroids. Cell survival in SUDHL4 and HLY1 spheroids was evaluated at various culture timepoints using propidium iodide labeling. We defined as 3D confluence the stage when cells filled up the capsule and reached the internal wall of the alginate shell, and as 3D post-confluence the stage when cell growth triggered an increase of the capsule size and a decrease of alginate wall thickness (supplemental Figure 3). The percentage of dead cells remained as low as 20% to 30% during the first week in culture and then increased to ∼60% after 8 to 12 days, as evaluated upon spheroid dissociation and flow cytometry quantification (Figure 1B). EdU staining revealed that the early stages of spheroid growth were characterized by a high proliferation rate, while the post-confluent stage exhibited a significant decrease in cell proliferation concomitant with cell death increase (supplemental Figure 4). To determine whether this survival decrease was associated with the formation and growth of a dead cellular core, as observed in solid tumor spheroids,27,28 we performed immunostaining for cell proliferation (Ki67) and cell death (cleaved-caspase 3). Neither Ki67 nor cleaved-caspase 3 regionalization was detected prior or after 3D confluence (Figure 1C). In the same way, no hypoxic core was observed, even if HLY1 spheroids exhibited more hypoxic cells at post-confluence than SUDHL4 spheroids (supplemental Figure 5).
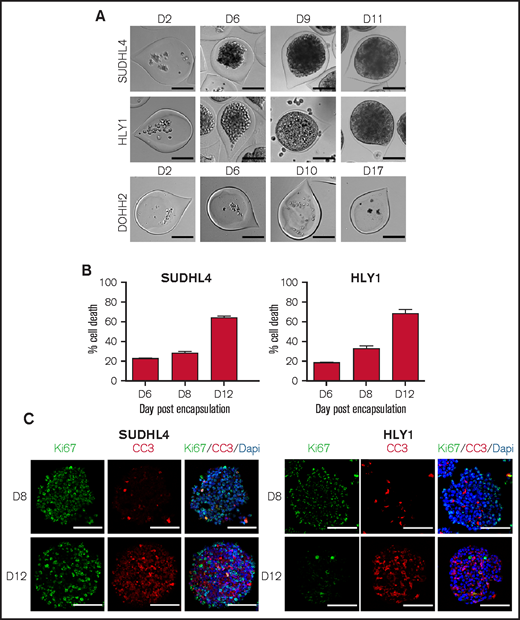
B-NHL spheroids obtained by using the cellular capsule technology. (A) Representative images of cell growth in alginate capsule shells over time for the various cell lines. Scale bar, 100 µm. (B) Percentage of SUDHL4 and HLY1 cell death measured after shell dissolution and spheroid dissociation at 6, 8, and 12 days after encapsulation. To evaluate cell death, propidium iodide (PI) (10 µg/mL) was added to the cell suspension and PI fluorescence was analyzed by flow cytometry (n = 3). (C) Immunostaining showing the repartition of proliferating and apoptotic cells in SUDHL4 and HLY1-derived spheroids at 8 or 12 days post-encapsulation. Five micrometers thick sections were stained with anti-Ki67 (Ki67, in green) and anti-cleaved caspase 3 (CC3, in red) to identify proliferating and dead cells, respectively. Nuclei are depicted in blue (Dapi staining). Scale bar, 100 µm.
B-NHL spheroids obtained by using the cellular capsule technology. (A) Representative images of cell growth in alginate capsule shells over time for the various cell lines. Scale bar, 100 µm. (B) Percentage of SUDHL4 and HLY1 cell death measured after shell dissolution and spheroid dissociation at 6, 8, and 12 days after encapsulation. To evaluate cell death, propidium iodide (PI) (10 µg/mL) was added to the cell suspension and PI fluorescence was analyzed by flow cytometry (n = 3). (C) Immunostaining showing the repartition of proliferating and apoptotic cells in SUDHL4 and HLY1-derived spheroids at 8 or 12 days post-encapsulation. Five micrometers thick sections were stained with anti-Ki67 (Ki67, in green) and anti-cleaved caspase 3 (CC3, in red) to identify proliferating and dead cells, respectively. Nuclei are depicted in blue (Dapi staining). Scale bar, 100 µm.
Interestingly, the integrity of the cell aggregates observed after confluence was maintained upon capsule dissolution (Figure 2A; supplemental Video 1 and 2), demonstrating that the capsule content was not only a confined cell suspension but rather formed truly cohesive spheroids, potentially related to confinement-induced ECM secretion. We thus compared by immunofluorescence the expression of Laminin and Collagen I, 2 ECM components expressed in secondary lymphoid organs,29,30 by cells maintained in suspension (2D) or in capsules (3D). SUDHL4 already expressed Collagen I in 2D culture and upregulated Laminin in 3D spheroids. Conversely, HLY1 displayed Laminin expression in 2D and 3D cultures but increased Collagen I in 3D spheroids (Figure 2B). These observations were confirmed by RT-qPCR, revealing the increase of both COL1A and LAMC1 expression in the 2 cell lines in 3D compared with 2D cultures (Figure 2C). Altogether, the cellular capsule technology emerges as a valuable approach to produce cohesive lymphoma spheroids from B-NHL.
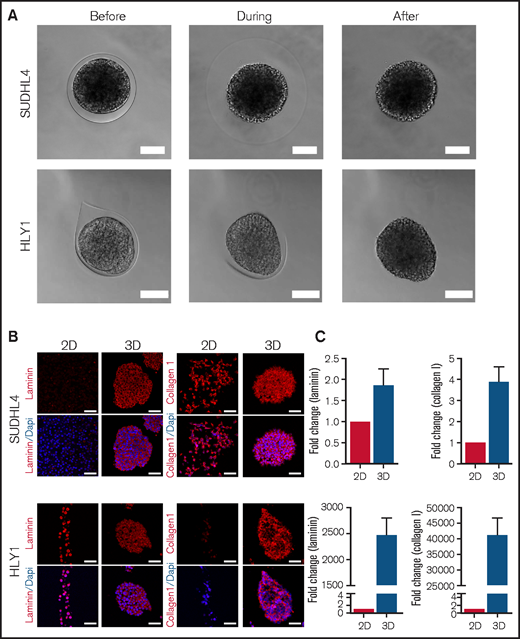
B-NHL spheroids are cohesive and express extracellular matrix. (A) Pictures showing the maintenance of SUDHL4 and HLY1 spheroids after capsule dissolution by incubation in Phosphate Buffered Saline (PBS) containing 1 mM EGTA. Scale bar, 100 µm. (B) Immunostaining showing the expression of extracellular matrix in cells cultured in suspension (2D) or in spheroids (3D). Extracellular matrix components were visualized by staining with anti-pan Laminin and anti-Collagen I antibodies on 5µm thick sections of spheroids embedded in paraffin. Nuclei are depicted in blue. Scale bar, 50 µm. (C) RT-qPCR revealing the upregulation of LAMC1 and COL1A expression in SUDHL4 and HLY1 cultured in 3D compared with 2D (n = 3).
B-NHL spheroids are cohesive and express extracellular matrix. (A) Pictures showing the maintenance of SUDHL4 and HLY1 spheroids after capsule dissolution by incubation in Phosphate Buffered Saline (PBS) containing 1 mM EGTA. Scale bar, 100 µm. (B) Immunostaining showing the expression of extracellular matrix in cells cultured in suspension (2D) or in spheroids (3D). Extracellular matrix components were visualized by staining with anti-pan Laminin and anti-Collagen I antibodies on 5µm thick sections of spheroids embedded in paraffin. Nuclei are depicted in blue. Scale bar, 50 µm. (C) RT-qPCR revealing the upregulation of LAMC1 and COL1A expression in SUDHL4 and HLY1 cultured in 3D compared with 2D (n = 3).
Tumor B-cell and stromal cell co-encapsulation and self-organization promote spheroid growth
Since B-NHL are organized as mixed aggregates of tumor cells and lymphoma-supportive non-malignant components,8 we decided to aim for a more physiopathological model by introducing lymphoid stromal cells isolated from human tonsils (TSC)25 and ECM components (Matrigel). Lymphoma cell growth, evaluated by cell counting, was differentially regulated by the presence of ECM and stromal cells. The addition of ECM in capsules had no impact on spheroid formation whatever the cell line studied. However, the presence of ECM and stromal cells significantly increased the growth kinetic of SUDHL4 spheroids, and they even promoted DOHH2-derived spheroid formation and growth, whereas they had no impact on HLY1 spheroid growth (Figure 3A). These results suggest that our 3D model recapitulates the variability of TSC-dependence among B-cell NHL.31
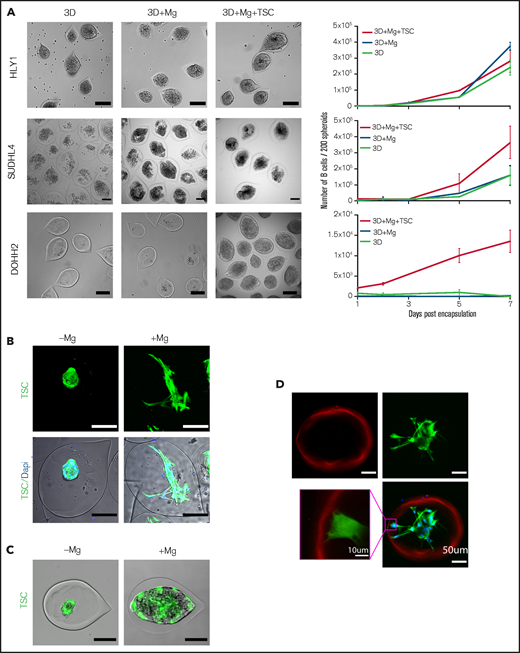
The establishment of a stromal network is necessary to reproduce stromal-dependent B-NHL cell growth. (A) Effect of Matrigel (Mg) and TSC on spheroid growth. Left panel, representative images of spheroids obtained from B cells encapsulated alone (3D) or with Mg (3D+Mg) or with Mg+TSC (3D+Mg+TSC) at D7 (HLY1), D6 (SUDHL4), or D10 (DOHH2) of culture. Scale bar, 200 µm. Right panel, the B cell number was evaluated over time in the different conditions (n = 3). (B) TSC network needs Mg to be established. Left, example of GFP-TSC encapsulated without Mg and B-cells. Right, example of TSC encapsulated with Mg but without B-cells. TSC were visualized in green by stable expression of GFP, and nuclei were stained in blue with Hoechst 33252. Capsules were imaged 3 days after encapsulation. Images were maximum intensity projection from z-stacks. Scale bar, 100 µm. (C) TSC network is necessary to induce DOHH2 spheroid growth. DOHH2 cells were coencapsulated with TSC-GFP with or without Mg for 10 days. TSC were visualized in green by stable expression of GFP. (D) TSC/Mg interaction. GFP-TSC were encapsulated alone in the presence of Mg. After 3 days in culture, capsules were fixed and immunofluorescence was performed. Mg and TSC were visualized by staining with anti-human pan laminin (in red) and anti-GFP (in green), respectively. Nuclei were counterstained in blue with Hoechst 33258. Images were maximum intensity projection from z-stacks. Scale bar, 50 µm. Yellow square is a crop showing the anchoring of TSC on Mg coating. Scale bar, 10 µm.
The establishment of a stromal network is necessary to reproduce stromal-dependent B-NHL cell growth. (A) Effect of Matrigel (Mg) and TSC on spheroid growth. Left panel, representative images of spheroids obtained from B cells encapsulated alone (3D) or with Mg (3D+Mg) or with Mg+TSC (3D+Mg+TSC) at D7 (HLY1), D6 (SUDHL4), or D10 (DOHH2) of culture. Scale bar, 200 µm. Right panel, the B cell number was evaluated over time in the different conditions (n = 3). (B) TSC network needs Mg to be established. Left, example of GFP-TSC encapsulated without Mg and B-cells. Right, example of TSC encapsulated with Mg but without B-cells. TSC were visualized in green by stable expression of GFP, and nuclei were stained in blue with Hoechst 33252. Capsules were imaged 3 days after encapsulation. Images were maximum intensity projection from z-stacks. Scale bar, 100 µm. (C) TSC network is necessary to induce DOHH2 spheroid growth. DOHH2 cells were coencapsulated with TSC-GFP with or without Mg for 10 days. TSC were visualized in green by stable expression of GFP. (D) TSC/Mg interaction. GFP-TSC were encapsulated alone in the presence of Mg. After 3 days in culture, capsules were fixed and immunofluorescence was performed. Mg and TSC were visualized by staining with anti-human pan laminin (in red) and anti-GFP (in green), respectively. Nuclei were counterstained in blue with Hoechst 33258. Images were maximum intensity projection from z-stacks. Scale bar, 50 µm. Yellow square is a crop showing the anchoring of TSC on Mg coating. Scale bar, 10 µm.
We next sought to decipher how stromal cells play a supportive role on DOHH2 spheroid formation. DOHH2 cells were coencapsulated with TSC in the presence or absence of a layer of Matrigel anchored to the inner wall of the capsules.23 In the absence of Matrigel, the capsule wall remained cell-repellent, and stromal cells formed clusters inside the capsules but were unable to induce DOHH2 spheroid growth (Figure 3B-C). By contrast, in the presence of Matrigel, TSC anchored and spread onto ECM, leading to the formation of a ramified 3D network that subsequently supported B-cell proliferation (Figure 3 B-D; supplemental Video 3-4). We then monitored the stromal cell network dynamic by imaging capsules after 2, 24, 48, 72, and 96 hours of culture using confocal microscopy (Figure 4A). By solely focusing on stromal cells, we performed 3D + time image analysis and measured sphericity and branchness that both characterized the evolution of the stromal cell network complexity. High sphericity index indicated a compact morphology of the stromal network, thus offering a limited surface of interaction with B cells. Conversely, high branchness index was associated with a ramified network that increased the probability of B-cell stromal cell physical contacts. Stromal cell morphology was significantly modified as early as 24 hours after encapsulation, as revealed by the opposite variation of the sphericity and branchness indexes (Figure 4B-C). In addition, after a rapid initial change, both parameters underwent a slower but continuous evolution in the same correlated manner, indicating that the increased branching architecture of the stromal network was not a disorganized and random feature but was sustained by a self-organization process (Figure 4D).
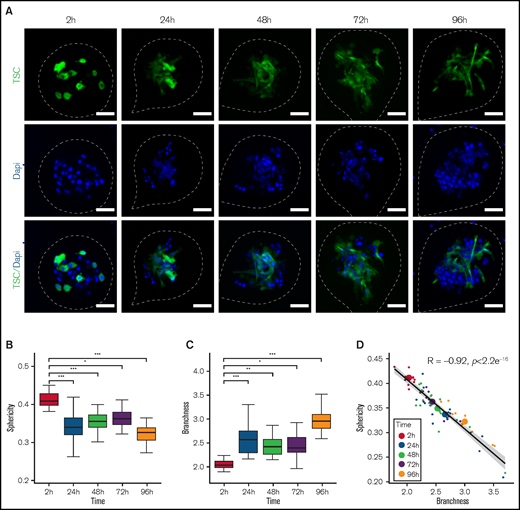
Self-organization of the stromal network. (A) Representatives images of capsules containing DOHH2 with Mg and GFP-TSC at different culture time point. After fixation, 10 to 18 spheroids for each time point were placed in an Universlide. Images shown are Z-projections. TSC are shown in green and all the analyses were performed on green signal exclusively. Nuclei of DOHH2 and TSC cells were counterstained in blue with Hoechst 33258. The edges of the capsule are depicted by white dashed lines. Scale bar, 50 µm. (B-C) Sphericity and branchness indexes of green particles contained in spheroids at different times after encapsulation, respectively. To determine significant differences, an analysis of variance was performed (*P < .05, **P < .01, ***P < .001). (D) Correlation of sphericity and branchness. For each time point, small dots represent individual spheroids whereas big dots represent the average values of all spheroids for a given time point. Pearson correlation coefficient (R) was calculated using R software. The black line represents the regression line and the gray area represents the 95% confidence interval of the linear regression.
Self-organization of the stromal network. (A) Representatives images of capsules containing DOHH2 with Mg and GFP-TSC at different culture time point. After fixation, 10 to 18 spheroids for each time point were placed in an Universlide. Images shown are Z-projections. TSC are shown in green and all the analyses were performed on green signal exclusively. Nuclei of DOHH2 and TSC cells were counterstained in blue with Hoechst 33258. The edges of the capsule are depicted by white dashed lines. Scale bar, 50 µm. (B-C) Sphericity and branchness indexes of green particles contained in spheroids at different times after encapsulation, respectively. To determine significant differences, an analysis of variance was performed (*P < .05, **P < .01, ***P < .001). (D) Correlation of sphericity and branchness. For each time point, small dots represent individual spheroids whereas big dots represent the average values of all spheroids for a given time point. Pearson correlation coefficient (R) was calculated using R software. The black line represents the regression line and the gray area represents the 95% confidence interval of the linear regression.
B-NHL sensitivity to chemotherapy in 3D vs 2D cell culture
To determine whether the 3D architecture could alter the drug response of lymphoma B cells, we evaluated the effect of doxorubicin, one of the components of the CHOP multidrug therapy, on cell death of B-NHL cell lines cultured in 2D or 3D at confluence. We revealed that the IC50 for doxorubicin increased in SUDHL4 and HLY1 cells cultured in 3D without ECM and TSC compared with 2D after 24 hours or 48 hours of treatment (supplemental Figure 6). However, no additional effect was observed in the presence of TSC (Figure 5A-C). Similar increase of resistance to doxorubicin was obtained after treatment of DOHH2 with doxorubicin in 3D with TSC compared with 2D with TSC. This tumor-supporting activity of 3D coculture was not observed when the BCL2 inhibitor ABT-199 was used, suggesting that malignant B cells retained their dependence on BCL2 for survival in 3D+TSC conditions (Figure 5D).
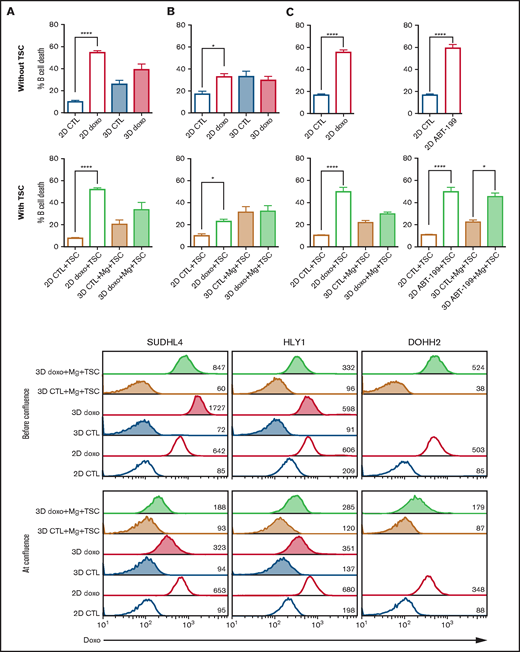
Impact of 3D culture on drug response in B-NHL. (A-C) Comparison of B-cell death induced by doxorubicin in SUDHL4 (A), HLY1 (B), and DOHH2 (C) cultured in 2D or in 3D alone (upper panel) or with TSC and Matrigel (2D+TSC or 3D+Mg+TSC) (lower panel). For 2D culture, B cells were seeded alone or in the presence of TSC. For 3D culture, 100 confluent capsules, containing B cells alone or B cells with TSC in the presence of Matrigel, were seeded. 2D and 3D cultures were exposed to doxorubicin at a concentration corresponding to its IC50, and GFPneg B-cell death was evaluated after 24 hours by flow cytometry. (D) Comparison of cell death induced by ABT-199 (1 µM) in DOHH2 cells cultured in 2D alone (upper panel) or in 2D+TSC or 3D+TSC+Matrigel (lower panel) at confluency, for 24 hours. The data represent mean ± standard error of, at least, 3 independent experiments (Wilcoxon test, *P < .05, ****P < .0001). (E) Doxorubicin diffusion in spheroids. Flow cytometry analyses of doxorubicin fluorescence in cells cultured in suspension (2D) or in 3D alone (3D) or in 3D with Matrigel and TSC (3D+ Mg+TSC) before confluence (D4) or at confluence (D9-D10) and treated with 1µg/ml doxorubicin for 4 hours. Numbers represent the median fluorescence intensity of cells.
Impact of 3D culture on drug response in B-NHL. (A-C) Comparison of B-cell death induced by doxorubicin in SUDHL4 (A), HLY1 (B), and DOHH2 (C) cultured in 2D or in 3D alone (upper panel) or with TSC and Matrigel (2D+TSC or 3D+Mg+TSC) (lower panel). For 2D culture, B cells were seeded alone or in the presence of TSC. For 3D culture, 100 confluent capsules, containing B cells alone or B cells with TSC in the presence of Matrigel, were seeded. 2D and 3D cultures were exposed to doxorubicin at a concentration corresponding to its IC50, and GFPneg B-cell death was evaluated after 24 hours by flow cytometry. (D) Comparison of cell death induced by ABT-199 (1 µM) in DOHH2 cells cultured in 2D alone (upper panel) or in 2D+TSC or 3D+TSC+Matrigel (lower panel) at confluency, for 24 hours. The data represent mean ± standard error of, at least, 3 independent experiments (Wilcoxon test, *P < .05, ****P < .0001). (E) Doxorubicin diffusion in spheroids. Flow cytometry analyses of doxorubicin fluorescence in cells cultured in suspension (2D) or in 3D alone (3D) or in 3D with Matrigel and TSC (3D+ Mg+TSC) before confluence (D4) or at confluence (D9-D10) and treated with 1µg/ml doxorubicin for 4 hours. Numbers represent the median fluorescence intensity of cells.
Impaired diffusion of doxorubicin within the spheroids and resulting decrease in the local concentration of the drug could be the cause of its reduced anti-tumor activity in 3D. We took advantage of the fluorescent properties of doxorubicin to compare its drug penetration in cells cultured in 2D and 3D in the presence or absence of ECM and TSC. Before confluence, we observed no difference in doxorubicin staining between cells cultured in 2D vs 3D or 3D+ECM+TSC, indicating that the alginate shell did not impede drug diffusion. However, at confluence, cells cultured in 3D or 3D+ECM+TSC exhibited a decrease in doxorubicin staining compared with cells in 2D (Figure 5E). Altogether, these results suggest that in these conditions of high cell density doxorubicin resistance largely relies on altered drug diffusion inside spheroids.
Microencapsulated 3D cocultures recapitulate features of primary FL B cells
In order to better define how 3D and TSC impacted B-NHL growth in vitro, we compared by RNAseq the GEP of HLY1 and DOHH2 maintained in 2D vs 3D culture with or without TSC. Unsupervised principal component analysis nicely segregated HLY1 maintained in 2D without TSC (H2D), from HLY1 maintained in 2D with TSC (HT2D), and HLY1 encapsulated in 3D spheroids (supplemental Figure 7). However, HLY1 displayed a very similar GEP in 3D culture system, whatever the presence of TSC and ECM, in agreement with the complete lack of impact of TSC on HLY1 cell growth within spheroids (Figure 3A). DOHH2 maintained in 2D without (D2D) or with (DT2D) TSC, and DOHH2 seeded in alginate spheroids with TSC and ECM (DT3D) exhibited a distinct GEP. We used GSEA to identify the molecular pathways underlying the specific gene signatures identified by DESeq2 analysis of these RNA-sequence data (supplemental Table 1). Concerning HLY1, the same pathways were induced by 3D culture, whatever the presence of TSC and ECM, including numerous cell signatures related to cell proliferation, together with TNF/NF-κB pathway (Figure 6A). These data were confirmed by analyzing the enrichment for transcription factor (TF) targets, identifying several TF involved in cell proliferation as more active in H3D and HT3D than in their 2D counterparts (Figure 6B). Conversely, for DOHH2, whereas DT3D upregulated cell proliferation pathways compared with DT2D, this was not associated with an additional activation of NF-κB pathway that was dependent on the contact with TSC (Figure 6C). Moreover, TSC upregulated genes associated with TGF-β signaling pathway and hypoxia as shown by the direct comparison of DT2D and D2D conditions. These data were confirmed by analyzing TF target enrichment, identifying NF-κB and SMAD members as activated by the contact of DOHH2 with TSC in both 2D and 3D conditions (Figure 6D). Of note, genes downregulated by TSC in DOHH2 reflected a decreased cell proliferation (supplemental Figure 8), confirming that the combination of TSC and 3D organized the best supportive niche for this FL B-cell line by triggering both proliferation and TNF/TGFβ pathways. Conversely, TSC did not trigger GEP modifications reflecting cell proliferation inhibition in HLY1 in 2D nor 3D (data not shown). To further increase the relevance of our data, we analyzed the molecular pathways activated in purified FL B cells compared with purified normal centrocytes using already published Affymetrix microarray data12,26 (Figure 6E). Interestingly, TNF/NF-κB, hypoxia, and TGFβ belonged to the top pathways significantly enriched in FL GEP, as reported for DOHH2 maintained in 3D spheroids with TSC, suggesting that our spheroid culture model mimicked, at least partly, the context of FL LN.
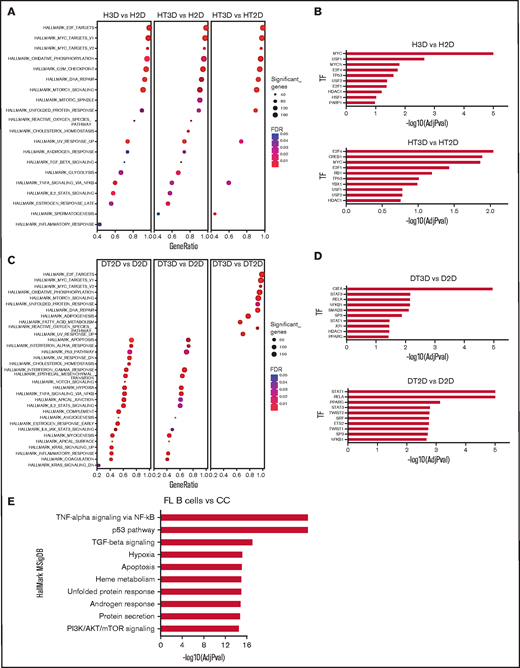
Phenotypic characterization of DOHH2 and HLY1 in the 3D coculture model. (A) The H3D (HLY1 in 3D) vs H2D (HLY1 in 2D), HT3D (HLY1 in 3D with TSC) vs H2D (HLY1 in 2D), and HT3D vs HT2D (HLY1 in 2D with TSC) gene signatures were analyzed by GSEA using HallMark MSigDB. (B) Enrichment of transcription factor (TF) targets in HLY1 signatures as determined using TRRUST database with EnrichR website. The 10 more significant predicted TF are represented. (C) The DT2D (DOHH2 in 2D with TSC) vs D2D (DOHH2 in 2D with TSC), DT3D (DOHH2 in 3D with TSC) vs D2D (DOHH2 in 2D), and DT3D vs DT2D gene signatures were analyzed by GSEA using HallMark MSigDB. (D) Enrichment of TF targets in DOHH2 signatures as determined using TRRUST database with EnrichR website. The 10 more significant predicted TF are represented. (E) Upregulated gene pathways identified by GSEA using in HallMark MSigDB in FL B cells vs centrocytes based on Affymetrix microarray data. The 10 more significant predicted pathways are represented.
Phenotypic characterization of DOHH2 and HLY1 in the 3D coculture model. (A) The H3D (HLY1 in 3D) vs H2D (HLY1 in 2D), HT3D (HLY1 in 3D with TSC) vs H2D (HLY1 in 2D), and HT3D vs HT2D (HLY1 in 2D with TSC) gene signatures were analyzed by GSEA using HallMark MSigDB. (B) Enrichment of transcription factor (TF) targets in HLY1 signatures as determined using TRRUST database with EnrichR website. The 10 more significant predicted TF are represented. (C) The DT2D (DOHH2 in 2D with TSC) vs D2D (DOHH2 in 2D with TSC), DT3D (DOHH2 in 3D with TSC) vs D2D (DOHH2 in 2D), and DT3D vs DT2D gene signatures were analyzed by GSEA using HallMark MSigDB. (D) Enrichment of TF targets in DOHH2 signatures as determined using TRRUST database with EnrichR website. The 10 more significant predicted TF are represented. (E) Upregulated gene pathways identified by GSEA using in HallMark MSigDB in FL B cells vs centrocytes based on Affymetrix microarray data. The 10 more significant predicted pathways are represented.
Microencapsulated 3D cocultures enable primary FL B-cell survival
A major challenge in studying primary FL B cells is to maintain them in culture long enough to perform functional experiments. Based on the data obtained with the DOHH2 cell line, we encapsulated FL B cells purified from 2 patients (FL1 and FL2) with Matrigel and TSC and compared the evolution of the B-cell number in 3D with that obtained in 2D with or without TSC. FL B cells were found admixed with stromal cells within 3D spheroids at both Day 3 and Day 14 and showed a good cell viability with less than 10 dead cells/capsule at each time point for both FL samples (Figure 7A; supplemental Video 5-6). The number of FL B cells decreased over time but after 2 weeks 3D spheroids still contained ∼50% of the number of FL B cells quantified at Day 3 (FL1: D3: 127 ± 13 9. cells per capsule vs D14: 53 ± 11.4 cells per capsule; FL2: D3: 102.7 ± 19.1 cells per capsule vs D14: 47 ± 8.7 cells per capsule), while the number of TSC remained stable. Importantly, the number of FL B cells at Day 11 in 3D coculture with TSC was higher than in 2D without TSC and seemed to be even slightly higher than in 2D with TSC (Figure 7B). These observations constitute a proof-of-concept that cellular capsule technology might be a promising approach to study FL cell physiopathology in a 3D context.
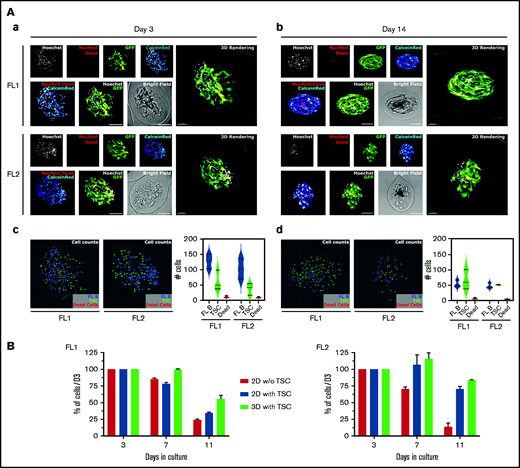
Primary FL cell survival in cellular capsules. (A) Imaging of purified FL B cells coencapsulated with TSC after 3 days (a) and 14 days (b) of encapsulation. Multicolor live/dead (CalceinRed/NucRed Dead) imaging of patient B cells with GFP-TSC and nuclei counterstaining with Hoechst were depicted. Spheroids were imaged on a spinning disk microscope (Aa) and on a confocal microscope (Ab) with equivalent settings (spectral windows and physical dimensions). Individual channels are depicted on the top, overlays of NucRed Dead and Calcein Red and of Hoechst and GFP on the lower panels. Individual cell analysis after 3 days (c) and 14 days (d) in culture. Renderings of nuclei centers projected in 2D as colored spheres (FL B: blue, TSC: green, Dead cells: red). Three capsules of each FL type were counted and averaged counting were plotted. (B) Evolution of the number of primary FL B cells cultured in suspension or in capsules. Cells were cultured in suspension alone or with GFP-TSC or in capsules with Matrigel and GFP-TSC for various duration. The GFPneg FL B-cell number was determined by flow cytometry with count beads, after trypsinization of cells or capsule dissolution and Hoechst 33258 staining for gating on live cells.
Primary FL cell survival in cellular capsules. (A) Imaging of purified FL B cells coencapsulated with TSC after 3 days (a) and 14 days (b) of encapsulation. Multicolor live/dead (CalceinRed/NucRed Dead) imaging of patient B cells with GFP-TSC and nuclei counterstaining with Hoechst were depicted. Spheroids were imaged on a spinning disk microscope (Aa) and on a confocal microscope (Ab) with equivalent settings (spectral windows and physical dimensions). Individual channels are depicted on the top, overlays of NucRed Dead and Calcein Red and of Hoechst and GFP on the lower panels. Individual cell analysis after 3 days (c) and 14 days (d) in culture. Renderings of nuclei centers projected in 2D as colored spheres (FL B: blue, TSC: green, Dead cells: red). Three capsules of each FL type were counted and averaged counting were plotted. (B) Evolution of the number of primary FL B cells cultured in suspension or in capsules. Cells were cultured in suspension alone or with GFP-TSC or in capsules with Matrigel and GFP-TSC for various duration. The GFPneg FL B-cell number was determined by flow cytometry with count beads, after trypsinization of cells or capsule dissolution and Hoechst 33258 staining for gating on live cells.
Discussion
Lymphomas develop as complex cell structures including tumor cells and their microenvironment within mechanically constrained LN. Previous lymphoma spheroid models incorporating only malignant B cells17,18,32 suggest that the 3D cell architecture is a key feature for the regulation of lymphoma growth and therapeutic response. LN are highly dynamic structures expanding and becoming mechanically stiff under immune cell recruitment and proliferation, whereas immune response resolution is associated with LN contraction and return to a baseline of mechanical softness.33 LN mechanical properties rely on several determinants, including the external constraint of the capsule and the internal tension created by the TSC network able to produce and contract ECM. Mechanosensing has been recently demonstrated to control T-cell activation and metabolism,34 and mechanical forces are involved in both T-cell receptor35 and B-cell receptor36 signaling. Mouse models of FL and DLBCL cannot entirely recapitulate the biology of these tumors37 and, due to their inherent complexity and cost, they are not suitable to study specific cell interactions contributing to the organization of lymphoma cell niche or to perform drug screening. The development of 3D lymphoma models including mechanical constraints is therefore of particular relevance to advance the understanding and treatment of these neoplasia. In the present work, we adapted a microfluidic approach to recapitulate the lymphoma microenvironment in hollow, permeable alginate shells, forming high-throughput (∼5000/s), size-controlled, and easy to handle spheroids.22 Such a strategy is ideally suited for drug testing, and the versatility of the technique allows generating 3D monocultures (ie, from tumor B cells only) or cocultures and to evaluate the impact of ECM.
First, the proliferation of malignant B cells alone within spheroids results in cohesive multicellular aggregates promoted by the over-secretion of ECM in 3D compared with 2D cultures. Although expression and secretion of ECM have been mainly described in stromal cells, we demonstrated here that lymphoma B cells display a similar ability, as already proposed for normal plasmablasts38 and plasma cells,39 or leukemic B cells.40 How ECM expression is regulated remains unclear. We could, however, hypothesize that it may originate from the activation of a mechanotransduction pathway as already described in other cell types.41,42 Remarkably, alginate capsules are elastic, meaning that cell growth past confluence dilates the capsule, which conversely applies a compressive force onto the spheroid.22 Although not investigated in depth, we observed that the cohesion of spheroids was stronger for post-confluent capsules, which would support this mechanotransduction hypothesis.
Second, as previously reported using other 3D models, some B-cell lines were unable to grow and form spheroids when maintained alone in capsules, reproducing the strong dependency of FL on their niche for survival and growth. Guided by our previous studies showing that lymphoid-like stromal cells have a supportive effect on FL B cells,10,25,43 we added TSC to generate hybrid stroma-tumor 3D lymphoma models. Interestingly, our 3D model reproduced the different levels of NHL microenvironment dependency, mimicking the biology of aggressive versus indolent lymphomas.7 By contrast with other 3D culture approaches that consist of embedding cells in an ECM scaffold,17,19,44,45 our alginate spheroid model allows cell motions and interactions, leading to an early self-organization of a stroma-tumor B-cell network that could organize localized 3D niches, promoting cell interactions within the spheroids.
The 3D-induced drug resistance has been already reported in solid cancers and hematological malignancies.17,19,46 We confirmed here that the sensitivity to doxorubicin dramatically dropped when cells were cultured in 3D compared with 2D in all investigated B-NHL cell lines. The lack of doxorubicin effect in 3D was at least partly due to a diffusion impairment of the drug caused by the high cell density and ECM secretion in late spheroids and acting as a barrier to drug diffusion. This mimics what is known in tumors where not all the cancer cells are exposed to the same concentration of drugs because of poor drug diffusion through the ECM,47 causing the tumor to relapse or develop drug resistance. By contrast, the proapoptotic activity of ABT-199, mediating the dissociation of BCL2 with the proapoptotic BH3 only proteins, was maintained in 3D cocultures. This could be attributed to the ability of ABT-199 to induce apoptosis, thus creating channels for drug diffusion inside spheroids, suggesting that ABT-199 could be efficient in patients. Although, the results of the phase 2 CONTRALTO study48 did not demonstrate a clear benefit of venetoclax addition to bendamustine and Rituximab, and clinical studies have to be pursued by optimizing the dosage of venetoclax and better selecting patients according to their molecular profiles as it was recently done in the phase 2 CAVALLI clinical trial in DLBCL.49 Finally, recent preliminary data concerning the combination of venetoclax with ibrutinib in relapsed or refractory FL seem promising.50 More generally, the cellular capsule technology adapted for lymphoma 3D culture seems a useful high-throughput platform to screen new therapeutic approaches in B-NHL, taking into account the dynamic crosstalk between tumor cells and their supportive microenvironment.
Interestingly, a thorough analysis of malignant B-cell GEP revealed a complementary effect of TSC and 3D culture on the growth of DOHH2 cell line. Whereas we cannot examine the direct impact of 3D constraint alone on DOHH2, it was shown to trigger a massive activation of cell proliferation pathways in HLY1. Conversely, TSC reduced expression of TF and gene pathways associated with cell cycle progression in DOHH2, a suppressive activity already reported in coculture of B-cell NHL with bone marrow mesenchymal stromal cells (BM-MSC).51 However, TSC activated the NF-κB pathway, a process previously involved with the anti-apoptotic activity of BM-MSC on primary lymphoma B cells52,53 and that could be required in 3D conditions, when very few cells were encapsulated in each spheroid. As a whole, the combination of 3D and TSC triggered a GEP close to that of primary FL B cells in the DOHH2 cell line, including in particular a deregulation of TNF/NF-κB, hypoxia, and TGF-β/SMAD. Whereas cell-intrinsic or TME-dependent NF-κB activation is a well-described hallmark of B-NHL, FL tumor niche GEP was only recently found enriched for gene networks related to TGFβ signaling.54 Moreover, TGFβ could contribute to the priming by FL B cells of BM-MSC and LN stromal cells into tumor-supportive stromal niches.12,55 Finally, one study describes an upregulation and an activation of SMAD1 in malignant FL B cells,56 suggesting that TGF-β signaling could play a major role in the interplay between B cells and stromal cells in FL. How TSC are phenotypically and functionally remodeled by malignant B cells during 3D coculture remains to be explored. This proximity between DOHH2 cocultured with TSC in 3D and FL B cells prompted us to evaluate whether our spheroid model could allow the survival of primary lymphoma cells. Interestingly, we demonstrated for the first time that purified FL B cells could be maintained in vitro in 3D conditions in a model allowing high-throughput drug testing and follow-up of cell behavior and phenotypic evolution.
Acknowledgments
The authors thank Stéphanie Durand-Panteix for her technical support with transduction experiments. They thank Atika Zouine and Vincent Pitard for technical assistance at the Flow cytometry facility, CNRS UMS 3427, INSERM US 005, University of Bordeaux, Bordeaux, France. They acknowledge the Bordeaux Imaging Center, a service unit of the CNRS-INSERM and Bordeaux University, member of the national infrastructure France BioImaging supported by the Agence Nationale de la Recherche (ANR-10-INBS-04). Cell sorting was performed at the Biosit Flow Cytometry and Cell Sorting Facility CytomeTRI (UMS 6480 Biosit, Rennes, France). High-throughput sequencing has been performed by the ICGex NGS platform of the Institut Curie supported by the grants ANR-10-EQPX-03 (Equipex) and ANR-10-INBS-09-08 (France Génomique Consortium) from the ANR, by the Institut Thématique Multiorganisme (ITMO)-CANCER, and by the SiRIC-Curie program (SiRIC Grant INCa-DGOS-4654). The authors are indebted to the Centre de Ressources Biologiques (CRB)-Santé (BB-0033-00056) of Rennes hospital for the processing of biological samples.
This work was supported by INSERM, University of Bordeaux, Ligue Régionale contre le Cancer (comités de Gironde, Charentes, Pyrénées, Landes), the Fondation ARC pour la Recherche sur le Cancer (Grant PGA1 RF20170205386), the Institut National du cancer (INCa Grant PNP-19-009), the Leukemia & Lymphoma Society (LLS, Grant TRP 6593-20), Emergence Grand Sud Ouest (GSO) Cancéropole, and the Site de Recherche Intégrée sur le Cancer de Bordeaux (SIRIC BRIO). S.L. is supported by Ligue Nationale contre le Cancer. C.L. is a recipient of a doctoral fellowship from the Fédération Hopsitalo-Universitaire Cancer Microenvironment & Innovation (FHU CAMIn). L. Broca-Brisson of a master fellowship from CNRS Groupe de Recherche (GDR) Imabio. J.S.V. is funded by the Infrastructure eCellFrance of the Agence Nationale de la Recherche (ANR-11-INSB-005). The 3D capsules were obtained from the VoxCell Organoïds Plateform, a service of the CNRS-INSERM and University of Bordeaux - UMS TBMCore 3427.
Authorship
Contribution: L. Bresson-Bepoldin, K.T., P.N., F.M., and G.R. designed the research, supervised the study, and wrote the paper; C.L., S.L., V.L.M., F.M., and L. Bresson-Bepoldin performed experiments, analyzed the data, and wrote the paper; N.H., C.M., I.M., C.D., L. Broca-Brisson, C.P., M.S., M.C., L.A., G.R., L.D., E.D., and K.A. performed experiments; P.S. and J.P.M. gave insightful advice and participated in the conduction of the study; S.B. and P.L. performed RNA-sequence; and J.S.V. analyzed RNA-sequence data.
Conflict-of-interest disclosure: The authors declare no competing financial interests.
The current affiliation for S.L. is Institute of Biomedical Engineering, University of Toronto, Toronto, Canada.
The current affiliation for L. Broca-Brisson is University Paris-Saclay, CEA, Département Médicaments et Technologies pour la Santé (DMTS), Service de Pharmacologie et Immunoanalyse (SPI), Gif-sur-Yvette, France.
The current affiliation for K.A. is TreeFrog Therapeutics, Pessac, France.
The current affiliation for L. Bresson-Bepoldin is University of Bordeaux, INSERM U1053 BARITON, CNRS, Bordeaux, France.
Correspondence: Laurence Bresson-Bepoldin, Universités de Bordeaux, INSERM U1053 BARITON, 146 rue Léo Saignat, 33076 Bordeaux cedex; e-mail: laurence.bresson-bepoldin@inserm.fr; Karin Tarte, INSERM, UMR U1236, Faculté de Médecine, 2 Ave du Pr Léon Bernard, F-35043 Rennes; e-mail: karin.tarte@univ-rennes1.fr; and Gaëlle Recher, LP2N - UMR 5298, CNRS, IOGS & Univ Bordeaux, rue François Mitterrand, 33400 Talence, France; e-mail: gaelle.recher@institutoptique.fr.

