

Key Points
Despite poor end-of-induction MRD, DUX4 B-ALL has excellent outcome.
PAX5alt B-ALL with IKZF1 codeletion is associated with poor outcome, which can be improved by treatment intensification.

Abstract
Among the recently described subtypes in childhood B-lymphoblastic leukemia (B-ALL) were DUX4- and PAX5-altered (PAX5alt). By using whole transcriptome RNA sequencing in 377 children with B-ALL from the Malaysia-Singapore ALL 2003 (MS2003) and Malaysia-Singapore ALL 2010 (MS2010) studies, we found that, after hyperdiploid and ETV6-RUNX1, the third and fourth most common subtypes were DUX4 (n = 51; 14%) and PAX5alt (n = 36; 10%). DUX4 also formed the largest genetic subtype among patients with poor day-33 minimal residual disease (MRD; n = 12 of 44). But despite the poor MRD, outcome of DUX4 B-ALL was excellent (5-year cumulative risk of relapse [CIR], 8.9%; 95% confidence interval [CI], 2.8%-19.5% and 5-year overall survival, 97.8%; 95% CI, 85.3%-99.7%). In MS2003, 21% of patients with DUX4 B-ALL had poor peripheral blood response to prednisolone at day 8, higher than other subtypes (8%; P = .03). In MS2010, with vincristine at day 1, no day-8 poor peripheral blood response was observed in the DUX4 subtype (P = .03). The PAX5alt group had an intermediate risk of relapse (5-year CIR, 18.1%) but when IKZF1 was not deleted, outcome was excellent with no relapse among 23 patients. Compared with MS2003, outcome of PAX5alt B-ALL with IKZF1 codeletion was improved by treatment intensification in MS2010 (5-year CIR, 80.0% vs 0%; P = .05). In conclusion, despite its poor initial response, DUX4 B-ALL had a favorable overall outcome, and the prognosis of PAX5alt was strongly dependent on IKZF1 codeletion.
Introduction
The most common type of cancer in children is B-cell lymphoblastic leukemia (B-ALL). B-ALL is biologically heterogeneous, driven by recurrent chromosomal aneuploidies, specific oncogene fusions, or more recently described point mutations.1 These specific, recurrent genetic changes give rise to multiple genetic subtypes. Techniques based on next-generation sequencing have revealed the presence of >20 different subtypes of B-ALL, each with its own specific risk of relapse.
In 2002, we first described the unique gene expression signature of a novel group of B-ALLs.2 It took 14 years to finally determine that this novel group is driven by the excessive expression of rearranged DUX4.3-5 The challenge in elucidating the driver of DUX4 B-ALL was its highly varied fusion junction and the relatively small size of the genome that is structurally affected. Its most common fusion is with the highly variable IGH gene, which could be deciphered only by using next-generation sequencing. DUX4 drives leukemogenesis by dysregulating ERG, either directly or more commonly with deletion of the ERG gene.5
PAX5 is commonly deleted in many subtypes of B-ALL such as ETV6-RUNX1. In these subtypes, PAX5 deletion is a cooperative mutation, not a driver mutation. However, 2 subtypes of B-ALL have distinct alterations in the PAX5 gene as the driver: the PAX5-altered (PAX5alt) and the PAX5 P80R point mutation subtypes.6-8 Using gene expression profiling, PAX5alt and PAX5 P80R are genetically distinct. The PAX5alt subtype commonly has codeletion of the IKZF1 and CDKN2A/B genes, giving rise to the poorer outcome IKZF1plus subtype.9 PAX5alt and PAX5 P80R are now considered as distinct genetic subtypes.
We used RNA-sequencing (RNA-seq) and multiplex-ligation– dependent probe amplification (MLPA) to analyze leukemic cells collected at diagnosis from 377 children with B-ALL treated on the Malaysia-Singapore ALL 2003 and 2010 studies (MS2003 and MS2010). We found that DUX4 and PAX5alt subtypes, which formed the third and fourth largest genetic subtypes, had unique treatment responses that influenced the way they should be treated clinically.
Methods
Patients and materials
Bone marrow (BM) or peripheral blood (PB) samples at diagnosis (n = 387, including 7 patients treated off-protocol who were consented using cell bank consents) were collected from children (younger than age 18 years) with B-ALL enrolled in the MS2003 and MS2010 studies.10,11 After subjecting the data to quality control, 377 patients qualified for analysis (Figure 1). The studies were approved by the National Healthcare Group (Singapore) domain-specific review board ref: 2004/00275, 2008/00081. Informed consent was obtained in accordance with the Declaration of Helsinki. At day 8 of remission induction, absolute blast count ≥1 × 10⁹/L was defined as poor PB response. Minimal residual disease (MRD) was quantified using real-time quantitative polymerase chain reaction (RT-qPCR) with immunoglobulin and T-cell receptor PCR targets at a sensitivity of 1 × 10⁻⁴ and interpreted according to EuroMRD guidelines.12 At the end of induction (EOI), which was at day 33, MRD >1 × 10⁻⁴ was considered positive, and MRD ≥1 × 10⁻² was designated as MRD high risk (HR).
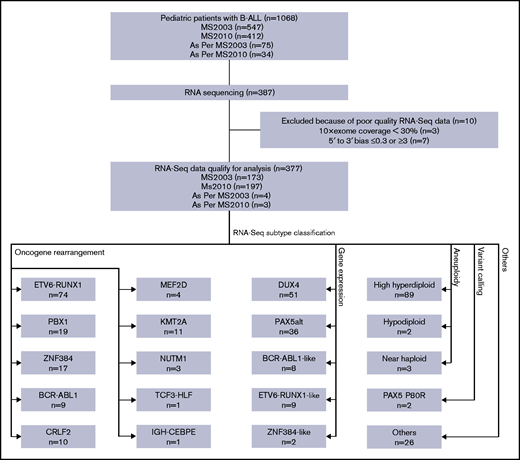
Diagram of RNA-seq and subtype classification of patients with B-ALL. RNA-seq was performed on a subset of patients with B-ALL enrolled in the MS2003 and MS2010 studies (including a few treated as per protocol). After quality control, RNA-seq data of 377 patients qualified for analysis. Patients were classified into 20 subtypes using 4 different methods. Some subtypes may be classified with multiple methods; only the leading method is indicated (Table 1).
Diagram of RNA-seq and subtype classification of patients with B-ALL. RNA-seq was performed on a subset of patients with B-ALL enrolled in the MS2003 and MS2010 studies (including a few treated as per protocol). After quality control, RNA-seq data of 377 patients qualified for analysis. Patients were classified into 20 subtypes using 4 different methods. Some subtypes may be classified with multiple methods; only the leading method is indicated (Table 1).
Conventional subtype classification
Conventional genetic subtyping was performed on diagnostic samples by using oncogene fusion panels, cytogenetics, and the DNA index. Rearrangements of ETV6-RUNX1, BCR-ABL1, TCF3-PBX1, KMT2A-MLLT3, KMT2A-AFF1 (AF4), KMT2A-MLLT1 (ENL), and KMT2A-MLLT3 (AF9) were tested by using RT-qPCR oncogene fusion panels. Cytogenetics results for samples with >50 modal chromosomes (or DNA index ≥1.16) were classified as high hyperdiploid and samples with <44 modal chromosomes were classified as hypodiploid. BCR-ABL1, KMT2A-rearranged, and hypodiploid ALL were classified as HR subtypes, and ETV6-RUNX1 and high hyperdiploid were classified as low-risk (LR) subtypes.
RNA-seq and data analysis
RNA-seq was performed on bulk diagnostic samples (without cell sorting) using TruSeq stranded messenger RNA (mRNA) library prep kit (Illumina, San Diego, CA), and the samples were sequenced using the Illumina HiSeq 2000/2500 platform with a read length of 2 × 101 or a NextSeq 500 platform with a read length of 2 × 151. Reads were mapped to the hg19 reference genome using Tophat2.13 To minimize the difference between the 2 platforms due to the read length, reads from the NextSeq 500 platform were trimmed to the same read length as HiSeq reads before alignment. Samples with low coverage (10× exonic region coverage ≤30%) or strong 5' to 3' bias (≤0.3 or ≥3) were removed (Figure 1).
The number of reads mapped to each gene were counted by using featureCounts.14 Gene expression levels were normalized by using variance stabilizing transformation from the DESeq2 package15 followed by batch effect correction using the sva package.16 To select the genes for hierarchical clustering, we first selected genes with significantly higher variance in B-ALL compared with T-cell ALL (T-ALL; n = 37) by nonparametric Conover squared ranks test17 with adjusted P value (by Holm’s method18 ) < .05. This helped exclude the genes with high but irrelevant variance (eg, variance as a result of sex, race, or circadian rhythm). The top 500 in the remaining gene set with the highest median absolute deviation were used in the hierarchical clustering, with Ward’s algorithm19 and correlation coefficient as the distance metric.
Gene rearrangements were detected using FusionCatcher.20 Variant calling based on RNA-seq data was carried out according to the GenomeAnalysisToolkit (GATK) best practices for variant calling21 and annotated with the Variant Effect Predictor.22 Briefly, reads were aligned to the hg19 reference by using 2-pass alignment by Spliced Transcripts Alignment to a Reference (STAR).23 Aligned reads were subjected to sorting by coordinate, duplicate removal, split at the splicing sites, and variant calling by HaplotypeCaller. Variations with significant strand bias (Phred-scaled P value >30), depth normalized quality score <2.0, or clustered with 3 or more in a window of 35 bases were removed. Digital karyotyping (or gross copy number variation [CNV] identification) for autosomes and chromosome X were performed using the method described by Gu et al.7
CNVs by multiplex ligation-dependent probe amplification
CNVs in IKZF1, PAX5, CDKN2A, CDKN2B, ERG, and ETV6 genes were screened using MLPA assay with SALSA probe mixes P335 and P327 (MRC-Holland, Amsterdam, The Netherlands) according to the manufacturer’s protocol. MLPA output was analyzed using Coffalyser.Net (MRC-Holland) with the default program setting and recommended cutoff values of ≤0.7 for deletion and ≥1.3 for duplication.
Statistical analysis
All statistical analyses were performed using Windows R version 3.5.2. Cumulative risk of relapse (CIR) was compared by using Gray’s test,24 and overall survival (OS) was compared by using a log-rank test.25 Competing risk regression26 and Cox regression27 were used for multivariable analysis for CIR and OS, respectively. Time-to-event was recorded from the diagnosis to relapse or death. When no event was observed, the patient was censored at the date of last contact. Resistant disease (BM blasts >5% at day 33) was considered as an event at day 1. Independence of categorical variables was tested using a χ2 test. All tests were two-sided, unless otherwise specified.
Results
Classification of B-ALL using a single platform (RNA-seq)
By using RNA-seq, we performed digital karyotyping, identification of oncogene rearrangements, gene expression unsupervised hierarchical clustering, and variant calling. We were able to classify patients into 20 genetic subtypes with specific genomic alterations (Figure 1; Table 1). The subtypes showed distinct gene expression profiles by hierarchical clustering (Figure 2).
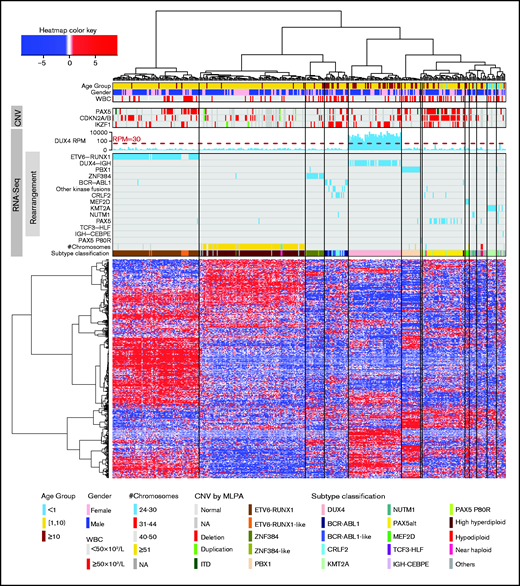
Unsupervised hierarchical clustering based on gene expression profiles. Hierarchical clustering, oncogene rearrangement identification, PAX5 P80R variant calling, gross chromosome CNV detection, and subtype classification were performed using RNA-seq data. Age, sex, presenting WBC, and CNV of PAX5, CDKN2A/B, and IKZF1 (by MLPA) are shown. These are not used in subtype classification. ITD, internal tandem duplication; NA, not available.
Unsupervised hierarchical clustering based on gene expression profiles. Hierarchical clustering, oncogene rearrangement identification, PAX5 P80R variant calling, gross chromosome CNV detection, and subtype classification were performed using RNA-seq data. Age, sex, presenting WBC, and CNV of PAX5, CDKN2A/B, and IKZF1 (by MLPA) are shown. These are not used in subtype classification. ITD, internal tandem duplication; NA, not available.
Definition and risk stratification of B-ALL subgroups using RNA-seq
| Subtype | No. (N = 377) | % | Method | Criteria | 5-y CIR (%) | 95% CI | 5-y OS (%) | 95% CI | RNA-seq risk stratification |
|---|---|---|---|---|---|---|---|---|---|
| High hyperdiploid | 89 | 24 | a | No. of chromosomes >50 | 5.5 | 1.7-12.6 | 98.8 | 91.8-99.8 | Low |
| Hypodiploid | 2 | 1 | a | No. of chromosomes 31-44 | 50.0 | 0.0-96.0 | 50.0 | 0.6-91.0 | High |
| Near haploid | 3 | 1 | a | No. of chromosomes 24-30 | 50.0 | 0.0-96.0 | 50.0 | 0.6-91.0 | High |
| ETV6-RUNX1 | 74 | 20 | b | ETV6-RUNX1 rearrangement | 5.2 | 1.3-13.1 | 100.0 | 100.0 | Low |
| ETV6-RUNX1-like | 9 | 2 | c | Coclustered with ETV6-RUNX1 rearrangement | 12.7 | 0.5-45.3 | 88.9 | 43.3-98.4 | Intermediate |
| DUX4 | 51 | 14 | c | In the cluster containing all DUX4-IGH rearrangements | 8.9 | 2.8-19.5 | 97.8 | 85.3-99.7 | Low |
| PBX1 | 19 | 5 | b | PBX1 rearrangement | 5.6 | 0.3-23.1 | 94.4 | 66.6-99.2 | Intermediate |
| ZNF384 | 17 | 5 | b | ZNF384 rearrangement | 6.3 | 0.4-25.5 | 93.3 | 61.3-99.0 | Low (EP300) Intermediate (other partners) |
| ZNF384-like | 2 | 1 | c | Coclustered with ZNF384 rearrangement | NA | NA | Intermediate | ||
| BCR-ABL1 | 9 | 2 | b | BCR-ABL1 rearrangement | 37.5 | 7.2-69.4 | 75.0 | 31.5-93.1 | High |
| BCR-ABL1-like | 8 | 2 | c+b | Coclustered with BCR-ABL1, no CRLF2 rearrangement | 37.5 | 6.9-69.8 | 75.0 | 31.5-93.1 | High |
| CRLF2 | 10 | 3 | b | CRLF2 rearrangement | 20.0 | 2.6-49.2 | 59.1 | 16.0-86.0 | High |
| MEF2D | 4 | 1 | b | MEF2D rearrangement | 0.0 | 0.0 | 100.0 | 100.0 | High |
| KMT2A | 11 | 3 | b | KMT2A rearrangement | 54.3 | 16.7-81.2 | 64.8 | 25.3-87.2 | High |
| NUTM1 | 3 | 1 | b | NUTM1 rearrangement | 0.0 | 0.0 | 100.0 | 100.0 | Intermediate |
| PAX5alt | 36 | 10 | c+a+b+d | In the cluster enriched with PAX5 alterations; no other subtype-defining events | 18.1 | 6.3-34.7 | 89.2 | 69.7-96.5 | Intermediate |
| PAX5 P80R | 2 | 1 | d+c | PAX5 P80R mutation, clustered separately | NA | NA | Intermediate | ||
| TCF3-HLF | 1 | 0.3 | b | TCF3-HLF rearrangement | NA | NA | High | ||
| IGH-CEBPE | 1 | 0.3 | b | IGH-CEBPE rearrangement | 0.0 | 0.0 | 100.0 | 100.0 | Intermediate |
| Others | 26 | 7 | a+b+c+d | Other patients | 20.7 | 7.3-39.0 | 94.1 | 65.0-99.1 | Intermediate |
The methods used to define each subgroup can be categorized into 4 types: (a) digital karyotyping, (b) identification of oncogene rearrangement, (c) gene expression profiling, and (d) variant calling. Patients whose disease had multiple features were classified according to gene expression clustering.
Distinct gene expression signatures defined 5 subtypes (Table 1): DUX4, PAX5alt, ETV6-RUNX1-like, BCR-ABL1-like, and ZNF384-like. Because the DUX4-IGH rearrangement could not be reliably identified, we defined the DUX4 (14%; n = 51) subtype as the branch containing all identified DUX4-IGH rearrangements (n = 39). After high hyperdiploid and ETV6-RUNX1, DUX4 subtype was the third most common subtype. All the patients in this branch (Figure 2) exclusively showed highly elevated expression of DUX4 with >30 reads per million mapped reads.
The branch enriched in PAX5 rearrangements7 by hierarchical clustering defined the PAX5alt subtype (10%; n = 36). PAX5alt was the fourth most common subtype. One patient with EPOR-IGH rearrangements (and hemizygous PAX5 deletion) clustered with PAX5alt and not with BCR-ABL1, and was classified as PAX5alt. Another 5 patients (3 CRLF2, 1 BCR-ABL1, and 1 near-haploid subtype) clustered in this PAX5alt branch as well; 4 were positive for deletions or internal tandem duplication (ITD) of PAX5 and 1 had no PAX5 CNV data. These patients were classified by their driver mutations (ie, CRLF2, BCR-ABL1, and near haploid).
There were 3 subtypes that showed gene expression signatures similar to those of known subtypes (Table 1). Clustered with ETV6-RUNX1 was the ETV6-RUNX1-like subtype (2%; n = 9). Of the 9 ETV6-RUNX1-like subtypes, 3 harbored ETV6 rearrangements with alternative partners (GIP, MKL1, and BCL2L14) and 1 had PHAX-IGH rearrangement. All the patients with ETV6-RUNX1-like (with available data, n = 8 of 8; supplemental Figure 1) had ETV6 deletion and most (n = 7 of 9; Figure 2) clustered within 1 sub-branch, indicating the uniqueness of the gene expression of this subtype. Notably, in 2 patients with ETV6-RUNX1-like subtypes, ETV6 mutations (p.Trp360Arg and p.Glu364Ter) were identified by RNA-seq, both of which were previously reported to be damaging.28 After excluding CRLF2 rearrangements, the BCR-ABL1-like subtype (2%; n = 8) coclustered with BCR-ABL1, with 75% (6 of 8) having tyrosine kinase rearrangements, including EBF1-PDGFRB (n = 3), ETV6-PDGFRB (n = 1), SSBP2-CSF1R (n = 1), and NUP214-ABL1 (n = 1). Two patients (1%) with gene expression signatures similar to those of patients with ZNF384-rearranged were classified as ZNF384-like. Two patients (1%) with unique gene expression signatures and PAX5 P80R mutation were defined as PAX5 P80R subtype. The high mutant allele frequencies of the PAX5 P80R mutations (99.7% and 73.4%) suggested biallelic variations of PAX5, in agreement with previous studies.6,7 The remaining patients were classified as B-Others (7%; n = 26).
Clinical characteristics of the subtypes
The RNA-seq genetic subtypes were strongly correlated with age at presentation (P = 1.2 × 10−37; Figure 2; supplemental Figure 2). The majority of patients with high hyperdiploid and ETV6-RUNX1 subtypes were between age 1 and 10 years, whereas DUX4, PAX5alt, and BCR-ABL1 (along with BCR-ABL1-like and CRLF2) subtypes were more common in patients older than age 10 years. PAX5alt, PBX1, BCR-ABL1, BCR-ABL1-like, CRLF2, and ETV6-RUNX1-like subtypes were associated with high-presenting white blood cell count (WBC) >50 × 109/L (P = 6.5 × 10⁻⁸; Figure 2; supplemental Figure 3). The genetic subtypes were marginally correlated with race (P = .03; supplemental Figure 4), and no significant correlation with sex or central nervous system (CNS) status was observed (supplemental Figure 5). The subtypes had different frequencies of IKZF1 deletion (IKZF1del; Figure 2). IKZF1del was most frequent in CRLF2 (80%), ETV6-RUNX1-like (63%), BCR-ABL1-like (60%), and BCR-ABL1 (44%) subtypes but virtually absent in PBX1, KMT2A, and B-Others subtypes.
Interestingly, in unsupervised hierarchical clustering, ETV6-RUNX1 had 2 sub-branches with distinctly different PAX5 CNVs (Figure 2; supplemental Figure 6A). All but 1 of the samples with PAX5 deletion were clustered in 1 sub-branch (Figure 2) with distinct gene expression signatures (supplemental Figure 6B). The ETV6-RUNX1 subtype with PAX5 deletions had significantly higher presenting WBC (P = 4.8 × 10⁻⁴; Figure 2; supplemental Figure 6A) but still had excellent outcome (CIR, 0%; supplemental Figure 6C).
DUX4 subtype had poorer EOI MRD but good outcome
The largest subtype in the EOI MRD HR group was DUX4. DUX4 accounted for 27% (n = 12 of 44; supplemental Figure 7) of the MRD HR patients. Conversely, 24% of the patients (12 of 50) with the DUX4 subtype were EOI MRD HR, significantly higher than 11% in other subtypes (P = 8.2 × 10⁻³; Figure 3A). Only 22% of the patients with DUX4 subtype were EOI MRD negative (≤1 × 10⁻⁴), significantly less than 52% in other subtypes (P = 7.7 × 10⁻⁵; Figure 3A). Interestingly, most of the patients with DUX4 subtype with negative day-33 EOI MRD had ERG codeletion (details are provided in the following section).
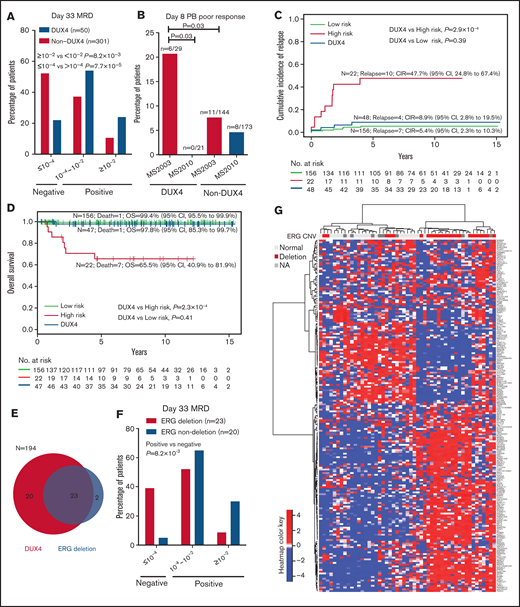
Distinct clinical characteristics of the DUX4 subtype. (A) Patients with the DUX4 subtype have higher day-33 MRD. (B) In MS2003, patients with the DUX4 subtype had significantly poorer day-8 PB response than patients in MS2010, which used IV vincristine. CIR (C) and OS (D) of DUX4 subtype compared with conventional LR subtypes (including ETV6-RUNX1 and high hyperdiploid) and HR subtypes (including BCR-ABL1, KMT2A, hypodiploid, and near haploid). (E) Relationship between ERG deletion and DUX4 subtype. (F) Patients with the ERG deletion in the DUX4 subtype had better day-33 MRD. (G) Unsupervised hierarchical clustering of the DUX4 subtype showing that ERG deletions are associated with distinct gene expression signatures. Genes with significantly higher variance in DUX4 subtypes than the rest of the cohort (by Conover squared ranks test) with adjusted P value (by Holm’s method) <.05 were first selected. In the selected genes, the top 200 genes with the highest median absolute deviation in DUX4 subtype were used in hierarchical clustering using correlation coefficient as the distance metric and Ward’s algorithm.
Distinct clinical characteristics of the DUX4 subtype. (A) Patients with the DUX4 subtype have higher day-33 MRD. (B) In MS2003, patients with the DUX4 subtype had significantly poorer day-8 PB response than patients in MS2010, which used IV vincristine. CIR (C) and OS (D) of DUX4 subtype compared with conventional LR subtypes (including ETV6-RUNX1 and high hyperdiploid) and HR subtypes (including BCR-ABL1, KMT2A, hypodiploid, and near haploid). (E) Relationship between ERG deletion and DUX4 subtype. (F) Patients with the ERG deletion in the DUX4 subtype had better day-33 MRD. (G) Unsupervised hierarchical clustering of the DUX4 subtype showing that ERG deletions are associated with distinct gene expression signatures. Genes with significantly higher variance in DUX4 subtypes than the rest of the cohort (by Conover squared ranks test) with adjusted P value (by Holm’s method) <.05 were first selected. In the selected genes, the top 200 genes with the highest median absolute deviation in DUX4 subtype were used in hierarchical clustering using correlation coefficient as the distance metric and Ward’s algorithm.
MS2003 induction10 consisted of the standard ALL Berlin-Frankfurt-Münster (BFM) single dose of intrathecal methotrexate (IT MTX) at day 1 followed by 7 days of prednisolone (PRED). In the MS2010 protocol,11 the day 1 IT MTX was replaced with intravenous vincristine (IV VCR). We compared the day-8 PB response in the MS2003 and MS2010 studies to investigate the initial response of patients with the DUX4 subtype. In MS2003, patients with the DUX4 subtype had significantly higher frequency of day-8 PB poor response than other subtypes (21% vs 8%; P = .03; Figure 3B), suggesting that the DUX4 subtype was relatively resistant to PRED. In MS2010, the DUX4 subtype had no poor day-8 PB responders (P = .03; Figure 3B), suggesting that IV VCR was more effective.
Despite the poorer EOI MRD, the outcome for patients with the DUX4 subtype was excellent: the 5-year CIR was 8.9% (95% confidence interval [CI], 2.8%-19.5%), and the 5-year OS was 97.8% (95% CI, 85.3%-99.7%). This excellent outcome was comparable to other low-risk subtypes, including ETV6-RUNX1 and high hyperdiploid (CIR, P = .39; OS, P = .41; Figure 3C-D) and was significantly better than that for high-risk subtypes of BCR-ABL1, KMT2A, hypodiploid, and near haploid (CIR, P = 2.9 × 10⁻⁴; OS, P = 2.3 × 10⁻⁴; Figure 3C-D). Interestingly, EOI and week 12 end-of-consolidation PCR MRD were not predictive of outcome in patients with the DUX4 subtype (supplemental Figure 8). All 3 patients with DUX4 who relapsed had negative week-12 MRD (supplemental Figure 8B); 2 of them retained the same PCR MRD clone, and another had isolated CNS relapse. Details for the patients with DUX4 subtype are summarized in supplemental Table 1.
ERG deletion defined a subentity in DUX4 B-ALL with better day-33 EOI MRD
A frequent secondary event in patients with the DUX4 subtype5,29 was ERG deletion. We performed MLPA for ERG CNV identification in 194 of the 377 patients, including 43 of the 51 with the DUX4 subtype. Of the 25 patients with ERG deletion, 92% (n = 23) had the DUX4 subtype, except for 1 PAX5alt and 1 ZNF384-like (Figure 3E). Within the DUX4 subtype, ERG deletion was associated with better EOI MRD: 39% of patients were MRD negative compared with 5% of those with normal ERG (P = 8.2 × 10⁻³; Figure 3F). Consistent with previous findings,5,30 IKZF1del was not associated with increased risk of relapse in patients with the DUX4 subtype with or without ERG deletion (supplemental Figure 9). Unsupervised hierarchical clustering showed that the DUX4 subtype with ERG deletion had distinct gene expression profiles (Figure 3G), suggesting a subentity.
IKZF1 deletion was highly predictive of relapse in the PAX5alt subtype
PAX5 fusions occurred in 42% (15 of 36) of the patients with PAX5alt. The PAX5 fusions had 11 different partners: NOL4L (n = 3) and CBFA2T3 (n = 3) were the most common, followed by 9 fusions to AUST2, CBFA2T2, ELN, ESRRA, FBRS, FBRSL1, FKBP15, PEG10, and ZCCHC7, each occurring only once. PAX5 deletions and ITDs occurred in 69% (22 of 32) of the patients with PAX5alt compared with 17% (50 of 289; P = 3.6 × 10⁻¹¹; Figure 2) in other subtypes. In patients with the PAX5alt subtype who had CNV data, 84% (26 of 31) had CDKN2A/B deletions, significantly higher than the 23% (65 of 288; P = 6.9 × 10⁻¹³; Figure 2) in other subtypes.
In patients with the PAX5alt subtype, IKZF1del was associated with a higher risk of relapse (CIR, 50.0% vs 0%; P = 2.0 × 10⁻³; Figure 4A; supplemental Table 2) as well as a trend toward poorer OS (Figure 4B). In the MS2010 trial, in which the treatment of all patients with IKZF1del was intensified, PAX5alt with IKZF1del had a lower relapse rate (CIR, 80% vs 0%; P = .05; Figure 4C) and a trend toward better OS (Figure 4D).
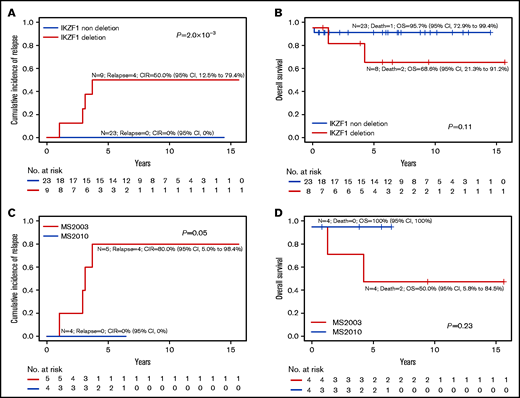
IKZF1 deletion in PAX5alt subtype. Overall outcomes of PAX5alt subtype with or without IKZF1del based on CIR (A) and OS (B). Outcome of PAX5alt subtype with IKZF1del analyzed by MS2003 vs MS2010 based on (C) CIR and (D) OS.
IKZF1 deletion in PAX5alt subtype. Overall outcomes of PAX5alt subtype with or without IKZF1del based on CIR (A) and OS (B). Outcome of PAX5alt subtype with IKZF1del analyzed by MS2003 vs MS2010 based on (C) CIR and (D) OS.
RNA-seq–defined genetic subtype improved risk stratification of B-ALL
We investigated risk stratification using RNA-seq–defined subtypes. Conventionally, high hyperdiploid and ETV6-RUNX1 were considered LR, whereas BCR-ABL1, KMT2A, and hypodiploid (including near haploid) were considered HR. We reviewed the published survival outcomes of the recently discovered subtypes (supplemental Table 3) and assigned them to risk groups: DUX4 to LR7,8,29,31 and BCR-ABL1-like,31,32 CRLF2,31,33,34 MEF2D,8,35-38 and TCF3-HLF39-41 to HR. For the ZNF384 subtype, we assigned patients with ZNF384-EP300 to LR and patients with other ZNF384 rearrangements to intermediate risk (IR), based on the results from the Ponte Di Legno Childhood ALL Working Group.42 The remaining subtypes, including PBX1, NUTM1, PAX5alt, PAX5 P80R, IGH-CEBPE, ETV6-RUNX1-like, ZNF384-like, and B-Others were classified as IR. Table 1 summarizes the MS2003 and MS2010 5-year CIR and 5-year OS by RNA-seq subtypes, which generally concurred with the published outcomes.
We then compared the survival outcomes of conventional risk stratification based on oncogene fusion, cytogenetics, and DNA index against RNA-seq subtype risk stratification (Table 1, last column). Although conventional laboratory test subtype assignment (Figure 5A-B) assigned only 5% (n = 17 of 362) patients into the HR group, 30% (n = 108) into LR group, and 65% (n = 237) into the large IR group, it was highly predictive of outcome (CIR, P = 2.1 × 10⁻⁷; OS, P = 4.1 × 10⁻⁷; event-free survival [EFS], P = 8.9 × 10⁻⁸; Figure 5; supplemental Figure 10). When subtype assignment was performed for all of the patients treated on MS2003 and MS2010, the CIR and OS of the risk groups were similar (supplemental Figure 11). If we used RNA-seq as a single platform to generate conventional subtype assignment (supplemental Figure 12), slightly more patients were assigned to HR (6%; n = 22) and LR (43%; n = 156) with similar outcome prediction (CIR, P = 2.1 × 10⁻⁷; OS, P = 6.6 × 10⁻⁸).
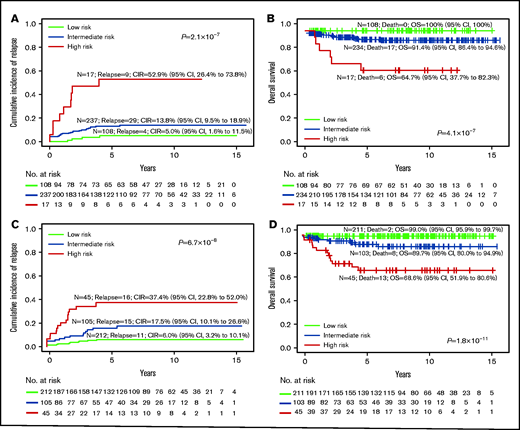
Risk stratification using conventional subtype classification methods compared with RNA-seq. CIR (A) and Kaplan-Meier estimates of OS (B) of risk groups stratified by conventional laboratory tests such as oncogene fusion panels, cytogenetic and DNA index, and risk stratification are limited to BCR-ABL1, KMT2A, and hypodiploid (including near haploid) as HR, and ETV6-RUNX1 and hyperdiploid as LR. CIR (C) and Kaplan-Meier estimates of OS (D) of risk groups on the RNA-seq platform with risk stratification of the new groups recently defined. The LR group includes high hyperdiploid, ETV6-RUNX1, DUX4, and ZNF384-EP300; the HR group includes BCR-ABL1, BCR-ABL1-like, CRLF2, hypodiploid, near haploid, KMT2A, MEF2D, and TCF3-HLF.
Risk stratification using conventional subtype classification methods compared with RNA-seq. CIR (A) and Kaplan-Meier estimates of OS (B) of risk groups stratified by conventional laboratory tests such as oncogene fusion panels, cytogenetic and DNA index, and risk stratification are limited to BCR-ABL1, KMT2A, and hypodiploid (including near haploid) as HR, and ETV6-RUNX1 and hyperdiploid as LR. CIR (C) and Kaplan-Meier estimates of OS (D) of risk groups on the RNA-seq platform with risk stratification of the new groups recently defined. The LR group includes high hyperdiploid, ETV6-RUNX1, DUX4, and ZNF384-EP300; the HR group includes BCR-ABL1, BCR-ABL1-like, CRLF2, hypodiploid, near haploid, KMT2A, MEF2D, and TCF3-HLF.
By incorporating the newly discovered genetic subtypes that could not be defined by conventional laboratory tests (Figure 5C-D), 57% (136 of 237) of the conventional IR patients were stratified to either LR (46.0%) or HR (11.4%; supplemental Figure 13). Specifically, RNA-seq assigned twofold more patients to the LR group (212 vs 108; Figure 5C compared with Figure 5A), with comparable CIR (6.0% vs 5.0%), EFS (93.5% vs 95%; supplemental Figure 10), and OS (99.0% vs 100%). The number of HR patients also increased more than twofold (45 vs 17), with lower CIR (37.4% vs 52.9%), higher EFS (55.7% vs 47.1%; supplemental Figure 10), yet similar OS (68.6% vs 64.7%). By conventional methods, most of the relapses and deaths were in the large IR group, which could not be stratified (69% relapses and 74% deaths). Using RNA-seq, the HR group had the most relapses (38%) and deaths (57%).
In a multivariable analysis model of competing risk regression on CIR controlling for age, sex, WBC, day-33 MRD, and treatment protocol (Table 2), RNA-seq risk stratification (IR vs LR: P = .01; HR vs LR: P = 7.2 × 10⁻⁴), EOI MRD (HR vs SR: P = 2.0 × 10⁻⁶), and treatment protocol (MS2010 vs MS2003: P = .03) remained significant.
Multivariable analysis using competing risk regression on CIR and Cox proportional hazards regression on OS
| Variable | Competing risk regression on CIR | Cox proportional hazards regression on OS | ||||
|---|---|---|---|---|---|---|
| HR | 95% CI | P | HR | 95% CI | P | |
| RNA-seq risk stratification | ||||||
| Low* | 1.0 | 1.0 | ||||
| Intermediate | 2.89 | 1.26-6.61 | .01 | 14.34 | 1.67-123.53 | .02 |
| High | 4.85 | 1.94-12.10 | 7.2 × 10⁻⁴ | 31.63 | 3.71-296.32 | 1.6 × 10⁻³ |
| Age, y | ||||||
| 1-10* | 1.0 | 1.0 | ||||
| <1 | 0.72 | 0.26-2.00 | .53 | 1.06 | 0.21-5.50 | .94 |
| ≥10 | 0.74 | 0.28-1.97 | .54 | 3.24 | 1.03-10.17 | .04 |
| Sex | ||||||
| Female* | 1.0 | 1.0 | ||||
| Male | 1.50 | 0.77-2.95 | .23 | 1.36 | 0.46-3.98 | .58 |
| WBC | ||||||
| <50 × 109/L* | 1.0 | 1.0 | ||||
| ≥50 × 109/L | 1.48 | 0.77-2.84 | .24 | 1.56 | 0.59-4.15 | .37 |
| Day 33 MRD | ||||||
| ≤1 × 10⁻⁴* | 1.0 | 1.0 | ||||
| 1 × 10⁻⁴ to 1 × 10⁻² | 2.02 | 0.91-4.48 | .08 | 2.44 | 0.71-8.46 | .16 |
| ≥1 × 10⁻² | 8.73 | 3.57-21.32 | 2.0 × 10⁻⁶ | 3.31 | 0.91-12.07 | .07 |
| Protocol | ||||||
| MS2003* | 1.0 | 1.0 | ||||
| MS2010 | 0.46 | 0.23-0.93 | .03 | 0.38 | 0.12-1.25 | .11 |
Reference group.
In a Cox proportional hazards regression on OS with the same variables, only RNA-seq risk stratification (IR vs LR: P = .02; HR vs LR: P = 1.6 × 10⁻³) and age (≥10 vs 1-10 years: P = .04) were independently associated with OS; EOI MRD lost its significance. In each MRD risk group, RNA-seq risk stratification helped further refine prediction of OS (supplemental Figure 14). However, in each RNA-seq risk group, EOI MRD no longer predicted OS (supplemental Figure 15). When the treatment arms10,11 were included in the multivariable analysis models, similar results were obtained (supplemental Table 4).
Discussion
We found that in B-ALL, the third and fourth most common subtypes were the recently described B-ALL subtypes—DUX4 and PAX5alt; 14% of our study cohort had the DUX4 subtype. Although patients with DUX4 had significantly poorer EOI MRD response (78% EOI MRD positive compared with 48% in other subtypes; P = 7.7 × 10⁻⁵), they had an excellent outcome (5-year CIR, 8.9%; 5-year OS, 97.8%; Figure 3). We also found that although PAX5alt had intermediate outcome, that outcome was significantly influenced by codeletion of IKZF1 (Figure 4). All 23 patients with PAX5alt with no deletion of IKZF1 gene remained in continuous complete remission. Intensifying therapy in patients with PAX5alt with codeletion of IKZF1 significantly reduced the risk of relapse (P = .05).
We confirmed that the DUX4 subtype was more common among older children (median age at diagnosis, 9.8 years; supplemental Figure 2). But despite this National Cancer Institute HR age group, patients with DUX4 had excellent outcomes (Figure 3C-D), similar to outcomes in other reports in both pediatric and adult patients.7,8 However, 78% of patients with the DUX4 subtype were EOI MRD positive, with 24% being EOI MRD HR (Figure 3A). In fact, the largest group of EOI MRD HR patients had the DUX4 subtype (27%; n = 12 of 44). In MS2003, in which patients received only 1 dose of IT MTX and 7 days of oral PRED, patients with DUX4 had a significantly poorer PB response (P = .03; Figure 3B). Adding VCR to the first 8 days of PRED in the MS2010 trial significantly improved PB response (Figure 3B).
Czech investigators reported43 that during induction, DUX4 blasts underwent a monocytic switch, which resulted in discrepant PCR-based and flow-based MRD. These monocytic switched blasts carried the PCR-based MRD markers but lost their flow-based CD19 markers. Because of this, flow-based MRD reported good MRD clearance, but PCR-based MRD showed a persistent high level of disease. In our own experience, in 4 patients with DUX4 who had positive PCR MRD, flow MRD on the same sample was clearly negative (MRD <0.01%; unpublished data). Intriguingly, these monocytic blasts may not contribute to relapse. This might explain why despite having high EOI MRD, PCR-based MRD was not predictive of outcome in patients with DUX4. In patients with DUX4, flow-based MRD might be a better platform for risk stratification.
Most patients with DUX4 B-ALL in MS2003 and MS2010 were treated in the HR or IR arm (88%; n = 45 of 51; supplemental Table 1) because of positive EOI MRD, older age, and frequent IKZF1del. Yet the outcomes of patients with DUX4 were excellent (5-year CIR, 8.9%; 5-year OS, 97.8%), which was similar to that for the favorable subtypes (5-year CIR in ETV6-RUNX1, 5.2%; high hyperdiploid, 5.5%; Table 1). This created a conundrum: was the good outcome of patients with the DUX4 subtype a result of intensified therapy? Or, alternatively, was DUX4 a favorable subtype?
To solve this conundrum, Jeha et al44 recently reported on St. Jude’s Total Therapy Study XVI for Newly Diagnosed Patients With Acute Lymphoblastic Leukemia (hereafter Total Therapy Study XVI), which had novel subtypes, including DUX4. None of their patients with DUX4 (n = 20) were HR, 40% were LR, 60% were standard risk, and none received BM transplantation. Their 5-year EFS and OS were 95%, which was similar to our results. St. Jude’s report suggested that the DUX4 subtype is indeed favorable, and patients with that subtype do not need intensified HR therapy.
The next question was why none of the patients in Total Therapy Study XVI with DUX4 were HR. St. Jude researchers used flow-based MRD44 whereas MS2003 and MS2010 used PCR-based MRD. PCR-based MRD probably overestimated the residual disease because of the monocytic switch in the DUX4 subtype after treatment.43 At day 42 of induction, 95% of the patients with DUX4 in the Total Therapy Study XVI were MRD negative (≤1 × 10⁻⁴) by flow cytometry compared with only 22% of patients being MRD negative by PCR at EOI in MS2003 and MS2010 (supplemental Table 1). Taken together, the DUX4 subtype was favorable, and MRD by flow cytometry probably more accurately quantitated the residual disease for patients with DUX4.
ERG deletion occurred almost exclusively in DUX4 B-ALL (92%; n = 23 of 25). Although it represented a secondary event in the DUX4 subtype, ERG deletion was associated with better EOI MRD (Figure 3F), similar to the experience by Zaliova et al.29 Unsupervised hierarchical clustering showed that DUX4 subtype with ERG deletion had a distinct signature (Figure 3G). Taken together, our data suggested that ERG deletion in DUX4 subtype was not merely a passenger event that occurs coincidentally; ERG deletion in the DUX4 subtype influenced treatment response. The codeletion of ERG with DUX4 dysregulation is worth exploring in future studies.
The fourth most common subtype of B-ALL, accounting for 10% of our cohort, was PAX5alt (Table 1). PAX5alt conferred an intermediate risk of relapse with 5-year CIR of 18.1% (95% CI, 6.3%-34.7%). These PAX5alt relapses tended to be late (median time to relapse, 2.5 years) and were responsive to initial relapse therapy with 50% long-term survival (including 1 after BM transplantation). Similarly, the Total Therapy Study XVI reported that patients with PAX5alt had CIRs of 17.3%, which were late and extramedullary (CIR, 2.5 to 4 years; 50% CNS relapse).44 Yet patients in the Total Therapy Study XVI with PAX5alt who had relapsed were eligible for salvage therapy with an excellent OS of 100% (supplemental Table 5).
The codeletion of IKZF1 in patients with PAX5alt was highly predictive of relapse (P = 2.0 × 10⁻³; Figure 4A). Because the PAX5alt group was characterized by a high frequency of PAX5 deletions, all 9 patients who had PAX5alt with IKZF1del were essentially BFM IKZF1plus.9 Among the subtypes, the PAX5alt subtype accounted for most of the IKZF1plus subtypes (38%; n = 9 of 24; supplemental Figure 16). Interestingly, in the PAX5alt subtype with IKZF1del, intensifying treatment in MS2010 trial to the next risk level improved the outcome (CIR, 80% vs 0%; P = .05). In Total Therapy Study XVI, all 4 of the patients with PAX5alt who relapsed were those who cleared their MRD at day 42 and did not receive intensified therapy. Unfortunately, we do not know the status of their IKZF1del. In the absence of IKZF1del, when patients were stratified according to MRD, those with PAX5alt had an excellent outcome (n = 23; CIR, 0%). Conversely, the presence of IKZF1del in the PAX5alt subtype conferred a high risk of relapse (80%; n = 4 of 5) in MS2003, which improved with intensification of therapy (n = 0 of 4; CIR, 0%) in MS2010. This was similar results from the UKALL 2003 trial regarding intrachromosomal amplification of chromosome 21 (iAMP21) in which intensifying therapy abrogated poor prognosis attributed to iAMP21.45
We next tested whether our ability to assign 93% of our cohort to 1 of the subtypes with its distinct risk of relapse would help to improve our current PCR MRD-based risk stratification. To avoid overfitting, we based our RNA-seq subtype risk stratification on outcomes published in the literature (supplemental Table 3). We found that RNA-seq subtype stratification was highly predictive of relapse and OS (Figure 5C-D). Specifically, the LR group, which accounted for 59% of the cohort, had excellent outcome (CIR, 6.0%; OS, 99.0%). The HR group (12% of the cohort) accounted for 38% of the relapses and 57% of the deaths. In multivariable analysis, after controlling for age, sex, presenting WBC, EOI MRD, and treatment protocol, RNA-seq risk stratification was independently predictive of relapse and OS (Table 2). In each risk group stratified by RNA-seq, EOI MRD predicted only CIR but not OS (supplemental Figure 15).
There were 3 groups that were assigned on the basis of gene expression similarities with known groups: ETV6-RUNX1-like, ZNF384-like, and BCR-ABL1-like (Table 1). The ETV6-RUNX1-like (2% of patients) had an IR profile, which differed from that of ETV6-RUNX1 (5-year CIR, 12.7% vs 5.2%, P = .44; 5-year OS, 88.9% vs 100%, P = .0044). ETV6-RUNX1-like subtype was associated with a very high frequency of IKZF1del (63%), significantly higher than that in ETV6-RUNX1 (7%; P = 9.1 × 10⁻⁶), consistent with previous findings.3 Most of the patients who had the ETV6-RUNX1-like subtype were clustered in a unique sub-branch (Figure 2). These results distinguished ETV6-RUNX1-like from the ETV6-RUNX1 subtype and suggested the risk stratification of the “-like” groups should be considered separately from their established counterparts. This was a retrospective study of subtypes of B-ALL that used RNA-seq. The RNA-seq patients were enriched for EOI MRD positive, and conventionally unclassified patients had the B-Others subtype (supplemental Table 6). Despite these differences, the CIR and OS were not significantly different from those for patients in the main cohort (supplemental Figure 17).
By using the recently published data44 from Total Therapy Study XVI, we generated an independent test cohort based on our RNA-seq risk groups (supplemental Table 7). We found that our RNA-seq risk groups yielded outcomes similar to those of Total Therapy Study XVI when comparing them to MS2003 and MS2010 (supplemental Table 7). The only exception was that in Total Therapy Study XVI, patients with BCR-ABL1 received dasatinib and had better outcomes. Taken together, we believe that RNA-seq risk groups could be generalized to real-world applications.
We proposed that RNA-seq be used in a prospective MRD-stratified ALL study to genetically subtype patients with B-ALL. This could substantially improve risk assignment and guide the choice of either adding tyrosine kinase inhibitor or increasing the intensity of therapy. To complement MRD-based risk stratification, we implemented RNA-seq subtype classification and risk stratification workflow for our successor MS2020 trial.46 The workflow could classify 3 to 10 patients each week by subtype, which would allow timely diagnosis and intervention. RNA-seq could also provide sequence identification of IGH disease clones to help design IGH PCR MRD markers for MRD quantitation.47
In conclusion, RNA-seq can assign up to 93% of patients with B-ALL to a distinct genetic subtype and can help improve risk assignment, even in contemporary MRD-based stratification. The newly identified DUX4 and PAX5alt subtypes, which accounted for the third and fourth most common subtypes of ALL, had distinct clinical characteristics. Despite an excellent outcome, patients with the DUX4 subtype cleared MRD slowly, and the majority of patients were MRD positive at EOI. The PAX5alt subtype with codeletion of IKZF1 had a high risk of relapse, but this improved with intensified therapy.
Acknowledgments
This work was supported by the Singapore National Medical Research Council Clinician Scientist Awards (NMRC/CSA/0053/2013 and MOH-000277), Children’s Cancer Foundation (Singapore), Singapore Tote Board, Goh Foundation (Singapore), and Viva Foundation for Children with Cancer.
The computational work for this article was partially performed using resources at the National Supercomputing Centre in Singapore (https://www.nscc.sg).
Authorship
Contribution: J.J.Y. and A.E.-J.Y. designed the study; T.C.Q., H.P.L., A.M.T., H.A., and A.E.-J.Y. cared for patients and provided study materials and clinical data; Z.L., S.H.R.L., W.H.N.C., Y.L., N.J., E.H.L., E.C.-S., K.H.C., B.L.Z.O., G.S.K., Z.C., S.K.Y.K., J.J.Y., and A.E.-J.Y. collected and assembled the data; K.H.C., Z.C., and S.K.Y.K. provided administrative support; Z.L., S.H.R.L., B.L.Z.O., J.J.Y., and A.E.-J.Y. performed data analysis and designed the figures; and all authors helped write the paper and approved the manuscript.
Conflict-of-interest disclosure: The authors declare no competing financial interests.
Correspondence: Allen Eng-Juh Yeoh, Viva-University Children’s Cancer Centre, KTP-National University Children’s Medical Institute, Yong Loo Lin School of Medicine, National University of Singapore, Level 12, National University Health System, Tower Block, 1E Kent Ridge Rd, Singapore 119228; e-mail: paeyej@nus.edu.sg.
RNA-seq data were deposited in European Genome-Phenome Archive with accession numbers EGAS00001001858, EGAS00001003726, and EGAS00001004532.

