

Key Points
Recipients of cryopreserved PBSCs had lower T-cell chimerism, white blood cell count and T-cell reconstitution at days +30 and +100.
Greater age of product at infusion is linked with increased graft failure independent of cryopreservation.

Abstract
We sought to evaluate the impact of cryopreservation of unrelated donor (URD) peripheral blood stem cell (PBSC) grafts on engraftment, chimerism, and immune reconstitution in the context of the COVID-19 pandemic. We reviewed stem cell product characteristics and clinical outcomes in 101 patients receiving cryopreserved PBSCs from URDs between January 1, 2019 and 31 December, 2020, compared with 203 patients receiving fresh URD PBSCs. We observed no differences in 6-month overall survival, progression-free survival, or nonrelapse mortality. Patients receiving cryopreserved PBSCs had delayed platelet engraftment and impaired reconstitution of white blood cells and T-cell subsets at day 30. Thirty-four percent of patients receiving cryopreserved grafts had CD3 chimerism <50% at day 30 after transplantation, compared with 14% of patients receiving fresh PBSCs (P = .0002). At day 100, this difference persisted (CD3+ chimerism <50%: 17% of cryopreserved cohort vs 6% of fresh cohort; P = .016). Greater product age at infusion was associated with increased graft failure, independent of cryopreservation. Receipt of grafts >48 hours old at time of cryopreservation or infusion significantly increased the risk of graft failure (subdistribution hazard ratio = 4.57; 95% confidence interval, 1.71-12.3; P = .0025). Our data indicate that cryopreservation is associated with similar overall short-term clinical outcomes compared with fresh PBSC. However, patients must be monitored closely for increased risk of other potentially adverse outcomes, including graft failure and poor immune recovery, particularly for grafts with older overall age at infusion. Longer-term follow-up is needed to determine impact on relapse and survival.
Introduction
Prior to the COVID-19 pandemic, allogeneic hematopoietic stem cell transplantation (allo-HSCT) was typically performed using fresh stem cell grafts shipped directly from site of collection to site of infusion. With the emergence of COVID-19, practices shifted to products being shipped to central national hubs and cryopreserved, either at the site of collection or at infusion.
Previously published data on allogeneic stem cell cryopreservation suggested a modest effect of cryopreservation on stem cell viability and yield upon thaw.1 Some studies have found an association of cryopreservation with impaired CD34+ cell recovery and subsequent impairment in engraftment,2-5 whereas others did not.6,7 A 2020 study suggested that cryopreservation may have a more detrimental effect on CD34+ cell recovery than initially thought.8 The Center for International Blood and Marrow Transplant Research recently published a retrospective analysis of patients undergoing allo-HSCT with cryopreserved vs fresh grafts associating cryopreservation with delayed neutrophil and platelet engraftment, increased risk of grade II to IV acute graft-versus-host disease (aGVHD), and increased risk of nonrelapse mortality (NRM), and relapse, with decreased overall survival (OS) and progression-free survival (PFS).9 However, a similar analysis in patients who received posttransplant cyclophosphamide (PTCy) for graft-versus-host prophylaxis found no deleterious effects of cryopreservation.10 Another Center for International Blood and Marrow Transplant Research report in patients with aplastic anemia found that cryopreservation of bone marrow grafts is associated with increased risk of engraftment failure and reduced OS in severe aplastic anemia patients.11 Given these conflicting data, additional studies are needed to assess the potential risks and benefits associated with cryopreservation of stem cell grafts.
We and others have described experiences with safe continuation of allo-HSCT practices throughout the COVID-19 pandemic and shared best practices.12-16 We previously demonstrated an association between cryopreservation and lower CD3 chimerism at 30- and 100-days after allo-HSCT at our institution.12 This observation was made in a small patient cohort and requires further investigation.
In the present study, we assessed the impact of changes in stem cell processing due to the pandemic, including age of product prior to cryopreservation (a summation of transit time, holding time, and processing time), and cryopreservation of unrelated donor (URD) peripheral blood stem cells (PBSCs) on early clinical outcomes, including hematopoietic engraftment, OS, progression-free survival (PFS), relapse, NRM, aGVHD incidence, and chimerism at 30 and 100 days after transplantation. We also report the impact of cryopreservation on immune reconstitution. Outcomes were compared with those of patients receiving fresh stem cell products unrelated to PBSCs at our center during a contemporaneous period.
Methods
Patient selection
This study was approved by the Institutional Review Board of the Dana-Farber/Harvard Cancer Center (DFCI/HCC) and was conducted in accordance with the Declaration of Helsinki. We analyzed all adult patients who underwent first allo-HSCT with URD PBSC grafts between 1 January, 2019 and 31 December, 2020, including 101 patients who received a cryopreserved PBSC during this time period. The control cohort consisted of 203 patients receiving fresh PBSCs from an URD in this same period. Of the current study consisting of 304 patients, one-third (n = 104) were included in our initial report of transplantation during the early phase of the pandemic.12 During the study period at our center, no related donor products were cryopreserved. Most transplants utilizing fresh products occurred during 2019, whereas most transplants with cryopreserved product occurred during 2020. We therefore focused our analysis on short-term outcomes. The COVID-19 pandemic was the reason for cryopreservation for 93 of the grafts. The remaining 8 cryopreserved grafts were due to unplanned delays in transplant.
Stem cell processing
Stem cell products were processed according to standardized protocols in use by the DFCI Cell Manipulation Core Facility. Upon receipt, products were assessed for correct labeling and identifiers, weighed, and underwent quality control testing (including ABO testing, total nucleated cell count [TNC], and TNC viability [trypan blue]) and sampling for product sterility. Cells were inspected for quality and transferred to bags with appropriate ports for infusion. The final stem cell product was then counted (TNC and CD34), assessed for TNC viability (trypan blue and 7-Aminoactinomycin D (7AAD)) and CD34 viability (7AAD), sampled again for sterility, relabeled, and delivered to the infusion or cryopreserved. Processing of fresh unmanipulated stem cell products required ∼1 hour. In the case of a major or minor ABO mismatch with >30 mL red blood cells (RBCs), products underwent plasma or RBC reduction by centrifugation, respectively. Plasma or RBC reduction added ∼90 minutes and 2 hours, respectively, to processing times. We defined overall age of product as total time in hours between end of collection at the donation site to end of processing at our center. We further broke down age of product into 3 component parts: “transit time” (time in hours between end of collection at the donation site to receipt at our center), “holding time” (time in hours between receipt and beginning of processing), and “processing time” (time in hours between initial processing sample and final processing sample). Prepandemic, stem cell products were typically shipped directly from collection site to infusion site and processed immediately upon receipt. During the pandemic, transit practices shifted to a hub-and-spoke model, and our institutional practice shifted to holding overnight any products destined for cryopreservation if they were received after normal laboratory hours for freezing the following morning. Typically, no more than 30 minutes elapsed between final sampling and product infusion or cryopreservation. No maximum CD34+ dose limit was enforced at our center.
Stem cell cryopreservation and thawing
All products destined for cryopreservation were resuspended at a total volume of 100 mL in isotonic Plasma-lyte A solution (Baxter). After final QC testing for cell counts and viability, cells were resuspended in 10% dimethyl sulfoxide cryoprotectant media (10% CryoPure [OriGEN], 5% human serum albumin [Baxter, Grifols, or equivalent] in Plasma-lyte A) at which point final sterility was assessed. Cells were then aliquoted into the desired number of bags (OriGEN CS500 CryoStore Freezing Bags) based on TNC values with maximum final cell concentration of 5 × 10⁸ cells per mL. Preparation for cryopreservation added ∼30 minutes to processing times. Bags in metal cassettes were then frozen in a controlled rate freezer (Kryo 560-16, Planer) over ∼75 minutes and placed in liquid nitrogen storage, vapor phase at less than −150°C. Controlled rate freezer freezing curve was programmed for 1°C drop per minute to −20°C and then 2°C drop per minute to −80°C with holds of 5 and 10 minutes at −20°C and −80°C, respectively. Resulting heat/enthalpy of fusion was approximately −35°C. Products were stored for days to weeks, as required for each individual transplant. On the day of planned stem cell infusion, cells were thawed in a 37°C water bath over 3 to 5 minutes, transferred to a new bag for reinfusion, and a QC sample was assessed for TNC viability (trypan blue) and sterility prior to release of the stem cell product to the patient floor. CD34 cell viability was not rechecked postthaw unless postthaw trypan blue viability was <60%, which did not occur in any products in this study. Expiration time by which cell infusion should be completed was 90 minutes after initiation of thaw.
Immune reconstitution monitoring by flow cytometry
A panel of directly conjugated monoclonal antibodies was used to define functionally distinct T-cell subsets (supplemental Table 1). After staining, cells were acquired on a Fortessa LSR flow cytometer (BD) and analyzed using FlowJo software. The gating strategy used for T-cell subset definition is described in supplemental Figure 1.
Statistical analysis
Baseline and pretransplant operational characteristics were reported descriptively and compared using Fisher’s exact test, χ2 test, or Wilcoxon rank-sum test, as appropriate. Clinical outcomes of interest included OS, PFS, NRM, relapse, infection, engraftment, graft failure, aGVHD, chimerism, and toxicity. Neutrophil engraftment was defined as the first of 2 consecutive days with ANC > 500 cells per µL, and platelet engraftment was defined as the first of 3 consecutive days with platelet count >20 000 platelets per µL. Because of low overall incidence of graft failure, statistical analysis included all cases rather than distinguishing between early and late or primary and secondary graft failure. OS was defined as the time from stem cell infusion to death from any cause. Patients who were alive were censored at the time last seen alive. PFS was defined as the time from stem cell infusion to disease relapse, progression, or death from any cause, whichever occurred first. Patients who were alive without disease relapse or progression were censored at the time last seen alive and relapse or progression free. The Kaplan-Meier method was used to estimate PFS and OS, whereas cumulative incidence of NRM, relapse, graft failure, and graft-versus-host disease (GVHD) was estimated in the context of a competing risks framework. NRM and relapse were treated as a competing event to each other, and death or relapse without developing GVHD served as a competing event for GVHD. For graft failure, death without graft failure was treated as a competing event. The log-rank test and Gray test were used for group comparison of PFS and OS and cumulative incidence of NRM, relapse, graft failure, and GVHD, respectively. To assess the effect of cryopreservation and age of product on time to events in the presence of other risk factors, multivariable Cox and Fine and Gray regression analyses were performed. Prior to modeling, linearity assumption for continuous variables and the proportional hazards assumption were examined. For day 30 CD3+ chimerism (≥50% vs <50%), multivariable logistic regression analysis was performed. All P values were 2-sided at a significance level of 0.05, and multiplicity was not considered. All calculations were performed using SAS 9.3 (SAS Institute, Inc, Cary, NC) and R version 3.3.2.
Results
Patients receiving fresh and cryopreserved products are similar at baseline
In our study, 101 patients received cryopreserved grafts, and 203 patients received fresh grafts from URDs. Characteristics of patients are shown in Table 1. The cryopreserved and fresh product cohorts were similar overall in terms of donor/recipient age and sex, diagnosis, disease status at transplant, disease risk index (DRI), hematopoietic cell transplantation-specific comorbidity index, cytomegalovirus (CMV) serological status (donor/recipient), HLA match, and conditioning intensity. Patients in the cryopreserved group were more likely to have received a GVHD prophylaxis regimen of PTCy/tacrolimus/mycophenolate mofetil compared with the control group (22.8% vs 12.3%, P = .008), reflecting changes in institution and field practice over time. All patients received URD product. There were similar proportions of international vs domestic donors.
Recipient, transplant, and donor characteristics
| Patient characteristics | Fresh | Cryopreserved | P |
|---|---|---|---|
| Patients, n | 203 | 101 | |
| Age, y, median (range) | 65 (21, 78) | 63 (25, 77) | .2 |
| Sex, n (%) | .9 | ||
| Male | 121 (59.6) | 59 (58.4) | |
| Female | 82 (40.4) | 42 (41.6) | |
| Diagnosis, n (%) | .98 | ||
| ALL | 23 (11.3) | 12 (11.9) | |
| AML | 80 (39.4) | 38 (37.6) | |
| Atypical leukemia | 1 (0.5) | 0 (0) | |
| CLL | 2 (1) | 1 (1) | |
| CML | 1 (0.5) | 2 (2) | |
| HLH | 2 (1) | 2 (2) | |
| MDS | 41 (20.2) | 17 (16.8) | |
| MDS/MPN | 2 (1) | 1 (1) | |
| MPAL | 1 (0.5) | 0 (0) | |
| MPN | 29 (14.3) | 16 (15.8) | |
| NHL | 17 (8.4) | 10 (9.9) | |
| T-PLL | 4 (2) | 2 (2) | |
| Disease status at transplant, n (%) | .59 | ||
| Complete response | 118 (58.2) | 63 (62.4) | |
| Partial response | 15 (7.4) | 6 (5.9) | |
| Stable disease | 42 (20.7) | 24 (23.8) | |
| Progressive disease | 2 (1) | 2 (2) | |
| Induction failure | 18 (8.9) | 4 (4) | |
| Untreated | 6 (3) | 2 (2) | |
| NA | 2 (1) | 0 (0) | |
| Recipient/donor CMV serological status, n (%) | .3 | ||
| R−/D− | 71 (35) | 39 (38.6) | |
| R−/D+ | 52 (25.6) | 17 (16.8) | |
| R+/D− | 47 (23.2) | 25 (24.8) | |
| R+/D+ | 33 (16.3) | 19 (18.8) | |
| Unknown | 0 (0) | 1 (1) | |
| Hematopoietic cell transplantation-specific comorbidity index, n (%) | .73 | ||
| 0 to 2 | 67 (33.1) | 32 (31.8) | |
| ≥3 | 136 (67) | 69 (68.3) | |
| Median (range) | 4 (0, 10) | 4 (0, 10) | |
| DRI, n (%) | .39 | ||
| Low | 9 (4.4) | 9 (8.9) | |
| Intermediate | 113 (55.7) | 58 (57.4) | |
| High | 74 (36.5) | 31 (30.7) | |
| Very high | 7 (3.4) | 3 (3) | |
| KPS, n (%) | 1 | ||
| <90 | 108 (53.2) | 54 (53.5) | |
| 100 to 90 | 95 (46.8) | 47 (46.5) | |
| Transplant characteristics | |||
| Conditioning intensity, n (%) | .08 | ||
| Myeloablative (MAC) | 50 (24.6) | 35 (34.7) | |
| Reduced intensity (RIC) | 153 (75.4) | 66 (65.3) | |
| aGVHD prophylaxis regimen, n (%) | .008 | ||
| Tacrolimus/MMF/cyclophosphamide | 25 (12.3) | 23 (22.8) | |
| Tacrolimus/methotrexate | 123 (60.6) | 65 (64.4) | |
| Tacrolimus/rapamycin/methotrexate | 50 (24.6) | 13 (12.9) | |
| Tacrolimus/rapamycin | 5 (2.5) | 0 (0) | |
| Year of transplant | |||
| 2019 | 147 (72.4) | 6 (5.9) | <.05 |
| 2020 | 56 (27.6) | 95 (94.1) | |
| Donor characteristics | |||
| HLA match, n (%) | .77 | ||
| 10/10 | 170 (83.7) | 84 (83.2) | |
| <10/10 | 33 (16.3) | 17 (16.9) | |
| Donor origin, n (%) | .72 | ||
| Domestic | 106 (52.2) | 55 (54.5) | |
| International | 97 (47.8) | 46 (45.5) | |
| Donor age, y, median (range) | 28 (19, 54) | 28 (19, 64) | .09 |
| Donor sex | 1 | ||
| Male | 129 (63.5) | 65 (64.4) | |
| Female | 74 (36.5) | 36 (35.6) | |
| Male recipient/female donor, n (%) | 29 (14.3) | 19 (18.8) | .32 |
ALL, acute lymphoblastic leukemia; AML, acute myeloid leukemia; CLL, chronic lymphocytic leukemia; CML, chronic myeloid leukemia; HLH, hemophagocytic lymphohistiocytosis; KPS, Karnofsky performance score; MDS, myelodysplastic syndrome; MMF, mycophenolate mofetil; MPAL, mixed phenotype acute leukemia; MPN, myeloproliferative neoplasms; NHL, non-Hodgkin lymphoma; T-PLL, T-cell prolymphocytic leukemia.
International PBSCs have longer transit times and overall product age
Characteristics of stem cell products in the cryopreserved and fresh cohorts stratified by domestic or international origin are shown in Table 2. Products destined for cryopreservation were significantly older at the time of processing compared with fresh products (Table 2). Initial TNC concentration and viability were similar between cryopreserved vs fresh products (data not shown). Following processing, final TNC dose (median 7.1 × 10⁸ cells per kg vs 8.0 × 10⁸ cells per kg), final CD34+ dose (7.6 × 10⁶ cells per kg vs 7.7 × 10⁶ cells per kg), and final CD34+ viability (98.0% vs 98.8%) were similar between the cryopreserved vs fresh cohort, respectively. However, final TNC viability was slightly lower in grafts destined for cryopreservation compared with fresh grafts (median 90.2% vs 94.5%; P < .001). For cryopreserved products, TNC viability was measured by trypan blue after thawing prior to infusion. Median viability was 80% (range, 62% to 96%).
Product characteristics
| Fresh | Cryopreserved | ||||
|---|---|---|---|---|---|
| Domestic | International | Domestic | International | ||
| Product characteristics | Median (range) | Median (range) | Median (range) | Median (range) | P |
| Overall age of product (h) | 21 (2-71) | 36 (15-65) | 24 (4-61) | 58 (3 −84) | <.001 |
| Final TNC dose (108 cells/kg)* | 8 (3.8-17.4) | 7.9 (2.4-14.8) | 8 (3.6-16) | 6.9 (2.3-13.8) | .01 |
| Final TNC viability by 7AAD (%)* | 96.2 (37.4-99.4) | 92.9 (77.2-98.9) | 92.6 (71-99.3) | 86.5 (67.8-95.7) | <.001 |
| Final CD34 dose (106 cells/kg)* | 8.1 (1.5-32.5) | 7 (0.8-22.3) | 7.8 (2.1-26.1) | 7.5 (1.4-27.2) | .052 |
| Final CD34 viability by 7AAD (%)* | 98.6 (74.8-99.8) | 98.9 (49.7-99.9) | 98.2 (62.2-99.5) | 98 (92.2-99.7) | .19 |
| Post-thaw TNC viability by TB (%) | N/A | N/A | 80 (62-94) | 79 (67-96) | N/A |
| Age of product breakdown (h) | |||||
| Transit time, median (range) | 9.1 (0.9, 68.2) | 33.8 (13.9, 58.8) | 12.2 (1.5, 58.4) | 43.7 (22.2, 82) | <.0001 |
| Holding time, median (range) | 9.7 (0.4, 27) | 1.2 (0.2, 21.5) | 11.2 (0.4, 22.7) | 12.5 (0.3, 31.2) | <.0001 |
| Processing time, median (range) | 1.0 (1.0, 3.6) | 1.0 (1.0, 2.8) | 1.8 (1.0, 2.5) | 1.8 (1.0, 2) | <.0001 |
N/A, not applicable.
Final TNC and CD34 dose and viability are measured immediately after product processing (performed at our institution) and, in the case of fresh products, immediately prior to delivery to the patient floor for infusion. For cryopreserved products, these are measured after product processing immediately prior to cryopreservation. Upon thaw of cryopreserved products, TNC viability is measured by trypan blue (TB) prior to delivery to patient floor for infusion.
The distribution in overall age of product (between collection and end of processing for either infusion or freezing) was widely different between cryopreserved and fresh grafts (Table 2). Of products intended for cryopreservation, 40.6% was >48 hours old at the end of processing, compared with only 7% of fresh products; 16.8% of cryopreserved products had an age of >60 hours, compared with just 2% of fresh products (P < .0001) (Figure 1A). This increase in overall product age was particularly pronounced for international products from the cryopreserved group (Figure 1B; supplemental Figure 2). Median transit time (from end of collection to receipt at our facility) was increased for cryopreserved products vs fresh (domestic products: 12.2 hours vs 9.1 hours, international products: 43.7 hours vs 33.8 hours; P < .0001), and an increase in holding time (between receipt and beginning of processing) between cryopreserved vs fresh products (domestic products: 11.2 hours vs 9.7 hours, international products: 12.5 hours vs 1.2 hours; P < .0001) accounted for the largest differences in age of product (Table 2).
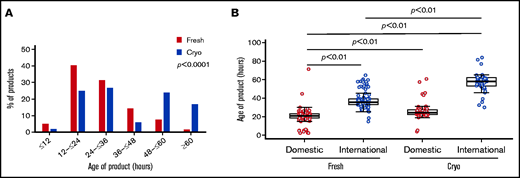
Graft ages. (A) Overall age of product (defined as time in hours from collection to end of processing) varied between fresh (red) and cryopreserved (blue) cohorts. Products in the cryopreserved group were more likely to be ≥48 hours old at end of processing, reflecting longer intervals at all stages: transit, holding, and processing times. Of cryopreserved products, 16.8% was >60 hours old at the end of processing compared with 2% of fresh products (P < .0001). (B) International products (blue) tended to be older than domestic products (red). This difference in length of transit time is particularly pronounced in the cryopreserved group, reflective of changes in transit time during the COVID-19 pandemic. Cryo, cryopreserved.
Graft ages. (A) Overall age of product (defined as time in hours from collection to end of processing) varied between fresh (red) and cryopreserved (blue) cohorts. Products in the cryopreserved group were more likely to be ≥48 hours old at end of processing, reflecting longer intervals at all stages: transit, holding, and processing times. Of cryopreserved products, 16.8% was >60 hours old at the end of processing compared with 2% of fresh products (P < .0001). (B) International products (blue) tended to be older than domestic products (red). This difference in length of transit time is particularly pronounced in the cryopreserved group, reflective of changes in transit time during the COVID-19 pandemic. Cryo, cryopreserved.
Patients receiving cryopreserved grafts have slower platelet engraftment and higher incidence of aGVHD
The median follow-up time among survivors was 16 months (range, 3-25) in the fresh group and 8 months (range, 3-20) in the cryopreserved group. No differences were observed in short-term OS, PFS, NRM, and relapse. One-hundred-day OS was 96% vs 96.5%; PFS was 84% vs 88%. NRM was 2% vs 2%, and relapse was 16% vs 12% in the patients receiving cryopreserved and fresh grafts, respectively (Figure 2A-B; Table 3). International vs domestic origin of product did not lead to differences in these outcomes (supplemental Table 2). Similarly, 6-month OS was 89% vs 89%; PFS was 78% vs 79%. NRM was 2% vs 4.6%, and relapse was 22% vs 20% in the cryopreserved and fresh cohorts, respectively. Multivariable analysis demonstrated that neither conditioning intensity (RIC vs MAC) nor PTCy for GVHD prophylaxis affected OS, PFS, NRM, or relapse (supplemental Table 3). There was no difference in days to neutrophil engraftment (median 15 days vs 14 days), but patients receiving cryopreserved product had slower platelet engraftment compared with fresh (median 21 days vs 18 days, P = .044) (Table 3; Figure 2C-D; supplemental Figure 3). Median days to platelet engraftment between fresh and cryopreserved patients receiving PTCy were not statistically different (21 days vs 25 days; P = .27). Incidence of grade II to IV aGVHD was higher in patients receiving cryopreserved product compared with fresh (100-day cumulative incidence: 17% vs 9%; P = .014) (Table 3; Figure 2E). Increased aGVHD was observed across the spectrum of aGVHD manifestations; however, incidence rates in each organ system are low, limiting statistical analysis (data not shown). Neither PTCy use nor HLA matching was significantly associated with grade II to IV aGVHD (data not shown). There was no difference in incidence of viral reactivations (ie, CMV, adenovirus, BK virus), or fungal infections in the first 100 days between cohorts (supplemental Table 4).
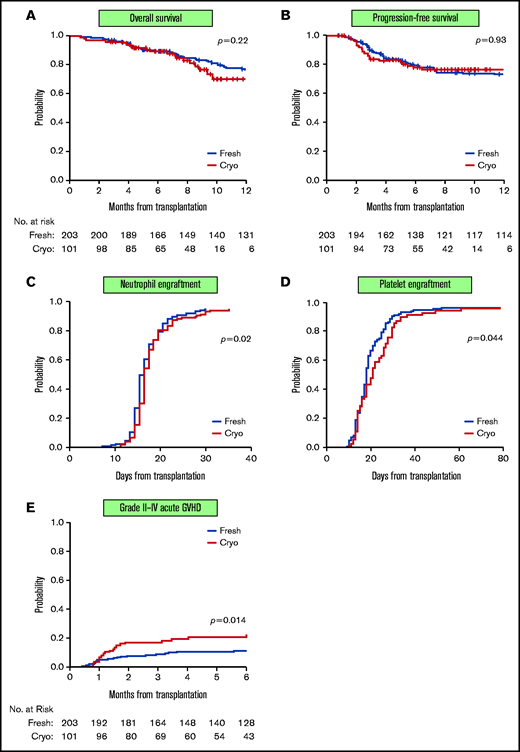
Clinical outcomes of patients receiving cryopreserved vs fresh stem cell products. OS (A) and PFS (B) were similar in patients receiving fresh products (blue line) and cryopreserved products (red line). Patients receiving cryopreserved products had a 1-day delay in neutrophil engraftment (defined as first of 2 consecutive days of ANC > 500 cells per µL) (median 15 days vs 14 days; P = .02) (C) but slower platelet engraftment (defined as first of 3 consecutive days of platelet count >20 000) (median 24 days vs 18 days; P = .044) (D) compared with patients receiving fresh products. (E) Incidence of grade II to IV aGVHD was higher in patients receiving cryopreserved product compared with fresh (100-day cumulative incidence: 17% vs 9%; P = .014).
Clinical outcomes of patients receiving cryopreserved vs fresh stem cell products. OS (A) and PFS (B) were similar in patients receiving fresh products (blue line) and cryopreserved products (red line). Patients receiving cryopreserved products had a 1-day delay in neutrophil engraftment (defined as first of 2 consecutive days of ANC > 500 cells per µL) (median 15 days vs 14 days; P = .02) (C) but slower platelet engraftment (defined as first of 3 consecutive days of platelet count >20 000) (median 24 days vs 18 days; P = .044) (D) compared with patients receiving fresh products. (E) Incidence of grade II to IV aGVHD was higher in patients receiving cryopreserved product compared with fresh (100-day cumulative incidence: 17% vs 9%; P = .014).
Clinical outcomes
| Outcomes and engraftment | Fresh (n = 203) | Cryopreserved (n = 101) | P |
|---|---|---|---|
| OS, % (95% CI) | .22 | ||
| 100 d | 96.5 (93, 98) | 96 (90, 98) | |
| 6 mo | 89 (84, 93) | 89 (81, 94) | |
| PFS, % (95% CI) | .93 | ||
| 100 d | 88 (83, 92) | 84 (75, 90) | |
| 6 mo | 79 (73, 84) | 78 (68, 85) | |
| NRM, % (95% CI) | .23 | ||
| 100 d | 2 (0.7, 5) | 2 (0.4, 6) | |
| 6 mo | 4.6 (2, 8) | 2 (0.4, 6) | |
| Relapse, % (95% CI) | .94 | ||
| 100 d | 12 (8, 17) | 16 (10, 24) | |
| 6 mo | 20 (15, 26) | 22 (14, 31) | |
| Acute grade II-IV GVHD, % (95% CI) | .014 | ||
| 100 d | 9 (5, 13) | 17 (10, 25) | |
| 6 mo | 10.5 (7, 15) | 21 (13, 30) | |
| Acute grade III-IV GVHD, % (95% CI) | .17 | ||
| 100 d | 4.5 (2.2, 8) | 6 (2.5, 12) | |
| 6 mo | 5.5 (3, 9) | 10 (5, 17) | |
| Neutrophil engraftment | .08* | ||
| No engraftment, n (%) | 1 (0.5) | 3 (3) | |
| Engrafted, n (%) | 199 (97.5) | 98 (97) | |
| Days to engraftment, median (range) | 14 (6, 28) | 15 (10, 33) | .02† |
| Never nadir, n (%) | 4 (2) | 0 (0) | |
| Platelet engraftment | .14* | ||
| No engraftment, n (%) | 5 (2.5) | 7 (6.9) | |
| Engrafted, n (%) | 138 (68) | 69 (68.3) | |
| Days to engraftment, median (range) | 18 (9, 109) | 21 (10, 139) | .044† |
| Never nadir, n (%) | 60 (29.6) | 25 (24.8) | |
| Graft failure | .11 | ||
| No, n (%) | 195 (96.1) | 92 (91.1) | |
| Yes, n (%) | 7 (3.4) | 9 (8.9) | |
| Died prior to count recovery, n (%) | 1 (0.5) | 0 (0) | |
| Graft failure: early vs late | .04 | ||
| Early (<100 d), n | 3 | 7 | |
| Late (>100 d), n | 4 | 2 | |
| Effect of age of product on graft failure | sHR (95% CI) | P | |
| Overall age of product: ≥48 h vs <48 h | 4.57 (1.71, 12.3) | .0025 | |
| HLA matching: 10/10 vs <10/10 | 1.2 (0.35, 4.2) | .77 | |
Due to the small number of events (N = 16), univariable analysis was performed using the Fine and Gray model treating death without GF as a competing event.
P value for comparison for 3 categories (no engraftment, engrafted, never nadir).
P value for comparison of time to engraftment for engrafted only.
Patients receiving older grafts have higher incidence of graft failure
Older overall age of product was associated with an increase in graft failure, independent of cryopreservation (Table 3). Of patients who received a product ≥48 hours old, 13.6% experienced graft failure compared with 3.3% of patients receiving a product <48 hours old. The subdistribution hazard ratio (sHR) of age of product ≥48 hours relative to <48 hours for graft failure was 4.57 (95% confidence interval [CI] 1.71-12.3; P = .0025). Patients receiving cryopreserved product had a 2.5-fold higher incidence of graft failure (early or late), although this was not statistically significant (8.9% vs 3.4%; P = .11). Because the incidence rate of graft failure was low (5%), we performed a competing risks regression analysis including PTCy and cryopreservation only (ie, a parsimonious model). In testing main effects, cryopreservation status was significant (P = .02) and PTCy was not significant (data not shown); however, given the small sample size here, this warrants further investigation in future larger studies to confirm. HLA matching was not significantly associated with graft failure (sHR 1.2, 95% CI 0.35, 4.2; P = .77). Because of the small event size, a parsimonious model was used; that is, only HLA matching status and cryopreservation status were included. In this model, cryopreserved product was significantly associated with graft failure (sHR 3.1, 95% CI 1.2, 8.2; P = .02).
Cryopreservation and product age are associated with lower CD3+ chimerism
Patients receiving cryopreserved products were significantly more likely to have CD3+ chimerism ≤50% at both day 30 and day 100 (day 30: 34% cryo vs 14% fresh; P = .0002; day 100: 17% vs 6%; P = .016) (Table 4; supplemental Table 5; supplemental Figure 4A-B). Older overall age of product, lower TNC viability by 7AAD at the end of cell processing, and international product origin were all associated with day 30 CD3+ chimerism ≤50% in univariate analysis (Table 5; supplemental Figure 4C-D). Multivariable logistic analysis shows that cryopreservation conferred the greatest odds for CD3+ chimerism ≤50% at 30 days (odds ratio [OR] 3.19, 95% CI, 1.56-6.52; P = .0015) (Table 6). Age of product ≥48 hours also had greater odds of lower CD3+ chimerism at day 30, although this was not statistically significant (OR 2.46, 95% CI, 0.99-6.10; P = .052) (Table 6). RIC vs MAC conditioning was not associated with lower CD3+ chimerism. PTCy was controlled in multivariable models for day 30 CD3+ chimerism using logistic regression analysis and was not associated with day 30 CD3+ chimerism ≤50% (OR 1.7, 95% CI, 0.7-4.14; P = .24).
Day 30 and 100 CD3 chimerism
| Fresh | Cryopreserved | P | ||
|---|---|---|---|---|
| Day 30 CD3 donor chimerism, n (%) | .0002 | |||
| ≤50% | 28 (14) | 34 (34) | ||
| 51% to 75% | 61 (31) | 18 (18) | ||
| >75% | 109 (55) | 47 (47) | ||
| Day 100 CD3 donor chimerism, n (%) | .016 | |||
| ≤50% | 11 (6) | 16 (17) | ||
| 51% to 75% | 27 (16) | 16 (17) | ||
| >75% | 134 (78) | 61 (66) | ||
Factors influencing D30 CD3 chimerism
| D30 CD3 chimerism | |||
|---|---|---|---|
| >50% | ≤50% | P | |
| Age of product, n (%) | <.001 | ||
| <48 h | 202 (86) | 37 (59.7) | |
| ≥48 h | 33 (14) | 25 (40.3) | |
| %TNC viability-7AAD, n (%) | |||
| <90% | 60 (25.5) | 27 (43.5) | .008 |
| ≥90% | 175 (74.5) | 35 (56.5) | |
| Product origin, n (%) | .03 | ||
| Domestic | 133 (56.6) | 25 (40.3) | |
| International | 102 (43.4) | 37 (59.7) | |
Multivariable model for D30 CD3+ chimerism ≤50%
| Comparison | OR | 95% CI | P | |
|---|---|---|---|---|
| Cryopreserved vs fresh | 3.19 | 1.56 | 6.52 | .0015 |
| Overall age of product: ≥48 h vs <48 h | 2.46 | 0.99 | 6.10 | .052 |
| DRI: high/very high vs low/intermediate | 2.23 | 1.14 | 4.39 | .02 |
| Conditioning intensity: RIC vs MAC | 2.28 | 0.89 | 5.85 | .09 |
Cryopreservation is associated with impaired reconstitution of WBC and T-cell numbers
Analysis of total white blood cell count (WBC) and cell subsets demonstrated that at day 30 after transplantation, WBC was significantly lower in patients receiving cryopreserved products compared with fresh (median WBC 3850 cells per µL vs 6260 cells per µL; P = .0079) (Figure 3A). Absolute numbers of all 3 major cell subsets were decreased in patients receiving cryopreserved products compared with fresh, although the difference in absolute lymphocyte count and absolute monocyte count between cohorts was not statistically significant (supplemental Tables 6 and 7 ). The effect of cryopreservation in multivariable linear regression analysis (after log-transformation) is consistent with the results from univariable analysis.
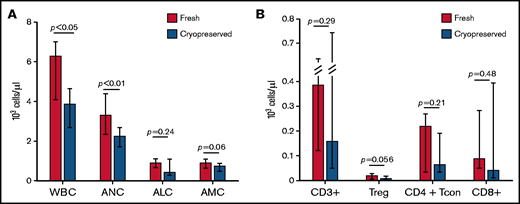
Immune reconstitution. (A) Patients receiving cryopreserved stem cells (blue bars) had lower WBC and neutrophil count (ANC) at 30 days after transplant compared with patients receiving fresh (red bars) (median WBC 3850 cells per µL vs 6260 cells per µL; P = .0079, median ANC 2240 cells per µL vs 3300 cells per µL; P = .016). There were trends toward lower absolute lymphocyte (ALC) and monocyte (AMC) counts in patients receiving cryopreserved grafts, but these were not statistically significant. (B) Similarly, CD3+, CD4+ Tcon and Treg, and CD8+ subsets also had trends toward lower values in cryopreserved vs fresh.
Immune reconstitution. (A) Patients receiving cryopreserved stem cells (blue bars) had lower WBC and neutrophil count (ANC) at 30 days after transplant compared with patients receiving fresh (red bars) (median WBC 3850 cells per µL vs 6260 cells per µL; P = .0079, median ANC 2240 cells per µL vs 3300 cells per µL; P = .016). There were trends toward lower absolute lymphocyte (ALC) and monocyte (AMC) counts in patients receiving cryopreserved grafts, but these were not statistically significant. (B) Similarly, CD3+, CD4+ Tcon and Treg, and CD8+ subsets also had trends toward lower values in cryopreserved vs fresh.
Given the significant differences in CD3+ chimerism at day 30 and day 100, we investigated immune reconstitution of T-cell subsets between patients receiving cryopreserved or fresh products. There was a trend toward decreased total numbers of CD3+, CD4+ T regulatory (Treg), CD4+ conventional T cells, and CD8+ cells in patients receiving cryopreserved grafts at day 30 after transplantation (Figure 3B). Patients who received a cryopreserved product had lower absolute numbers of conventional CD4+ naive T cells and CD4+ effector memory cells at day 30 (supplemental Table 6). In the Treg compartment, cryopreservation of product was associated with lower absolute numbers of naive, effector memory, and terminally differentiated T effector memory RA cells (supplemental Figures 5-6; supplemental Table 4). There were no differences observed in other CD4+ or CD8+ subsets or in ratios of Tregs to CD8+ or CD4+ T cells. The same analysis was performed on peripheral blood mononuclear cells from a subset of patients at day 100 after transplant, at which time WBC and T-cell recovery in the cryopreserved group had improved somewhat, but remained lower than fresh products at day 100, particularly in the CD4+ Treg and CD4+ Tcon and Treg as opposed to the total CD3+ and CD8+ T-cell compartments (supplemental Table 6).
Discussion
The worldwide spread of COVID-19 and ensuing pandemic necessitated swift action on the part of transplant centers and national donor registries to adopt practices to enable continued safe delivery of stem cell transplantations. Cryopreservation of allogeneic PBSCs became a practical option during the pandemic to ensure delivery of grafts in a timely manner and allow patients to continue undergoing this procedure. Here, we analyzed our single-institution experience with cryopreserved vs fresh PBSCs from 2019 to 2020, a period spanning ∼1 year before and after the start of the pandemic. Although short-term outcomes were similar in recipients of fresh or cryopreserved grafts, we noted a trend toward increased graft failure, particularly for grafts with overall product age ≥48 hours, and impaired immune reconstitution among recipients of cryopreserved grafts. In addition, we observed delayed platelet engraftment in the cryopreserved cohort compared with controls, as well as an increase in the incidence of acute grade II to IV GVHD. Whether there will be any difference in long-term outcomes, such as chronic GVHD, disease relapse, and NRM, will require extended follow-up. A prior study on outcomes using cryopreserved PBSCs did not show a difference in clinical outcomes despite having a longer follow-up interval.6 However, cryopreserved grafts were composed mostly of related donor products, so these likely experienced shorter transit and holding times, which may explain the differences observed.
Peripheral blood CD3+ chimerism was significantly impaired at day 30 and 100 after transplant in patients receiving cryopreserved PBSCs, with 34% of patients having CD3+ chimerism ≤50%, compared with 14% patients who received fresh PBSCs. This effect appears to be independent of conditioning regimen intensity and exposure to PTCy. As we and others have previously reported, low CD3+ chimerism early after transplant predicts worse OS and higher rates of relapse 1 to 5 years after transplant, particularly for patients receiving reduced-intensity conditioning.17-21 Thus, given the relatively short follow-up reported here, deleterious effects associated with lower chimerism following receipt of cryopreserved stem cell products may not yet be evident. Longer follow-up is required to fully assess the safety of using cryopreserved stem cell products reflected by late relapse, cGVHD, and OS.
In addition to the widespread adoption of cryopreservation, the COVID-19 pandemic led to disruptions in air travel, complicating stem cell product delivery, particularly across international lines. In the United States, the National Donor Marrow Program developed alternate routes for delivery of cells along a regional hub model in collaboration with international donor networks. Despite these heroic efforts, our data indicate that transit times were longer during the pandemic compared with prepandemic controls, and this difference disproportionately affected international products compared with domestic. Older product ages showed a trend toward lower day 30 CD3+ chimerism in addition to the impact of cryopreservation. Overall product age ≥48 hours also conferred an sHR of 4.57 for graft failure, whereas cryopreservation yielded a 2.5-fold increase in failure rate that was not significant. These results suggest that patients who receive older products, especially if also cryopreserved, should be monitored carefully for graft failure and T-cell engraftment after transplantation.
Finally, cryopreservation is associated with lower total WBC at 30 days after transplantation, as well as decreases in several T-cell subsets. We have previously shown that lower WBC at 1 to 3 months after transplant was associated with lower 5-year OS and PFS.22 The impairment in reconstitution of various T-cell subsets, particularly the Treg cells, is striking. Given the important role previously described for adequate Treg reconstitution in predicting improved OS,23 lower incidence of GVHD,24 and mediation of a GVL effect,25 the impairment in Treg reconstitution described may be of clinical significance and warrants further investigation. Cryopreservation is known to alter surface expression of molecules such as L-Selectin (CD62L) that mediate homing to various tissues.26 This may affect engraftment of mature cells as well as immature cells in stem cell products and may help explain some of the changes in immune recovery observed with cryopreserved products.
Our study has several limitations, primarily having a relatively small number of patients treated at a single center. Stem cell products were handled and under one processing laboratory’s standard operating procedures, which may limit generalizability of our data to other centers and practices. Nevertheless, the data shown here provide compelling evidence that cryopreservation of PBSCs and age of products derived from URDs may have negative consequences, and the choice of whether to cryopreserve a PBSC graft should be carefully considered for each individual transplant recipient.
The COVID-19 pandemic had far-reaching influences on clinical practice across myriad specialties. In the field of stem cell transplantation, operations required effective multidisciplinary international collaborative efforts to ensure continued delivery of stem cell products and patient care. When the pandemic abates, many aspects of transplantation, such as delays in international delivery of stem cell products, are likely to return to pre–COVID-19 norms. However, other practices may remain. Cryopreservation of stem cell products offers an opportunity for increased flexibility in coordination of stem cell donation and delivery as well as timing of conditioning chemotherapy, and data published thus far suggest that short-term clinical outcomes are similar compared with transplants using fresh products. However, our data indicate that caution is necessary in utilizing cryopreserved stem cell products for allogeneic transplantation, particularly those requiring longer times in transit holding and thus of older overall product age at end of processing. Although early clinical outcomes do not appear to be compromised, T-cell chimerism and reconstitution are impaired, which may lead to compromise in longer-term outcomes. Longer follow-up and further investigation into these findings are required to fully explore how cryopreservation and age of allogeneic stem cell products may impact transplant safety and efficacy.
Acknowledgments
The authors acknowledge the National Donor Marrow Program (NMDP) for their efforts to maintain access to donors throughout the ongoing pandemic and the DFCI/HCC clinical oncology support staff for continued care of these patients. The authors thank the Ted and Eileen Pasquarello Tissue Bank and Doreen Hearsey for prospective collection and processing of serial blood samples. The authors also thank the Connell and O'Reilly Families Cell Manipulation Core Facility (CMCF) at DFCI for continuous efforts in processing stem cell products and for providing data for this paper.
This work was supported by the National Institutes of Health, National Cancer Institute grant P01CA229092.
Authorship
Contribution: K.M., T.M.K., R.J.S., M.G., and V.T.H. conceived the project and designed the study; H.T.K. designed, performed, and interpreted the statistical analysis; K.M., T.M.K., H.M.G., and D.L. participated in identification, collection, and interpretation of patient information; A.W. and C.G.R. performed flow cytometry data acquisition and analysis; H.M.G. and S.N. provided cell product data and processing methodology; K.M., H.T.K., T.M.K., H.M.G., D.L., C.C., J.H.A., J.K., J.R., R.M.S., R.R., C.J.W., R.J.S, S.N., V.T.H., and M.G. participated in manuscript writing and review and all authors provided final approval of the manuscript.
Conflict-of-interest disclosure: C.J.W. holds equity in BioNTech and receives research funding from Pharmacyclics. J.R. received research funding from Amgen, Equillium, Kite Pharma, and Novartis and served on advisory boards for Akron, Avrobio, Clade, Garuda, Immunitas, LifeVault, Rheos, Talaris, and TScan. J.K. reports research support from Amgen, Equillium, BMS, Miltenyi Biotec, Regeneron, and Clinigen and consulting income from Amgen, Equillium, and Moderna Therapeutics, and is a scientific advisory board member for Cugene and Therakos. S.N. reports ad hoc advisory boards for Novartis, Kite/Gilead, and Nkarta. R.J.S. serves on the board of directors for Kiadis and Be The Match/National Marrow Donor Program; provided consulting for Gilead, Rheos Therapeutics, Jazz, and VOR Biopharma; and is on the Data Safety Monitoring board for Juno. The remaining authors declare no competing financial interests.
Correspondence: Mahasweta Gooptu, 450 Brookline Ave, Boston, MA 02215; e-mail: Mahasweta_Gooptu@dfci.harvard.edu.

