

Key Points
In vivo experiments demonstrate that HGAL expression in lymphoma decreases tumor dissemination and prolongs animal survival.
HGAL inhibits cell motility by interacting with multiple cytoskeletal proteins, thereby affecting cell motility by multiple mechanisms.

Abstract
Human germinal center–associated lymphoma (HGAL) is an adaptor protein specifically expressed in germinal center lymphocytes. High expression of HGAL is a predictor of prolonged survival of diffuse large B-cell lymphoma (DLBCL) and classic Hodgkin lymphoma. Furthermore, HGAL expression is associated with early-stage DLBCL, thus potentially limiting lymphoma dissemination. In our previous studies, we demonstrated that HGAL regulates B-cell receptor signaling and cell motility in vitro and deciphered some molecular mechanisms underlying these effects. By using novel animal models for in vivo DLBCL dispersion, we demonstrate here that HGAL decreases lymphoma dissemination and prolongs survival. Furthermore, by using an unbiased proteomic approach, we demonstrate that HGAL may interact with multiple cytoskeletal proteins thereby implicating a multiplicity of effects in regulating lymphoma motility and spread. Specifically, we show that HGAL interacts with tubulin, and this interaction may also contribute to HGAL effects on cell motility. These findings recapitulate previous observations in humans, establish the role of HGAL in dissemination of lymphoma in vivo, and explain improved survival of patients with HGAL-expressing lymphomas.
Introduction
The cytoskeleton, functioning as a dynamic regulator of cellular shape and membrane organization in lymphocytes, plays a key role in B-cell motility and B-cell receptor (BCR) signaling and in orchestrating the systemic B-cell immune responses.1-5 Consequently, tight regulation of the cytoskeleton, at both intra- and extracellular levels, is critical for intact and effective immunity. Notably, alterations in the cytoskeleton function may contribute to lymphoma pathogenesis.6-9 Indeed, a previous study10 in mice identified regulators of actin dynamics and cell motility as key determinants of lymphoma progression in vivo. In that study, inhibition of cytoskeletal remodeling resulted in decreased lymphoma progression and dissemination. Concordantly, recent data show that aberrations in the motility-regulating proteins (eg, GNA13, S1PR2, and RhoA) may also contribute to lymphoma pathogenesis in humans.6-9 However, the roles of lymphocyte-specific intracellular proteins that by regulating the cytoskeleton control lymphomagenesis, lymphoma migration, and dissemination are largely unknown.
B-cell lymphomas arise from normal cellular counterparts at different stages of B-cell ontogeny. Biological features of lymphomas are determined by normal or deregulated expression of genes controlled by ontogeny-specific transcriptional programs or genetic aberrations, respectively. Many B-cell lymphomas arise from lymphocytes in the germinal center (GC).11 We have cloned the human germinal center–associated lymphoma (HGAL) gene, also known as germinal center-expressed transcript 2 (GCET2) or germinal center–associated signaling and motility (GCSAM), which is a gene specifically expressed in GC B-cell lymphocytes and induced during immune responses. SCA1-HGAL transgenic mice develop hypergammaglobulinemia, polyclonal B-cell lymphoid hyperplasia, and systemic reactive AA amyloidosis [a form of amyloidosis that incorporates serum amyloid A protein], all of which lead to shortened survival.12 In contrast, conditional expression of HGAL in mice at different stages of hematopoietic development using 3 different approaches to initiate expression of HGAL in hematopoietic stem cells, pro-B cells or GC B cells, respectively, leads to the development of GC B-cell type diffuse large B-cell lymphoma (DLBCL) in all 3 animal models.13 We also observed larger GCs in mice in which HGAL expression was initiated in GC B cells after immune stimulation.13
The mechanism of HGAL-mediated lymphomagenesis is unknown. We have shown that HGAL regulates both BCR signaling and cell motility, 2 processes central to the successful completion of the GC reaction and lymphomagenesis.12,14,15 We showed that HGAL increases BCR signaling by binding to and enhancing Syk kinase activity and by regulating the immunologic synapse formation.12,16 HGAL also impedes cell motility in vitro by inhibiting the ability of myosin to translocate actin by directly interacting with both F-actin and myosin II.14,17 We also showed that HGAL activates RhoA signaling by directly interacting with the RhoA-specific guanine nucleotide exchange factors (GEFs) PDZ-RhoGEF and LARG, which may contribute to its effects on cell motility.15 In addition, knock down of PDZ-RhoGEF and LARG-enhanced SDF1 chemotaxis of HGAL-expressing lymphoma cells, suggesting that HGAL inhibits SDF1-induced chemotaxis by activating RhoA.15 These functions of HGAL may be important for both the normal GC reaction in which lymphocytes demonstrate limited migration between the dark and light zones but lack the ability to exit the GC niche,18 and for predisposing to lymphomas by permitting ongoing GC-associated mutagenesis.
We demonstrated that high expression of HGAL is a predictor of prolonged survival of patients with DLBCL and classic Hodgkin lymphoma.19-21 We also demonstrated that HGAL expression in patients with DLBCL is associated with a limited stage of lymphoma at presentation,22 but whether this is a result of a direct effect of HGAL on the motility of lymphoma B cells and their dissemination is currently unknown. By using novel in vivo models and proteomic approaches, we demonstrate here that HGAL inhibits lymphoma B-cell motility and dissemination likely via interaction with multiple components of the cellular cytoskeleton.
Methods
Affinity capture of biotinylated proteins and protein identification by mass spectrometry
Raji green fluorescent protein (GFP), Raji GFP-BirA*, and Raji HGAL-BirA* cells were used for affinity capture of biotinylated proteins as previously described.23 Briefly, cells were incubated for 24 hours in complete media supplemented with 50 µM biotin. After 3 washes with phosphate-buffered saline, cells (for small-scale analysis, <107; for large scale analysis, 4 × 10⁷) were lysed at 25°C in 1 mL lysis buffer (50 mM tris(hydroxymethyl)aminomethane [Tris; pH 7.4], 500 mM NaCl, 0.4% sodium dodecyl sulfate [SDS], 5 mM EDTA, 1 mM dithiothreitol [DTT], and 1× complete protease inhibitor [Roche]) and sonicated. Triton X-100 was added to 2% final concentration. After further sonication, an equal volume of 50 mM Tris (pH 7.4) at 4°C was added before additional sonication (subsequent steps at 4°C) and centrifugation at 16 000g relative centrifugal force. Supernatants were incubated with 600 µL Dynabeads (MyOne Streptavidin C1, Invitrogen) overnight. Beads were collected and washed twice for 8 minutes at 25°C (all subsequent steps at 25°C) in 1 mL wash buffer 1 (2% SDS in distilled H2O). This was repeated once with wash buffer 2 (0.1% deoxycholate, 1% Triton X-100, 500 mM NaCl, 1 mM EDTA, and 50 mM N-2-hydroxyethylpiperazine-N′-2-ethanesulfonic acid [HEPES; pH 7.5]), once with wash buffer 3 (250 mM LiCl, 0.5% NP-40, 0.5% deoxycholate, 1 mM EDTA, and 10 mM Tris [pH 8.1]) and twice with wash buffer 4 (50 mM Tris [pH 7.4] and 50 mM NaCl). Then, 10% of the sample was reserved for western blot analysis. Bound proteins were removed from the magnetic beads with 50 µL of Laemmli SDS-sample buffer saturated with biotin at 98°C. Proteins eluted from the streptavidin beads by SDS-sample buffer were reduced, alkylated, and separated by 10% SDS-polyacrylamide gel electrophoresis (SDS-PAGE). Separated proteins were visualized by colloidal Coomassie blue staining. The whole gel lane was cut into 24 equal-size gel bands, de-stained, and submitted to tryptic in-gel digestion and protein identification by mass spectrometry at Harvard University Mass Spectrometry core facility. The resulting set of proteins interacting with HGAL was tested for overlap with the Gene Ontology biological processes database using a hypergeometric test, with P values corrected for multiple hypothesis testing using the Benjamini-Hochberg procedure. Significant overlaps are reported with processes related to the cytoskeleton.
Statistical analysis
All statistical analyses were performed using GraphPad Prism 6.0 (GraphPad Software; https://www.graphpad.com/). Statistical significance was determined by Student t test or ANOVA. P value < .05 was considered significant. Detailed descriptions of other methods can be found in the supplemental Data.
Results
HGAL expression inhibits in vivo lymphoma dissemination and prolongs survival of mice harboring human lymphoma
We previously demonstrated that HGAL expression inhibits the motility, chemokinesis, and chemotaxis of lymphocytes and lymphoma cells in vitro and is associated with longer survival of patients with DLBCL.15,17,19 To further investigate the potential role HGAL in tumor dissemination in vivo, we initially used a well-established breast carcinoma cell line with a tendency to metastasize to the lungs (MDA-MB-231, subline 4175) that is commonly used to study tumor dissemination.24 We established a 4175 cell line stably co-expressing pCDH-HGAL-GFP or control plasmid together with a pLV430G oFL T2A mCherry luciferase expression plasmid (supplemental Figure 1A). A total of 3 × 10⁶ cells were injected through the tail vein into BALB/c nude mice, and tumor cell localization and mCherry luciferase intensity were noninvasively tracked once per week by using a Lumina XRMS in vivo imaging system (Figure 1A). In animals harboring the HGAL-expressing 4175 subline cells compared with control cells, there was a statistically significant decrease in dissemination to the lungs, as measured by photon flux (P = .002; Figure 1B) and the number of tumor metastases detected when the mice were euthanized (P = .001; Figure 1C-D). These findings indicate that HGAL expression in the tumor cells decreases the number and size of metastatic tumors established in the lungs. This in vivo effect was likely attributed to decreased cellular motility and tissue invasion because the 4175-HGAL cells also had significantly decreased motility in a wound assay (P = .0051; supplemental Figure 1B-C) and invasion in a 3D spheroid cell invasion assay at days 5 and 6 (P = .0002; Figure 1E-F) compared with 4175-Mock cells. No difference in proliferation was observed in cells tracked for 15 days (supplemental Figure 1D).
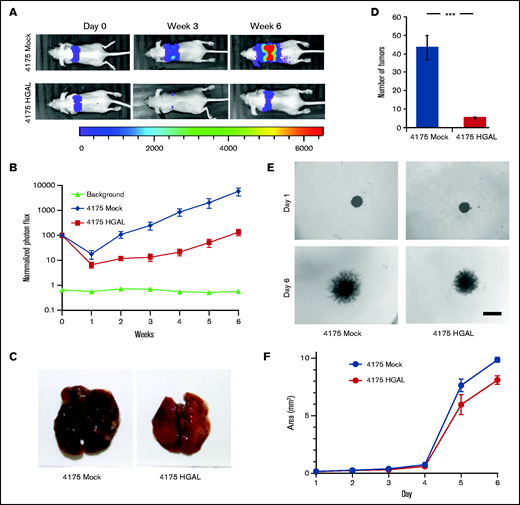
HGAL expression inhibits breast cancer cell growth, metastasis, and invasion. Mice were injected intravenously with 3 × 10⁶ luciferase-transduced human MDA-MB-231–derived breast cancer subline 4175 cells. D-luciferin was injected intraperitoneally (150 mg/kg body weight) 15 minutes before acquiring images. Bioluminescence images were taken once per week. (A) Representative bioluminescent images of mice with subline 4175 tumors. (B) Tumor growth curve based on photon flux intensity (10 mice in each group) with significant difference between the mouse cohorts with 4175 Mock and 4175 HGAL tumors (P = .002). Mice that were not injected (background; 5 mice) served as a control for background photon flux intensity. Normalized photon flux represents tumor photon flux (luminescence intensity) at the indicated time relative to photon flux measured after cell injection on day 0 that was set to a value of 100. (C) A representative images of lungs with 4175 Mock and 4175 HGAL tumors. (D) Number of lung tumors in mice injected with 4175 Mock and 4175 HGAL cells (P = .001). (E) Representative images of in vitro 3D spheroid cell invasion in 4175 Mock and 4175 HGAL cells. Scale bar represents 200 µm. (F) Quantitative analysis of surface area of 4175 Mock and 4175 HGAL spheroids over a 6-day period (P = .0002). Experiments in panels D, E, and F were performed in triplicate and were repeated twice. ***P = .001.
HGAL expression inhibits breast cancer cell growth, metastasis, and invasion. Mice were injected intravenously with 3 × 10⁶ luciferase-transduced human MDA-MB-231–derived breast cancer subline 4175 cells. D-luciferin was injected intraperitoneally (150 mg/kg body weight) 15 minutes before acquiring images. Bioluminescence images were taken once per week. (A) Representative bioluminescent images of mice with subline 4175 tumors. (B) Tumor growth curve based on photon flux intensity (10 mice in each group) with significant difference between the mouse cohorts with 4175 Mock and 4175 HGAL tumors (P = .002). Mice that were not injected (background; 5 mice) served as a control for background photon flux intensity. Normalized photon flux represents tumor photon flux (luminescence intensity) at the indicated time relative to photon flux measured after cell injection on day 0 that was set to a value of 100. (C) A representative images of lungs with 4175 Mock and 4175 HGAL tumors. (D) Number of lung tumors in mice injected with 4175 Mock and 4175 HGAL cells (P = .001). (E) Representative images of in vitro 3D spheroid cell invasion in 4175 Mock and 4175 HGAL cells. Scale bar represents 200 µm. (F) Quantitative analysis of surface area of 4175 Mock and 4175 HGAL spheroids over a 6-day period (P = .0002). Experiments in panels D, E, and F were performed in triplicate and were repeated twice. ***P = .001.
To extrapolate these observations to lymphoma, we established 3 in vivo DLBCL models using U2932, TMD8, and BJAB cells stably expressing the pLV430G oFL T2A mCherry luciferase plasmid. After tail vein injection of 5 × 10⁶ cells, these DLBCL tumors disseminated to the spleen, lymph nodes, and extranodal sites, and this dissemination could be tracked by an in vivo imaging system (Figure 2A) and confirmed when the mice were euthanized. To examine the role of HGAL in DLBCL dissemination, HGAL-negative U2932 and TMD8 cells were stably transfected with pCDH-HGAL-GFP or control plasmids (supplemental Figure 2A-B). Alternatively, using CRISPR/Cas9 genome editing, we knocked out HGAL expression in BJAB cells (supplemental Figure 2C). In all animal models, the engraftment was detected on day 7, as indicated by the lowest measured photon flux that was above the signal observed in control animals that were not injected with cells (Figures 2A and 3A; supplemental Figure 3A). We observed a statistically significant decrease in whole body tumor volume as measured by photon flux in both HGAL-expressing U2932 (P = .0042; Figure 2A-B) and TMD8 (P = .0038; supplemental Figure 3A-B) models. This decrease was associated with a statistically significant decrease in the number of tumor sites in both HGAL-expressing U2932 (P = .0001; Figure 2C) and TMD8 (P = .0051; supplemental Figure 3C) models. Concordantly, HGAL knockout in the BJAB cells increased the whole body tumor volume as measured by photon flux (P = .0031; Figure 3A-B) and was associated with a statistically significant increase in the number of tumor sites (P < .0001; Figure 3C). Furthermore, in all lymphoma models, HGAL expression was associated with a less aggressive tumor behavior, as evidenced by longer survival of animals harboring HGAL-expressing DLBCL compared with controls not expressing HGAL (Figures 2D and 3D; supplemental Figure 3D). Notably, the observed in vivo findings could not be attributed to different engraftment of tumors expressing or not expressing HGAL, as indicated by similar photon fluxes on engraftment day 7 after cell injection (Figures 2A and 3A; supplemental Figure 3A). In addition, the observed in vivo findings could not be attributed to different tumor growth and cell proliferation because cells that expressed HGAL and those that did not demonstrated similar in vitro proliferation during 15 days of sequential testing (supplemental Figure 4). Rather, they are likely attributed to decreased cellular motility and tissue invasion, because the DLBCL cell lines expressing HGAL exhibited decreased spontaneous or stimulated motility (Figure 4A) and invasion (supplemental Figure 5A-D).
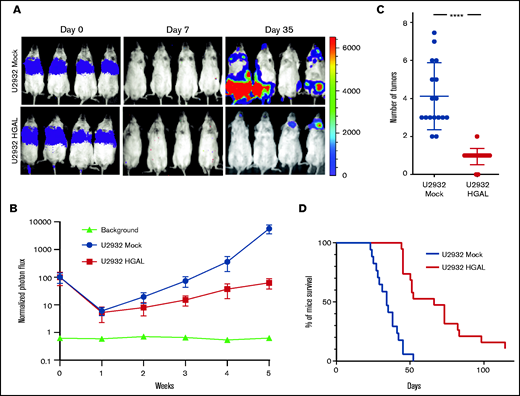
HGAL expression inhibits U2932 lymphoma cell growth and metastasis and prolongs mouse survival. Mice were injected intravenously with 5 × 10⁶ luciferase-transduced human lymphoma cells from cell line U2932. D-luciferin was injected intraperitoneally (150 mg/kg body weight) 15 minutes before acquiring images. Bioluminescence images were taken once per week. (A) Representative bioluminescent images of mice with U2932 Mock and U2932 HGAL lymphoma. (B) Tumor growth curve based on photon flux intensity (each group had 17 mice) with significant differences between the U2932 Mock and U2932 HGAL mouse cohorts (P = .0042). Mice that were not injected (background; 5 mice) served as a control for background photon flux intensity. Normalized photon flux represents tumor photon flux (luminescence intensity) at the indicated time relative to photon flux measured after cell injection on day 0 that was set to value of 100. (C) Number of individual sites with lymphoma involvement in U2932 Mock and U2932 HGAL mice (P = .0001). (D) Kaplan-Meier plots of mouse survival demonstrating significant difference between the U2932 Mock and U2932 HGAL mice (P = .0001). ****P = .0001.
HGAL expression inhibits U2932 lymphoma cell growth and metastasis and prolongs mouse survival. Mice were injected intravenously with 5 × 10⁶ luciferase-transduced human lymphoma cells from cell line U2932. D-luciferin was injected intraperitoneally (150 mg/kg body weight) 15 minutes before acquiring images. Bioluminescence images were taken once per week. (A) Representative bioluminescent images of mice with U2932 Mock and U2932 HGAL lymphoma. (B) Tumor growth curve based on photon flux intensity (each group had 17 mice) with significant differences between the U2932 Mock and U2932 HGAL mouse cohorts (P = .0042). Mice that were not injected (background; 5 mice) served as a control for background photon flux intensity. Normalized photon flux represents tumor photon flux (luminescence intensity) at the indicated time relative to photon flux measured after cell injection on day 0 that was set to value of 100. (C) Number of individual sites with lymphoma involvement in U2932 Mock and U2932 HGAL mice (P = .0001). (D) Kaplan-Meier plots of mouse survival demonstrating significant difference between the U2932 Mock and U2932 HGAL mice (P = .0001). ****P = .0001.
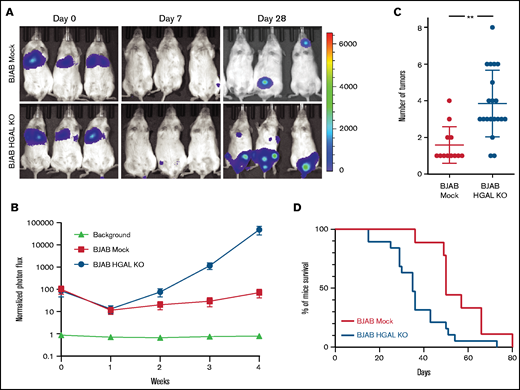
HGAL expression inhibits BJAB lymphoma cell growth and metastasis and prolongs mouse survival. Mice were injected intravenously with 5 × 10⁶ luciferase-transduced human lymphoma cells from cell line BJAB. D-luciferin was injected intraperitoneally (150 mg/kg body weight) 15 minutes before acquiring images. Bioluminescence images were taken once per week. (A) Representative bioluminescent images of mice with BJAB Mock and BJAB HGAL knockout (KO) lymphoma. (B) Tumor growth curve based on photon flux intensity (Mock group, 12 mice; HGAL KO group, 19 mice) with significant difference between the mouse cohorts with BJAB Mock and BJAB HGAL KO lymphomas (P = .0038). Mice that were not injected (background; 5 mice) served as a control for background photon flux intensity. Normalized photon flux represents tumor photon flux (luminescence intensity) at the indicated time relative to photon flux measured after cell injection on day 0 that was set to value of 100. (C) Number of individual sites with lymphoma involvement in BJAB Mock and BJAB HGAL KO mice (P = .0051). (D) Kaplan-Meier plots of mouse survival demonstrating significant difference between the BJAB Mock and BJAB HGAL KO mice (P = .0051). **P <.01.
HGAL expression inhibits BJAB lymphoma cell growth and metastasis and prolongs mouse survival. Mice were injected intravenously with 5 × 10⁶ luciferase-transduced human lymphoma cells from cell line BJAB. D-luciferin was injected intraperitoneally (150 mg/kg body weight) 15 minutes before acquiring images. Bioluminescence images were taken once per week. (A) Representative bioluminescent images of mice with BJAB Mock and BJAB HGAL knockout (KO) lymphoma. (B) Tumor growth curve based on photon flux intensity (Mock group, 12 mice; HGAL KO group, 19 mice) with significant difference between the mouse cohorts with BJAB Mock and BJAB HGAL KO lymphomas (P = .0038). Mice that were not injected (background; 5 mice) served as a control for background photon flux intensity. Normalized photon flux represents tumor photon flux (luminescence intensity) at the indicated time relative to photon flux measured after cell injection on day 0 that was set to value of 100. (C) Number of individual sites with lymphoma involvement in BJAB Mock and BJAB HGAL KO mice (P = .0051). (D) Kaplan-Meier plots of mouse survival demonstrating significant difference between the BJAB Mock and BJAB HGAL KO mice (P = .0051). **P <.01.
![HGAL expression inhibits cell migration in vitro. (A) Transwell migration assays showed that exogenous HGAL expression in U2932 and TMD8 lymphoma cells decreased chemokinesis and SDF1-induced chemotaxis but it augmented IL-6–mediated motility inhibition. Knockdown of endogenous HGAL in BJAB lymphoma cells increased chemokinesis and SDF1-induced chemotaxis but it abrogated IL-6–mediated motility inhibition. (B) Confocal micrographs (shown as maximum projections) within the anterior chamber of the eye after injection of U2932 cells with (green) and without (red) HGAL expression. Also shown are the merged images including the backscatter channel showing the iris (gray). The HGAL+ and HGAL– cells were premixed in equal amounts (100 000 cells) and injected into the anterior chamber. HGAL+ cells were visualized based on GFP expression, and the HGAL– cells were visualized based on Cell-Tracker dye labeling ∼1 hour before injection. (C-D) In vivo measurements of relative densities and egress indices at days 1 (24 hours) and 3 after injection into the anterior chamber of mouse eyes for HGAL+ or HGAL– U2932 and BJAB cells. The relative density (shown as mean ± standard error of the mean [SEM]) was calculated as the ratio (shown as %) of cells remaining in the eye after the injection on days 1 and 3 relative to the baseline on day 0 (day of injection). The egress index was calculated as the inverse of the ratio of the mean of ratios for each cell type on days 1 and 3. Data shown in panel A are based on 6 independent measurements repeated in 2 experiments. Data shown in panels C and D are based on 6 independent measurements in 3 mice in duplicates. *P <.05; **P < .01; ***P < .001; ****P < .0001. ns, not significant.](https://ash.silverchair-cdn.com/ash/content_public/journal/bloodadvances/5/23/10.1182_bloodadvances.2021004304/2/m_advancesadv2021004304f4.png?Expires=1765916027&Signature=ay~rc6q2jp0wzCNrBXCNenkTkBeElYDo5oBY~0CIuBM4jg2tAza6YEHcuJBcXjSggFuCHl9JsBo8m0mmWtoWtVi~8mTTuaxk1hrzB1p8AEUkSZZCBf59hDIfiOflTyA-8EFUBdx7x02WpA5Q-~qDauS6g7R-L9HJIzgRwJqExN-MFIyKVktvypxPwLMKn0V953Fr~xJdOsTKWMzLLuqdN9Fv1PYv8BpGpAwYvte2iz1OM6gJwDMBpIkxaJHFLYiDWqZjsPLBXCflyUX-9s~Oi3Jnz849OR6MI34GGpRApkc3wSjjeeoRM~RCzYvLz6pQSZ-KbYRodhN8OgQhD4n-lA__&Key-Pair-Id=APKAIE5G5CRDK6RD3PGA)
HGAL expression inhibits cell migration in vitro. (A) Transwell migration assays showed that exogenous HGAL expression in U2932 and TMD8 lymphoma cells decreased chemokinesis and SDF1-induced chemotaxis but it augmented IL-6–mediated motility inhibition. Knockdown of endogenous HGAL in BJAB lymphoma cells increased chemokinesis and SDF1-induced chemotaxis but it abrogated IL-6–mediated motility inhibition. (B) Confocal micrographs (shown as maximum projections) within the anterior chamber of the eye after injection of U2932 cells with (green) and without (red) HGAL expression. Also shown are the merged images including the backscatter channel showing the iris (gray). The HGAL+ and HGAL– cells were premixed in equal amounts (100 000 cells) and injected into the anterior chamber. HGAL+ cells were visualized based on GFP expression, and the HGAL– cells were visualized based on Cell-Tracker dye labeling ∼1 hour before injection. (C-D) In vivo measurements of relative densities and egress indices at days 1 (24 hours) and 3 after injection into the anterior chamber of mouse eyes for HGAL+ or HGAL– U2932 and BJAB cells. The relative density (shown as mean ± standard error of the mean [SEM]) was calculated as the ratio (shown as %) of cells remaining in the eye after the injection on days 1 and 3 relative to the baseline on day 0 (day of injection). The egress index was calculated as the inverse of the ratio of the mean of ratios for each cell type on days 1 and 3. Data shown in panel A are based on 6 independent measurements repeated in 2 experiments. Data shown in panels C and D are based on 6 independent measurements in 3 mice in duplicates. *P <.05; **P < .01; ***P < .001; ****P < .0001. ns, not significant.
HGAL expression inhibits cell migration in vitro. (A) Transwell migration assays showed that exogenous HGAL expression in U2932 and TMD8 lymphoma cells decreased chemokinesis and SDF1-induced chemotaxis but it augmented IL-6–mediated motility inhibition. Knockdown of endogenous HGAL in BJAB lymphoma cells increased chemokinesis and SDF1-induced chemotaxis but it abrogated IL-6–mediated motility inhibition. (B) Confocal micrographs (shown as maximum projections) within the anterior chamber of the eye after injection of U2932 cells with (green) and without (red) HGAL expression. Also shown are the merged images including the backscatter channel showing the iris (gray). The HGAL+ and HGAL– cells were premixed in equal amounts (100 000 cells) and injected into the anterior chamber. HGAL+ cells were visualized based on GFP expression, and the HGAL– cells were visualized based on Cell-Tracker dye labeling ∼1 hour before injection. (C-D) In vivo measurements of relative densities and egress indices at days 1 (24 hours) and 3 after injection into the anterior chamber of mouse eyes for HGAL+ or HGAL– U2932 and BJAB cells. The relative density (shown as mean ± standard error of the mean [SEM]) was calculated as the ratio (shown as %) of cells remaining in the eye after the injection on days 1 and 3 relative to the baseline on day 0 (day of injection). The egress index was calculated as the inverse of the ratio of the mean of ratios for each cell type on days 1 and 3. Data shown in panel A are based on 6 independent measurements repeated in 2 experiments. Data shown in panels C and D are based on 6 independent measurements in 3 mice in duplicates. *P <.05; **P < .01; ***P < .001; ****P < .0001. ns, not significant.
Dissemination of lymphoma cells depends on the ability of the cells to invade and migrate through tissues.25 Although our findings indicate that HGAL regulates cell motility and migration, its effects on tissue invasion and remodeling are unknown. These processes are commonly mediated by members of a family of zinc-dependent endopeptidases (matrix metalloproteinases [MMPs]) that act on the extracellular matrix and are responsible for the breakdown of connective tissues.26 Therefore, we examined the effect of HGAL on MMP activity (supplemental Figure 6). In the models used herein, HGAL did not affect MMP activity, which suggests that the decreased DLBCL cell invasion observed in the 3D spheroid cell invasion assay is primarily the result of decreased cellular motility.
Next, we wanted to compare the motility of isogenic HGAL-expressing and HGAL-non-expressing DLBCL cells in vivo. To accomplish this, we used our previously established intravital noninvasive imaging method, which allowed longitudinal imaging with single-cell resolution.27,28 Equal numbers of HGAL-expressing and HGAL-non-expressing cells derived from U2932 or BJAB cell lines were labeled with either orange or green tracker or alternatively with GFP and then injected into the anterior chamber of the eye of NSG mice (Figure 4B; supplemental Figure 7). The cells and their density were tracked using confocal imaging with z-stacks spanning the full height and width of the anterior eye chamber (Figure 4C-D). Although the change in cell density over time varied between the U2932 and BJAB cell lines, in which HGAL is either expressed endogenously (BJAB) or overexpressed (U2932), there was a larger decrease in cell density in cells not expressing HGAL in both cell lines, which reached a statistically significant difference on day 3 (Figure 4C). This was accompanied by decreased egress of HGAL-expressing cells from the anterior chamber of the eye on days 1 and 3 after injection (Figure 4D), thus further indicating decreased in vivo cell motility.
Together, these findings demonstrate that the previously reported association between HGAL expression and longer survival in patients with DLBCL can be reproduced in animal models. Our current in vitro and in vivo findings also show that HGAL inhibition of lymphoma cell dissemination is directly mediated by its effects on cellular motility.
Mechanisms of HGAL-mediated inhibition of lymphoma motility
In our previous studies, we showed that HGAL inhibits the ability of myosin to translocate actin through a direct interaction with both F-actin and myosin II,14,17 which, in turn, could contribute to the inhibition of lymphocyte motility. We also demonstrated that HGAL decreases lymphoma motility by increasing RhoA signaling.15 HGAL also binds to Syk after BCR activation and enhances its kinase activity.12 BCR ligation was shown to reprogram B-cell migration to the T zone and B-cell follicle sequentially,29 whereas Syk was shown to enhance chemotaxis of normal B cells and chronic lymphocytic leukemia cells.30,31 A previous study showed that RhoA is activated downstream of PI3K in response to BCR stimulation and is important for BCR-dependent calcium flux and cell proliferation.32 Whether BCR-activated RhoA contributes to regulation of lymphocyte and lymphoma cell motility was not investigated (Figure 5A).
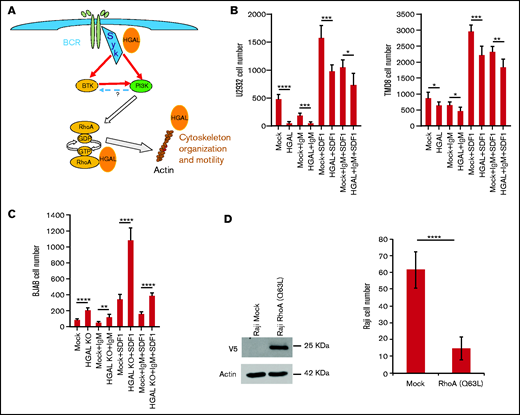
Effects of BCR stimulation on transwell migration in isogenic lymphoma cells expressing or not expressing HGAL. (A) Schematic presentation of BCR downstream cascade regulating cytoskeleton and cell motility. Question mark represents contradictory data in the literature on the potential of PI3K to activate BTK. (B) Effects of BCR activation with and without SDF1 stimulation on transwell migration of isogenic U2932 and TMD8 lymphoma cells expressing or not expressing HGAL. (C) Effects of BCR activation with and without SDF1 stimulations on transwell migration of isogenic wild-type BJAB cells expressing HGAL and HGAL KO cells. (D) Effect of constitutively active RhoA (Q63L) expression on transwell migration of Raji cells. *P < .05; **P < .01; ***P < .001; ****P < .0001.
Effects of BCR stimulation on transwell migration in isogenic lymphoma cells expressing or not expressing HGAL. (A) Schematic presentation of BCR downstream cascade regulating cytoskeleton and cell motility. Question mark represents contradictory data in the literature on the potential of PI3K to activate BTK. (B) Effects of BCR activation with and without SDF1 stimulation on transwell migration of isogenic U2932 and TMD8 lymphoma cells expressing or not expressing HGAL. (C) Effects of BCR activation with and without SDF1 stimulations on transwell migration of isogenic wild-type BJAB cells expressing HGAL and HGAL KO cells. (D) Effect of constitutively active RhoA (Q63L) expression on transwell migration of Raji cells. *P < .05; **P < .01; ***P < .001; ****P < .0001.
We demonstrate that in vitro BCR stimulation increased RhoA activity (supplemental Figure 8A-B) and decreased both spontaneous as well as chemotaxis-induced DLBCL cell motility (Figure 5B-C). Expression of HGAL further increased BCR-induced RhoA activation (supplemental Figure 8B) and decreased DLBCL cell motility upon BCR stimulation (Figure 5B), whereas HGAL knockout ameliorated BCR-induced RhoA activation (supplemental Figure 8A) and BCR-mediated inhibitory effects on DLBCL cell motility (Figure 5C). These HGAL effects on RhoA activation and motility inhibition are in line with our previous report,15 but at first glance, may be counterintuitive because RhoA was commonly implicated in facilitating cell motility.33 However, increased RhoA activity has been previously shown to decrease motility of macrophages and fibroblasts,34 and thus may contribute to the inhibitory effects of BCR stimulation on lymphocyte motility. RhoA activity needs to be tightly balanced to regulate cell motility because both decreased RhoA activity or expression and enhanced RhoA activation were reported to inhibit cell motility and chemotaxis in the same cells.35 Indeed, both expression of constitutively active RhoA (Q63L) protein (Figure 5D) and decreased RhoA activation via knockdown or inhibition of SYK or BTK by indicated inhibitors (Figure 6; supplemental Figure 9A) inhibited lymphoma cell motility. SDF1 stimulation did not activate RhoA in resting, non-stimulated DLBCL cell lines growing in low-serum media but decreased BCR- and fibronectin-induced RhoA activation (data not shown; supplemental Figure 9B). Thus, our observations suggest that BCR stimulation in aggressive lymphoma cell lines inhibits cell motility by activating RhoA. HGAL enhances this inhibition by augmenting RhoA activation and possibly by additional mechanisms (Figures 4 and 5; supplemental Figure 9).
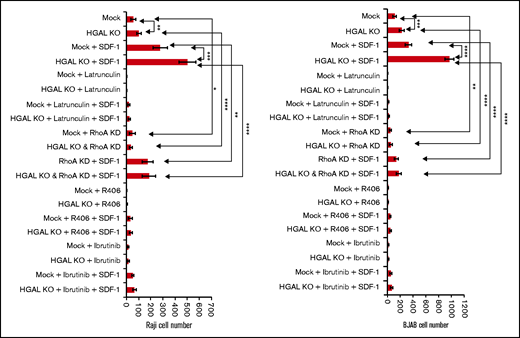
Effects of RhoA knockdown, inhibition of Syk, BTK, and G-actin polymerization on transwell migration in isogenic lymphoma cells expressing or not expressing HGAL. Means and standard deviations of 6 independent experiments are shown. *P < .05; **P < .01; ***P <.001; ****P < .0001. KD, knockdown.
Effects of RhoA knockdown, inhibition of Syk, BTK, and G-actin polymerization on transwell migration in isogenic lymphoma cells expressing or not expressing HGAL. Means and standard deviations of 6 independent experiments are shown. *P < .05; **P < .01; ***P <.001; ****P < .0001. KD, knockdown.
To elucidate HGAL epistatic downstream effectors that regulate lymphocyte motility, we examined the effects of RhoA knockdown, inhibition of Syk and its downstream effector BTK, and G-actin polymerization in isogenic HGAL-expressing and HGAL-non-expressing Raji and BJAB lymphoma cell lines (Figure 6A). Inhibition of G-actin polymerization by latrunculin almost completely inhibited motility of unstimulated cells and significantly decreased SDF1-stimulated cell motility on fibronectin-covered surfaces. And latrunculin abolished the effect of HGAL on lymphoma motility. Similar results but at different magnitudes were observed upon knockdown of RhoA (supplemental Figure 8C-D), Syk inhibition by R406, and BTK inhibition by ibrutinib (Figure 6A). Findings that inhibition of each of these proteins abolished HGAL effects on motility suggest that HGAL is acting upstream of each of these proteins. These findings together with the observations that HGAL independently interacts with and affects activity and function of Syk, RhoA and actin support a model in which multiple players and mechanisms control the lymphocyte motility downstream of HGAL and may be context specific (ie, based on stimulus). Concordantly, we previously demonstrated that deletion of the HGAL PDZ domain binding motif, implicated in the interaction with RhoA GEFs, was sufficient to ameliorate but not eliminate HGAL effects on cell motility.15
As with most adaptor proteins, HGAL likely interacts with many other proteins that are currently unknown but may contribute to the regulation of cell motility. Elucidating HGAL interactions with other proteins is necessary to fully elucidate HGAL functions and to understand the complex biological processes it is involved in, like cellular motility. Therefore, a comprehensive global cellular HGAL interactome is required to fully understand its cellular functions in general and, specifically, in the context of its effects on the cell motility and cytoskeleton.
Affinity purification coupled to mass spectroscopy (AP-MS) is well suited for interactome studies of cytosolic proteins, and we previously used it to identify HGAL interactions with myosin II and actin.17 However, the success of AP-MS depends on the solubility and availability of the protein complex of interest, and thus may be problematic when studying membrane associated proteins like HGAL. To circumvent this obstacle and to complement AP-MS, we established the recently published BioID method that relies on proximity-dependent protein biotinylation.23,36 In this method, an E.coli biotin protein ligase harboring an R118G mutation (referred to BirA*) is fused in frame to the HGAL protein. The fused BirA* mutant catalyzes the formation of activated biotin (biotinoyl-5'-adenosine monophosphate), which can covalently react with the epsilon amine of lysine residues in directly interacting and neighboring proteins and permanently tag them without the need to maintain protein complexes throughout the purification scheme. These tagged proteins are then enriched by performing a purification with streptavidin coupled to mass spectrometric analysis. We generated 3 stable Raji cell lines, expressing BirA* (control), GFP-BirA* (control), and HGAL-BirA* proteins and used them for purification with streptavidin coupled to mass spectrometric analysis. Proteins interacting with HGAL-BirA* only and not with controls were considered to be potential interaction partners. A total of 96 proteins were identified as potentially interacting with HGAL (supplemental Table 1). These included 30 unique proteins (besides HGAL itself) that were considered part of the cytoskeleton, to be interacting with the cytoskeleton, or to be regulating cellular motility (supplemental Table 2). Of note, actin was among these proteins, consistent with our previous observations, which demonstrated that HGAL may affect cell motility via effects on actin.14 Gene set enrichment analysis revealed a statistically significant enrichment for proteins belonging to the cytoskeleton, cell junction, cell projection, tumor invasiveness, and microtubule cytoskeleton signatures (Table 1). The identification of multiple cytoskeletal proteins as potential HGAL interacting partners and enrichment for cytoskeleton signatures indicates that HGAL interacts with multiple components of the cytoskeleton and thus affects cellular motility through multiple complementary mechanisms.
Gene set enrichment analysis of HGAL interacting proteins
| Gene set | No. of genes in set | Overlap with HGAL interactome | –Log10 (FDR) |
|---|---|---|---|
| GO_CYTOSKELETON | 1967 | 30 | 14.91 |
| GO_CELL_JUNCTION | 1151 | 22 | 12.19 |
| GO_CELL_LEADING_EDGE | 350 | 14 | 11.19 |
| WANG_TUMOR_INVASIVENESS_UP | 374 | 14 | 10.86 |
| GO_CYTOSKELETAL_PART | 1436 | 21 | 9.64 |
| GO_CELL_PROJECTION | 1786 | 22 | 8.85 |
| GO_IMMUNE_SYSTEM_PROCESS | 1984 | 22 | 8.10 |
| GO_CYTOSKELETAL_PROTEIN_BINDING | 819 | 15 | 7.79 |
| GO_ACTIN_CYTOSKELETON | 444 | 12 | 7.76 |
| GO_ACTIN_BINDING | 393 | 11 | 7.15 |
| GO_CYTOSKELETON_ORGANIZATION | 838 | 14 | 6.72 |
| GO_LAMELLIPODIUM | 172 | 8 | 6.52 |
| GO_MICROTUBULE_CYTOSKELETON | 1068 | 15 | 6.37 |
FDR, false discovery rate; GO, Gene Ontology.
HGAL interacts with tubulin and this interaction may contribute to HGAL effects on cell motility
Some of these interactions may represent direct interacting proteins whereas others denote proteins found in the vicinity of HGAL. Therefore, confirmation of direct interaction requires additional methods. Our attention was drawn to the enrichment of α- and β-tubulins because this establishes a potential link between HGAL and the microtubule network, that like actin, act as downstream effectors controlling cell motility. This was supported by the reciprocal co-immunoprecipitation of HGAL and α-tubulin (Figure 7A) and β-tubulin (supplemental Figure 10A). Confocal microscopy images further demonstrated co-localization of HGAL and β-tubulin in HeLa cells expressing exogenous HGAL (supplemental Figure 10B). In endogenous HGAL-expressing Raji cells cultured in suspension and stimulated with anti-immunoglobulin M (anti-IgM) F(ab′)2, HGAL and β-tubulin co-localized in the microtubule organizing center (MTOC) (supplemental Figure 10C). In HGAL-expressing BJAB cells cultured on the anti-IgM F(ab′)2 functionalized planar membrane (Figure 7B), tyrosinated α-tubulin co-localized with HGAL at the external edge of the central supramolecular activation clusters (cSMACs). To investigate the nature of binding between HGAL and tubulin, we performed a microtubule binding protein spin-down assay using isolated microtubules and recombinant HGAL protein that confirmed direct binding (Figure 7C). We next examined the potential role of HGAL in tubulin polymerization, and we demonstrated that HGAL did not affect tubulin polymerization (supplemental Figure 11). HGAL also did not affect α-tubulin phosphorylation (data not shown). Then we examined whether HGAL affects cellular distribution of tubulin. To this end, α-tubulin was fluorescently labeled, and fluorescence intensity was measured using confocal microscopy at indicated distances from the cell surface in cell lines expressing and not expressing HGAL. α-Tubulin redistributed toward cell membrane only in the U2932 cells expressing HGAL (P < .001), but HGAL expression did not affect α-tubulin distribution in other analyzed cell lines, suggesting a cell line–specific and not uniform effect (supplemental Figure 12).

HGAL interacts with tubulin. (A) HGAL reciprocally co-immunoprecipitated (IP) with α-tubulin in Raji cells. (B) BJAB cells were seeded on planar lipid bilayer membranes coated with anti-human IgM antibody (surrogate antigen) for 30 minutes to induce B-cell synapse formation and then were analyzed. Shown are confocal microscopy images of HGAL and tyrosinated α-tubulin co-localization at 0.5 μm from the cell surface. BCR, purple; HGAL, green; tyrosinated α-tubulin, orange. (C) Co-sedimentation of recombinant HGAL tagged with thioredoxin (TRX) with isolated microtubules. (D) HGAL-mediated inhibition of lymphoma motility is dependent on tubulin. Shown are number of cells migrating in transwell experiments in the presence of the indicated stimulants and colchicine (20 nM). Means and standard deviations of 6 independent experiments are shown. **P < .01; ****P < .0001.
HGAL interacts with tubulin. (A) HGAL reciprocally co-immunoprecipitated (IP) with α-tubulin in Raji cells. (B) BJAB cells were seeded on planar lipid bilayer membranes coated with anti-human IgM antibody (surrogate antigen) for 30 minutes to induce B-cell synapse formation and then were analyzed. Shown are confocal microscopy images of HGAL and tyrosinated α-tubulin co-localization at 0.5 μm from the cell surface. BCR, purple; HGAL, green; tyrosinated α-tubulin, orange. (C) Co-sedimentation of recombinant HGAL tagged with thioredoxin (TRX) with isolated microtubules. (D) HGAL-mediated inhibition of lymphoma motility is dependent on tubulin. Shown are number of cells migrating in transwell experiments in the presence of the indicated stimulants and colchicine (20 nM). Means and standard deviations of 6 independent experiments are shown. **P < .01; ****P < .0001.
Microtubules are cytoskeletal filaments that play pivotal roles in diverse cellular functions, including control of cell shape, intracellular trafficking, and cellular motility. To assess the role of HGAL and tubulin interaction on lymphoma cell motility, we used colchicine, a microtubule inhibitor.37 It was previously demonstrated that lower concentrations of colchicine inhibit cell motility via induction of tubulin dynamic instability, whereas higher doses of colchicine induce formation of microtubule fragments and inhibit cell proliferation.38,39 Colchicine, at concentrations of 5 and 10 nM did not affect cell proliferation (supplemental Figure 13) but also did not affect cell motility of lymphoma cells (data not shown). At 20 nM concentration, colchicine slightly inhibited cell proliferation; however, it did not induce cell apoptosis or death after 5 hours of exposure (supplemental Figure 14). When wild-type Raji and BJAB cells plated on fibronectin-covered surfaces were exposed to 20 nM colchicine for 5 hours, we observed inhibition of chemokinesis and SDF1-induced chemotaxis. There was no difference in chemokinesis and SDF1-induced chemotaxis between wild-type and HGAL knocked-out Raji and BJAB cells upon colchicine treatment, indicating that tubulin inhibition by colchicine abolished the increase in cellular motility upon HGAL knock out (Figure 7D). Similar observations were observed with tubulin inhibitor vinblastine at a 2 nM concentration, which did not affect cell proliferation (supplemental Figure 15), but it did abolish the increase in cellular motility upon HGAL knock out (supplemental Figure 16).
Discussion
The spread of malignant lymphocytes to secondary lymphatic organs and extranodal sites is the primary cause of lymphoma-associated mortality. The cytoskeleton, as a dynamic regulator of lymphocyte cell shape and plasma membrane organization, plays a key role in driving the cellular motility of normal and malignant B cells. The cytoskeleton may also control BCR signaling, further contributing to lymphoma pathogenesis. Aberrations in BCR signaling6,40 (eg, CD79, CARD11, MYD88) and proteins associated with cellular motility6-9 (eg, GNA13, S1PR2, RhoA, and actin) have been implicated in lymphoma pathogenesis. However, only a few studies have specifically looked for intracellular proteins that modulate BCR signaling, lymphocyte motility, and lymphoma dissemination.25,41 By regulating these processes, such proteins may contribute to lymphomagenesis through simultaneous enhancement of BCR signaling and targeting of cells to microenvironments that prevent cellular differentiation and promote malignant transformation.7,8 By controlling lymphoma dissemination, they may also determine lymphoma aggressiveness, higher disease burden, and clinical prognosis.
We have previously shown that HGAL regulates BCR signaling and the motility of lymphoma cells in vitro. We have also shown that conditional expression of HGAL in mice leads to development of DLBCL, potentially by concomitant regulation of BCR signaling and cellular motility.13 Herein we extend our previous findings by demonstrating that HGAL directly regulates DLBCL dissemination in vivo and this may be mediated by interacting with multiple cytoskeletal proteins (eg, actin and RhoA-specific GEFs PDZ-RhoGEF and LARG).14,15,17 These findings mirror our previous observation in humans showing that HGAL-expressing DLBCL tumors typically present at earlier lymphoma stages with better prognosis for survival.19,42
Here, we demonstrated that HGAL may potentiate BCR effects on lymphoma cell motility. Although BCR signaling can modulate cellular motility and the cytoskeletal network,1-4 very little is known about the BCR role in regulating lymphoma cell motility, and its effects may vary in normal compared with malignant lymphocytes. For example, in chronic lymphocytic leukemia, BCR stimulation increases leukemia cell migration.31 Here, we demonstrated that BCR stimulation in DLBCL decreased the motility of the cells and chemotaxis, and this effect was potentiated by HGAL. We demonstrate that BCR stimulation leads to RhoA activation that is enhanced by HGAL and may contribute to decreased cell motility. Concordantly, we show that expression of constitutively active RhoA (Q63L) protein also inhibited lymphoma cell motility. Therefore, the concomitant regulation of lymphocyte motility and BCR signaling by HGAL may represent a unique venue for controlling functions of normal and malignant lymphocytes and coordination between antigen stimulation and lymphocyte motility. It may also underlie the discrepancy originating from the observation that the same protein may function as an oncogene leading to lymphoma with less aggressive behavior. In normal B cells, HGAL restricts cells to the GC environment by inhibiting cell motility and exit from the GC. Persistent and uncontrolled HGAL expression predisposes to prolonged stay of cells in the GC and enhanced BCR signaling and exposes them to GC-associated high proliferation rate and somatic mutations that may lead to lymphoma. However, lymphoma cells expressing HGAL, by virtue of its inhibitory effects on cell motility and migration, exhibit decreased dissemination in contrast to HGAL-negative cells.
In our previous studies we identified several HGAL downstream effectors controlling lymphocyte motility.12,15,17 Here, by using a nontargeted proteomic approach and by inhibiting several individual downstream effectors of HGAL, we confirmed that HGAL decreases the motility of lymphocytes via multiple interactions and pathways. We also show that HGAL directly interacts with tubulin, and this interaction may contribute to the effects of HGAL on lymphocyte motility.
It is possible that interaction of HGAL with tubulin also pays important roles in additional biological processes. We have previously shown that HGAL regulates immunologic synapse formation by enhancing the rate of cSMAC formation and increases BCR accumulation in it.16 cSMAC formation is dependent on Syk, myosin II, and actin, all of which are regulated by HGAL.1,2,4,43 Microtubule networks that HGAL interacts with also play an important role in organizing the BCR microcluster movement during antigen gathering and localization of BCR in the cSMAC.2 Inhibition of microtubule function was reported to decrease BCR accumulation in the cSMAC,2 mirroring effects of HGAL knockout. We also observed co-localization of HGAL with tubulin in MTOC and at the external edge of the cSMAC upon BCR signaling (Figure 7B). Upon BCR stimulation, tubulins are often polarized toward the antigen-coated surface secondary to repositioning of MTOC, and they display dynamic instability at the BCR synapse. These observations suggest that HGAL together with microtubules may be involved in antigen gathering upon BCR stimulation. This hypothesis needs to be examined in future studies.
In summary, using novel lymphoma dissemination in vivo models, we demonstrated that HGAL decreases lymphoma dissemination and prolongs animal survival via diverse mechanisms. These findings recapitulate previous observations in humans, establish the role of HGAL in dissemination of DLBCL in vivo, and provide an explanation for the improved survival and prognosis of patients with HGAL-expressing lymphomas. We also identified the HGAL interactome by using an untargeted proteomic approach, and this revealed multiple novel proteins that are interacting partners with HGAL. These discoveries will help to identify novel functions of the HGAL adaptor protein in future studies.
Acknowledgments
This work was supported in part by grants from the National Cancer Institute (P30CA240139) (to Sylvester Comprehensive Cancer Center) and the National Institute of Allergies and Infectious Diseases (R56AI130330) (M.H.A.), National Institutes of Health.
X.J. is supported by a Stanley J. Glaser Foundation Research Award (UM SJG 2017-8), American Cancer Society Institutional Research Grant (#98-277-13), and University of Miami Sylvester Comprehensive Cancer Center. I.S.L. is supported by a grant from the National Cancer Institute (1R01CA233945), the Intramural Funding Program from the University of Miami Sylvester Comprehensive Cancer Center, by the Dwoskin and Anthony Rizzo Families Foundations, and by the Jaime Erin Follicular Lymphoma Research Consortium.
The content is solely the responsibility of the authors and does not necessarily represent the official views of the research funders.
Authorship
Contribution: X.J. designed and performed experiments, analyzed the data, and wrote the manuscript; M.H.A. designed and performed experiments, analyzed data, and edited the manuscript; Y.Z. performed experiments; A.J.G. and J.S. analyzed the data; X.Q.L., D.Z., S.A.W., Y.N., and V.T.M. performed experiments and analyzed the data; I.M.R. performed statistical analyses; B.R. provided reagents and analyzed data; I.S.L. conceptualized the idea of the study, designed and supervised the experiments, analyzed the data, and wrote the manuscript; and all authors reviewed and approved the final version of the manuscript.
Conflict-of-interest disclosure: I.S.L. served on advisory boards for Seattle Genetics, Janssen Scientific, and Verastem Oncology. The remaining authors declare no competing financial interests.
The current affiliation for J.S. is Lombardi Comprehensive Cancer Center, Department of Oncology, Georgetown University, Washington DC. The current affiliation of B.R. is Fuse Biotherapeutics Inc., Los Angeles, CA.
Correspondence: Izidore S. Lossos, Department of Medicine, Division of Hematology and Oncology, University of Miami and Sylvester Comprehensive Cancer Center, 1475 NW 12th Ave (D8-4), Miami, FL 33136; e-mail: ilossos@med.miami.edu; and Xiaoyu Jiang, Department of Medicine, University of Miami Miller School of Medicine, 1580 NW 10th Ave, Miami, FL 33136; e-mail: xjiang@med.miami.edu.

