

Key Points
The first enhancer mapping of pediatric AML reveals that the most common SE-associated signature is one driven by RARA.
A RARA SE is common in pediatric AML and correlates to sensitivity to the retinoid tamibarotene both in vitro and in vivo.

Abstract
Somatic mutations are rare in pediatric acute myeloid leukemia (pAML), indicating that alternate strategies are needed to identify targetable dependencies. We performed the first enhancer mapping of pAML in 22 patient samples. Generally, pAML samples were distinct from adult AML samples, and MLL (KMT2A)–rearranged samples were also distinct from non–KMT2A-rearranged samples. Focusing specifically on superenhancers (SEs), we identified SEs associated with many known leukemia regulators. The retinoic acid receptor alpha (RARA) gene was differentially regulated in our cohort, and a RARA-associated SE was detected in 64% of the study cohort across all cytogenetic and molecular subtypes tested. RARA SE+ pAML cell lines and samples exhibited high RARA messenger RNA levels. These samples were specifically sensitive to the synthetic RARA agonist tamibarotene in vitro, with slowed proliferation, apoptosis induction, differentiation, and upregulated retinoid target gene expression, compared with RARA SE− samples. Tamibarotene prolonged survival and suppressed the leukemia burden of an RARA SE+ pAML patient-derived xenograft mouse model compared with a RARA SE− patient-derived xenograft. Our work shows that examining chromatin regulation can identify new, druggable dependencies in pAML and provides a rationale for a pediatric tamibarotene trial in children with RARA-high AML.
Introduction
Children with acute myeloid leukemia (AML) achieve ∼65% overall survival,1 which is completely dependent on extremely toxic chemotherapy and stem cell transplantation, both of which cause significant short- and long-term toxicities, including potentially heart failure, secondary malignancies, and graft-versus-host disease. Of the successes in specifically drugging genomically altered drivers in adults with AML, thus far only FLT3 inhibitors seem to have any relevance for ∼10% of children,2 whereas differences in underlying biology preclude the usefulness of other targeted agents (eg, rare isocitrate dehydrogenase (IDH1)/2 mutations). One well-known exception is targeting the chimeric oncoprotein promyelocytic leukemia/retinoic acid receptor alpha (PML-RARA), which is encoded by a t(15;17) translocation that defines >95% of the acute promyelocytic (APL) subtype of AML in both children and adults. RARA is a member of the retinoic acid receptor (RAR) family of nuclear hormone receptors. In the absence of retinoid agonists, RARA heterodimerizes with RXR family members to suppress transcription of its target genes. Agonist binding induces a conformation change allowing RARA to dissociate from its corepressors and instead recruit transcriptional coactivators, allowing for transcription of differentiation genes. In APL, the PML-RARA fusion protein can homodimerize and is insensitive to endogenous retinoid agonists, enforcing the persistent differentiation block. However, administration of retinoids such as all-trans retinoic acid (ATRA) overcomes the differentiation blockade and contributes to the >90% overall survival rates of children and adults with this AML subtype. ATRA does not have convincing clinical benefit in either children or adults with non-APL, however.3-6 This reinforces the need to find and more deeply understand the lynchpin drivers in pediatric AML (pAML) to determine if specific subtypes might benefit from drugging these drivers.
Genome sequencing studies show that pAML contains fewer mutations than adult AML.7-9 However, structural alterations are more common: up to 40% of patients have KMT2A and/or core-binding factor (CBF) fusions, with lower rates of other rearrangements (eg, GLIS2, NUP, or ETS family members).7 These fusions often form chimeric transcription factors, which drive a pro-oncogenic transcriptional program. Although there are efforts to delineate these fusion-controlled pathways to drug both downstream targets and upstream regulators, a corroborative understanding of pAML transcriptional control may synergistically integrate with these efforts to spotlight the indispensable dependencies driving pAML subgroups.
Our goal was to define the transcriptional control of human diseases through identifying and validating superenhancers (SEs), a subset of enhancers that are highly and disproportionately bound by much of the cell’s transcriptional machinery. This results in marked overexpression of SE-regulated genes, which enforce cell identity and drive oncogene expression in a growing number of cancers, including adult AML.10-14 Recent enhancer profiling of 66 adult AML patient samples identified new, prognostically relevant, SE-defined subgroups.10 Of the SE-driven, mutual information networks of these six subgroups, RARA was present in only one. The RARA SE was identified in 59% of the samples, which were selectively sensitive to the synthetic retinoid tamibarotene/SY-1425 over the RARA SE− samples. Hence, in the setting of an SE driving RARA expression, we hypothesized that an imbalance between endogenous retinoids and high RARA levels exists, resulting in repressed gene expression and a differentiation blockade. Exogenous retinoid agonists such as tamibarotene restore the balance of ligand:RARA to allow re-expression of RARA target genes, reestablishing myeloid differentiation of AML cells. These data prompted a phase 2 US clinical trial of tamibarotene in adults with RARA-high, relapsed/refractory AML or myelodysplastic syndrome, which is projected to be completed later this year (#NCT02807558).
The current study analyzed the enhancer landscape of pAML to find potential druggable dependencies. We discovered the importance of retinoid signaling in pAML and found a high frequency of the RARA SE, which conferred sensitivity to tamibarotene both in vitro and in vivo. These data confirm our approach to find and drug other AML-specific, SE-regulated transcriptional controllers to help children with AML.
Methods
Patient sample collection and processing
Samples from children with AML were obtained with informed consent, according to protocols approved by the Institutional Review Board of Baylor College of Medicine. Patients’ cytogenetic and molecular characteristics were collated from chart records. Samples were mostly from leukapheresis products, but some bone marrow aspirate samples with >85% blasts were also selected from Texas Children’s Hospital banked bone marrow samples. Mononuclear cells were enriched by density centrifugation and frozen in dimethyl sulfoxide–containing fetal bovine serum in liquid nitrogen. All experiments were conducted on freshly thawed samples, maintained in conditioned media, as previously published.15
In vivo studies
All animal experiments were performed with approval of the Baylor College of Medicine Institutional Animal Care and Use Committee. Briefly, 6- to 7-week-old female NSG-SGM3 (NSGS) mice were purchased from The Jackson Laboratory and injected by tail vein with 2 × 10⁵ primary pAML patient samples (p401, p198). Engraftment was monitored by peripheral blood with human CD45-PE (560178; BD Biosciences) and CD33-PerCP-Cy7 (561160; BD Biosciences) every 7 to 14 days. Once engraftment was confirmed (defined as >1% hCD45+/hCD33+ cells in the periphery), mice were randomized to be given either vehicle or tamibarotene treatment (n = 5 to 6 per arm). Tamibarotene was prepared as a 100× stock solution in dimethyl sulfoxide and stored at −20°C. Mice were treated with 6 mg/kg tamibarotene daily by oral gavage until moribund, at which point the mice were euthanized. Peripheral blood, liver, spleen, bilateral femurs, tibias, and fibulas were collected. Bone marrow cells were analyzed flow cytometrically by using CD45-APC-H7 (560178; BD Biosciences), CD33-PE (12-0331-82; Thermo Fisher Scientific), and CD38-FITC (555459; BD Bioscience). Tamibarotene-treated MV4;11 cells were used as positive controls for the flow experiments. Survival was plotted in GraphPad Prism by using a Kaplan-Meier analysis.
Genomic coordinates and gene annotation
All coordinates and gene annotations in this study were based on human reference genome assembly hg19, GRCh37 (ncbi.nlm.nih.gov/assembly/2758/) and RefSeq genes.
RNA-sequencing data processing
Sequenced reads of RNA-sequencing (RNA-seq) experiments were preprocessed with BBDuk and aligned to hg19/GRCh37 using STAR aligner.16 Gene expression values were quantified by using Cufflinks and Cuffnorm, with expression defined as fragments per kilobase million (FPKM) as determined by counting the number of uniquely mapping fragments and normalizing it by the length coding sequence and the library size. Genes with >10 FPKM in at least 1 sample were considered to be expressed genes. Significance was determined by a Log2FC cutoff of 1 or −1 and a P value cutoff of 0.05. Heatmaps were generated in R by using the “ggplot2” package. Row-normalized expression values range from 0 to 1. Genes were ranked by Log2FC. Gene set enrichment analysis (GSEA) was performed on active genes with the C2 curated gene sets, and the significance of these signatures was compared by false discovery rate vs normalized enrichment score.
Expression vs enhancer signal correlation
FPKM expression data and H3K27ac enhancer signal data were correlated across 19 primary samples for various key pAML genes. Scatter plots comparing baseline expression and percentile rank by signal of each gene’s corresponding enhancer region were generated by using the “ggplot2” package on R.
ChIPmentation
ChIPmentation was performed as described previously.17 Additional details are provided in the supplemental Methods.
H3K27ac chromatin immunoprecipitation–sequencing processing
The H3K27ac chromatin immunoprecipitation–sequencing (ChIP-seq) data are provided in supplemental Table 1. All files were processed following the guidelines of ENCODE (phase-3) using the AQUAS pipeline (https://github.com/kundajelab/chipseq_pipeline). All samples were aligned with BWA18 to genome build v.NCBI37/HG19. Low-quality, duplicate, multimapping, unmapped reads, and reads mapping to the mitochondrial genome were filtered. Peak finding was performed by the AQUAS pipeline using MACS2 with a P value threshold of 1 × 10⁻⁵. The AQUAS pipeline also determined quality control measures such as mapping statistics, enrichment, library complexity (PCR bottlenecking coefficients PBC1 and PBC2), cross-correlation scores, and fraction of reads in the peaks as defined by ENCODE data standards (https://www.encodeproject.org/chip-seq/histone/). Also, we determined the fraction of reads mapping within 2 kb of an annotated promoter as a quality control measure. Primary H3K27ac ChIP-seq samples with PBC1 ≥0.5, total mapped reads ≥5 million, and MACS2 peaks ≥5000 were included in the analysis. H3K27ac ChIP-seq cell line samples with PBC1 ≥0.5, alignment rate ≥70%, and MACS2 peaks ≥10 000 were included in the analysis.
Mapping enhancers using H3K27ac definitions
H3K27ac SEs and typical enhancers in individual samples were mapped by using the ROSE2 software package (https://github.com/BradnerLab/pipeline).19,20 Peaks within ±2.5 kb of a transcription start site and peaks found in the ENCODE21 blacklist (https://sites.google.com/site/anshulkundaje/projects/blacklists) were excluded. The default was used for all other parameters. Genes were assigned to SEs by proximity.
Clustering samples by SE patterns
Sample clustering was performed as in Chapuy et al.22 To map a consensus SE landscape of AML, we first mapped the enhancer regions in each individual sample. We used the union of all regions considered to be an SE in any individual sample as our consensus SE landscape. The background-subtracted H3K27ac signal was calculated at each region and median normalized for each sample. Supplemental Table 2 contains the resulting median normalized H3K27ac signal in the consensus SE landscape and all associated genes. Samples were hierarchically clustered based on similarity of patterns of median normalized H3K27ac enhancer signal as determined by using pairwise Pearson correlations (Figure 1B; supplemental Figure 2C).
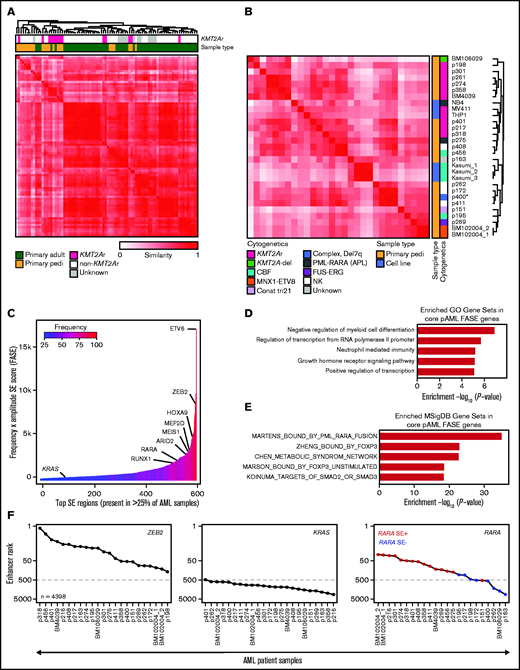
The SE landscape of pAML. (A) Similarity of primary pAML and adult AML patient samples by unsupervised hierarchical clustering of H3K27ac signal at consensus SE regions. (B) Similarity of pAML cell lines and samples by unsupervised hierarchical clustering of H3K27ac signal at consensus SE regions. Cytogenetic and molecular features depicted for each cell line and sample. Notes: replicates of the cell line Kasumi1 and the sample BM102004 were included (denoted “_1,” “_2,” and “_3”). “CBF” = core-binding factor, “Const tri 21” = a patient with trisomy 21 presenting with transient myeloproliferative disorder, and “NK” = normal karyotype. (C) Core consensus SE regions ranked according to the product of frequency and amplitude of H3K27ac signal (FASE). Consensus SE regions were defined as SE regions present in >25% of samples. (D-E) Core pAML SE-associated genes compared with known Gene Ontology (GO) signatures (D) and MSigDB C2 curated gene sets (E). Gene sets are represented by strength of significance as depicted by –Log10(P-value). (F) Enhancer ranking of three core SE-associated genes across all pAML samples. RARA SE status defined by red (present) or blue (absent) in the right panel.
The SE landscape of pAML. (A) Similarity of primary pAML and adult AML patient samples by unsupervised hierarchical clustering of H3K27ac signal at consensus SE regions. (B) Similarity of pAML cell lines and samples by unsupervised hierarchical clustering of H3K27ac signal at consensus SE regions. Cytogenetic and molecular features depicted for each cell line and sample. Notes: replicates of the cell line Kasumi1 and the sample BM102004 were included (denoted “_1,” “_2,” and “_3”). “CBF” = core-binding factor, “Const tri 21” = a patient with trisomy 21 presenting with transient myeloproliferative disorder, and “NK” = normal karyotype. (C) Core consensus SE regions ranked according to the product of frequency and amplitude of H3K27ac signal (FASE). Consensus SE regions were defined as SE regions present in >25% of samples. (D-E) Core pAML SE-associated genes compared with known Gene Ontology (GO) signatures (D) and MSigDB C2 curated gene sets (E). Gene sets are represented by strength of significance as depicted by –Log10(P-value). (F) Enhancer ranking of three core SE-associated genes across all pAML samples. RARA SE status defined by red (present) or blue (absent) in the right panel.
Comparison of pAML with published adult AML SE landscapes
Adult AML H3K27ac ChIP-seq data from McKeown et al10 were sourced from the Sequence Read Archive (accession number SRP103200). All files were processed as described earlier. To compare primary pAML samples vs primary adult AML samples, we performed clustering of the samples according to SE patterns. A consensus SE landscape was determined as the union of all SE regions present in any individual sample. The H3K27ac signal was calculated at each region and median normalized per sample. Samples were clustered based on similarity of patterns in the consensus SE landscape as determined by using pairwise Pearson correlations (Figure 1A).
Identifying core SEs
To identify SEs common across all pAML samples, the union of SE regions identified in at least one sample were merged and considered the consensus SE loci. The number of individual samples with a SE region overlapping a consensus SE locus was taken as the frequency of the merged SE region in the cohort. The H3K27ac levels for each consensus SE region was considered as the average of all samples. The consensus SE loci were ordered by the product of SE frequency and H3K27ac levels, called the FASE score, as previously described.23 Core SE loci were defined as those H3K27ac regions shared by >25% of samples (Figure 1C). Genes that were associated with multiple SE regions were assigned to the SE region with the highest FASE score in Figure 1C.
Gene set analysis
Gene sets from the curated gene sets (MSigDB C2) that are enriched by GSEA were compared with input gene lists. Similarly, input core FASE genes were compared with the Gene Ontology Biological Processes 2018 database by using Enrichr.24
SE ranking across pAML samples
Enhancer rank was determined from the median normalized H3K27ac signal of each sample across the consensus SE loci. The rank of a SE locus associated with a gene of interest was determined by the rank of the SE locus by signal within each sample.
Data availability
For samples with consent to share data, all genomic data are uploaded to the National Center for Biotechnology Information Gene Expression Omnibus database under accession number GSE155592 with chromatin profiling data (pertaining to Figures 1 and 2) available under accession number GSE155558 and RNA-seq data (pertaining to supplemental Figure 1E and Figure 4) available under accession number GSE155559. For samples not consented to be shared, the patient data are being managed by Terzah Horton of Texas Children’s Hospital; Joanna Yi may be contacted for further information (e-mail: jsyi@txch.org). All computational code can be found at the following link: https://github.com/linlabcode/pedi_AML_RARA_code.
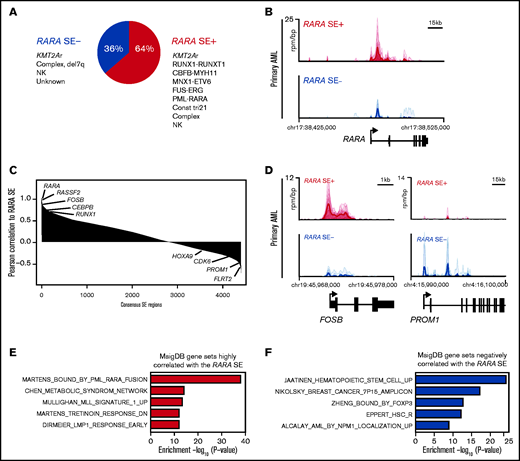
The majority of pAMLs contain a RARA SE, which is correlated to unique SE-associated genes. (A) Fraction of pAML samples with or without the RARA SE within cytogenetic and molecular subgroups. (B) Meta tracks of H3K27ac ChIP-seq signal (rpm/bp) at the RARA SE locus of RARA SE+ and SE− samples. (C) Rank ordering of SEs by Pearson correlation (p-corr) to the RARA SE. Select genes associated with SEs with high and low p-corr are highlighted. (D) H3K27ac ChIP-seq meta tracks at loci of SEs with high and low correlation to the RARA SE as seen in panel C. (E-F) Perturbation gene sets (MSigDB C2) enriched by gene set overlap in the SE genes strongly correlated (E, n = 693 genes, 220 SEs; cutoff, top 5% of SEs by RARA p-corr) and poorly correlated (F, n = 264 genes, 220 SEs; cutoff, bottom 5% of SEs by RARA p-corr) to the RARA SE.
The majority of pAMLs contain a RARA SE, which is correlated to unique SE-associated genes. (A) Fraction of pAML samples with or without the RARA SE within cytogenetic and molecular subgroups. (B) Meta tracks of H3K27ac ChIP-seq signal (rpm/bp) at the RARA SE locus of RARA SE+ and SE− samples. (C) Rank ordering of SEs by Pearson correlation (p-corr) to the RARA SE. Select genes associated with SEs with high and low p-corr are highlighted. (D) H3K27ac ChIP-seq meta tracks at loci of SEs with high and low correlation to the RARA SE as seen in panel C. (E-F) Perturbation gene sets (MSigDB C2) enriched by gene set overlap in the SE genes strongly correlated (E, n = 693 genes, 220 SEs; cutoff, top 5% of SEs by RARA p-corr) and poorly correlated (F, n = 264 genes, 220 SEs; cutoff, bottom 5% of SEs by RARA p-corr) to the RARA SE.
Extended methods are available in the supplemental Methods.
Results
The SE landscape of pAML is generally distinct from adult AML and contains many SE-driven leukemia regulators
The 22 pAML patient samples studied had an overrepresentation of KMT2A (MLL) rearrangements (n = 9) (supplemental Figure 1A); however, other common pediatric cytogenetic and molecular subtypes were also profiled (supplemental Table 1). We observed a total of 118 281 unique enhancers in the 22 samples. An analysis of de novo enhancers gained by each incremental sample suggests that our study is approaching saturation (supplemental Figure 1B), indicating that our cohort should represent a significant breadth and depth of the pAML enhancer landscape. As expected, SEs were rarer than typical enhancers (average n = 490 vs 9088), were much larger in size (4169 bp vs 481 bp), and had on average >10-fold higher H3K27ac signal than did typical enhancers (SE_signal_ave vs TE_signal_ave) (supplemental Figure 1C; supplemental Table 1).
Focusing specifically on SEs, we aimed to investigate how the SE profiles of our samples compared with those of adult AML samples. We performed unsupervised hierarchical clustering of our primary pediatric samples to the primary adult AML samples of McKeown et al10 by using similarity of patterns of signal in a consensus SE landscape. It was observed that, in general, pAML samples had distinct SE profiles compared with those derived from adults with AML (Figure 1A), largely driven by a distinct cluster of pediatric KMT2A rearranged samples. Given the separation of pediatric and adult samples by SE profiling, we performed further clustering of pAML cell lines and primary samples by any region identified as an SE in any sample to determine if the SE landscape could characterize samples according to cytogenetic or molecular subtype (including, specifically, KMT2A rearrangement status) (Figure 1B; supplemental Table 2). Although we and others have shown in other cancer types that immortalized cell lines have substantial SE differences from their corresponding primary tumors,11,25 we observed in pAML that the cell lines clustered closely among the patient samples. This finding suggests that the chromatin landscapes of these cell lines are representative of our patient data. KMT2A-rearranged samples largely clustered together, with the majority of non-KMT2A samples clustering separately. However, clustering of the KMT2A rearranged samples by similarity was not exclusive, as non–KMT2A-rearranged samples were also identified as having similar SE profiles. Beyond KMT2A-rearranged samples, clustering of other cytogenetic/molecular subtypes could not be confirmed due to insufficient sample representation. Given the frequency of KMT2A-rearranged samples in our cohort and the role KMT2A fusion proteins play in driving dysregulated epigenetics, we specifically clustered samples based on KMT2A fusion status and found a distinct KMT2A-rearranged SE profile (supplemental Figure 1D).
Across all samples, we identified a subset of recurrent SE loci and genes shared in >25% of pAML samples that we termed “core pAML SEs.” These 581 core SEs were ordered according to the product of H3K27ac signal/amplitude and SE frequency across all samples, or by using their FASE score, as previously published23 (Figure 1C; supplemental Table 3). As expected, we identified SEs associated with multiple hematopoietic regulators, including genes previously associated with myeloid leukemias (eg, the HOXA cluster, MEIS1, MEF2D, RUNX1), were identified.7,26 We performed RNA-seq on 19 samples and confirmed a general positive correlation between expression of selected genes and the strength of their corresponding SEs (as measured by the percentile rank of the SE in a particular sample) (supplemental Figure 1E). These core pAML SE-regulated genes were compared to published signatures: three of the five most enriched signatures were related to regulation of transcription and transcriptional output (Gene Ontology analysis) (Figure 1D). A PML-RARA fusion signature was the most highly enriched molecular signature (MSigDB) (Figure 1E), with two additional retinoid signatures also enriched in the top 50 enriched signatures (supplemental Table 3).
Given the enrichment of retinoid signatures in our cohort, we compared the overall RARA enhancer ranking within our consensus pAML SE landscape to that of ZEB2 and KRAS, which had high and low FASE scores, respectively. While all the samples had high ZEB2 SE rankings and KRAS low enhancer rankings, RARA exhibited differential enhancer ranking across all samples, which was generally correlated to the presence/absence of an RARA SE (Figure 1F). Taken together, these results indicate that pAML and KMT2A-rearranged pAML have distinct SE profiles, that pAML has multiple SE-regulated leukemia-specific drivers, and that retinoid signatures are enriched among the commonly shared SE-associated genes of pAML.
pAML frequently contains an RARA SE that is correlated to some leukemia drivers
We next probed the role of a RARA SE in our pAML cohort. We detected a 64% incidence of a RARA SE (Figure 2A), with 42% of the samples (n = 10) containing a RARA SE in the top 100 of all SEs (supplemental Table 1). This finding was similar but slightly higher than published in adult AML samples.10 Globally, the composite H3K27ac load at the RARA SE locus and RARA SE ranking were confirmed to be higher in the RARA SE+ samples and cell lines (Figure 2B; supplemental Figure 2A-B). Every cytogenetic and molecular subgroup tested had at least one sample with the RARA SE (Figure 2A; supplemental Figure 2C). Further comparison of the RARA SE rank vs its expression level across all samples showed a general correlation, indicating correct assignment (supplemental Figure 1E). Of the nine KMT2A-rearranged samples, all four KMT2A-AFDN samples contained a RARA SE, whereas the other KMT2A fusion samples had a mixed RARA SE presence. Although the 2 CBF-rearranged AML samples [t(8;21) and inv(16)] did not cluster together by SE similarity (Figure 1B), both contained a RARA SE. This finding suggests that transcriptional regulation could contribute to the biologic differences in this heterogeneous subtype of CBF AML27 ; however, more samples of each CBF subtype are needed to determine the true frequency of a RARA SE. The sample with the lowest ranked RARA SE, p151 (Figure 1F), was from a patient with trisomy 21 who presented with transient myeloproliferative disorder, a potentially self-resolving condition. This sample, and surprisingly the one APL sample of the cohort that also had an RARA SE, were specifically confirmed to have significant H3K27ac levels at the RARA SE locus (supplemental Figure 2D). However, little can be concluded from inclusion of only one sample of each of these subtypes.
To identify other genes that could modulate sensitivity to retinoid agonists, we determined the pairwise Pearson correlation of each consensus H3K27ac SE region to the RARA SE across all samples. We observed that FOSB and RUNX1 were highly correlated to the RARA SE locus (Figure 2C), as were SPI1, JUNB, DOT1L, and general AML dependencies (eg, MCL1) (supplemental Table 4). However, other AML-relevant genes showed poor correlation with the RARA SE locus, including CDK6, MEF2C, and the HOXA cluster. Differential H3K27ac load was seen at some of the most highly correlated and least correlated loci in both cell lines and samples (Figure 2D; supplemental Figure 2E). Using the most correlated genes to generate a RARA SE–correlated pAML gene signature, we again confirmed that the most enriched signature was the Martens PML_RARA fusion gene signature (Figure 2E). The Tretinoin response signature and other AML gene signatures, including KMT2A, were also enriched (supplemental Table 4). Some of the most poorly correlated gene signatures include hematopoietic stem cell signatures as well as other transcription factor–regulated gene sets (Figure 2F; supplemental Table 4). We concluded that certain SE-associated, pAML-relevant genes are closely correlated to the RARA SE, but there are also SE-associated genes driving RARA-independent pathways in pAML.
In vitro sensitivity to the retinoid agonist tamibarotene predicted by presence of RARA SE
We confirmed our RNA-seq to SE rank correlations (supplemental Figure 1E) by targeted RARA expression profiling using reverse transcription quantitative polymerase chain reaction (RT-qPCR) in both pAML cell lines and select patient samples; a relationship was observed between SE assignment to RARA and RARA messenger RNA levels (Figure 3A, see supplemental Figure 2C for details on RARA SE status and cytogenetics of samples selected). Compared with the SE− cell line (Kasumi1) and patient samples (p163 and p198), we observed elevated RARA messenger RNA in RARA SE+ pAML cell lines and patient samples, respectively. A range of RARA expression was noted in the SE+ samples, which correlated with our enhancer rankings in Figure 1F.
![RARA SE+ pAML cells are sensitive to tamibarotene.RARA SE+ pAML samples per cell lines are in red, RARA SE− pAML samples per cell lines in blue, and APL cell line in gray. Experiments were conducted in biologic triplicates (except where noted), and all experiments were repeated at least once as independent, asynchronous experiments to confirm results, with representative data from one independent experiment shown. (A) RARA messenger (messenger RNA [mRNA]) levels in pAML cell lines (Kasumi1, MV4;11, THP1), an APL cell line (NB4), and patient samples (technical replicates n = 3 per cell line or sample). (B) Effect of tamibarotene (100 nM) on cell viability over time. Viability was normalized to the viability of dimethyl sulfoxide (DMSO)-treated cells measured at the same time points. (C) CD38 positivity in response to tamibarotene (100 nM) after 72 hours’ treatment. Expression of other differentiation markers in response to tamibarotene (100 nM) after 72 hours’ treatment: CD66 (D) and CD11c (E). (F) Induction of apoptosis by 100 nM tamibarotene in pAML cell lines and samples after 72 hours’ treatment. (G) DHRS3 mRNA expression fold change after 24 hours’ tamibarotene treatment (100 nM). * P < .05; **.001 < P < .01; ***.0001 < P < .001; ****P < 0.0001.](https://ash.silverchair-cdn.com/ash/content_public/journal/bloodadvances/5/23/10.1182_bloodadvances.2020003737/2/m_advancesadv2020003737f3.png?Expires=1768065625&Signature=ragYxKym9dfU2CsNC~HJk8TY1FhpcnLum6ZAIkAt0ecu0YUTeeMmUlmBegySY8Q~ifsbg0DcZplnunIlvIzltMKQwqygI6LXqzqXJ~CkPnBLFZXcDECwOhZK0uv1I0vP7qpb0bQmgFctePSfiiwOmZOrtYLg4MIBAHkPwti592aXnTMcEJrxxJyrnXsZJApxLOl3XxRbVHb9lEjPNeMU5wBMUTodqess6W49wnIJ7wmm6EeGDkPYH4pgIu7SuAphWGpndsJDDxdil6EfMDvYGz99P8L5mNgHglk6gSBWi18YJg8k3AbTbFaXX~PKJz9bbKUHzQgIT2lX66M94pFsWw__&Key-Pair-Id=APKAIE5G5CRDK6RD3PGA)
RARA SE+ pAML cells are sensitive to tamibarotene.RARA SE+ pAML samples per cell lines are in red, RARA SE− pAML samples per cell lines in blue, and APL cell line in gray. Experiments were conducted in biologic triplicates (except where noted), and all experiments were repeated at least once as independent, asynchronous experiments to confirm results, with representative data from one independent experiment shown. (A) RARA messenger (messenger RNA [mRNA]) levels in pAML cell lines (Kasumi1, MV4;11, THP1), an APL cell line (NB4), and patient samples (technical replicates n = 3 per cell line or sample). (B) Effect of tamibarotene (100 nM) on cell viability over time. Viability was normalized to the viability of dimethyl sulfoxide (DMSO)-treated cells measured at the same time points. (C) CD38 positivity in response to tamibarotene (100 nM) after 72 hours’ treatment. Expression of other differentiation markers in response to tamibarotene (100 nM) after 72 hours’ treatment: CD66 (D) and CD11c (E). (F) Induction of apoptosis by 100 nM tamibarotene in pAML cell lines and samples after 72 hours’ treatment. (G) DHRS3 mRNA expression fold change after 24 hours’ tamibarotene treatment (100 nM). * P < .05; **.001 < P < .01; ***.0001 < P < .001; ****P < 0.0001.
RARA SE+ pAML cells are sensitive to tamibarotene.RARA SE+ pAML samples per cell lines are in red, RARA SE− pAML samples per cell lines in blue, and APL cell line in gray. Experiments were conducted in biologic triplicates (except where noted), and all experiments were repeated at least once as independent, asynchronous experiments to confirm results, with representative data from one independent experiment shown. (A) RARA messenger (messenger RNA [mRNA]) levels in pAML cell lines (Kasumi1, MV4;11, THP1), an APL cell line (NB4), and patient samples (technical replicates n = 3 per cell line or sample). (B) Effect of tamibarotene (100 nM) on cell viability over time. Viability was normalized to the viability of dimethyl sulfoxide (DMSO)-treated cells measured at the same time points. (C) CD38 positivity in response to tamibarotene (100 nM) after 72 hours’ treatment. Expression of other differentiation markers in response to tamibarotene (100 nM) after 72 hours’ treatment: CD66 (D) and CD11c (E). (F) Induction of apoptosis by 100 nM tamibarotene in pAML cell lines and samples after 72 hours’ treatment. (G) DHRS3 mRNA expression fold change after 24 hours’ tamibarotene treatment (100 nM). * P < .05; **.001 < P < .01; ***.0001 < P < .001; ****P < 0.0001.
We then assessed the sensitivity of the same pAML cell lines and samples to the retinoid agonist tamibarotene. Viability over time was decreased in the RARA SE+ cell lines and patient samples, with no discernible effect in the RARA SE− cell line Kasumi1 or in the SE− patient samples (Figure 3B). Dose–response testing in cell lines displayed comparable potency, as previously reported (supplemental Figure 3A).10 Because tamibarotene was formulated to be a more potent, more pharmacokinetically stable synthetic retinoid than ATRA,28 and ATRA had minimal benefit in an RARA-high mouse model in reference,10 we focused our subsequent studies on tamibarotene.
ATRA upregulates CD38 in APL, and tamibarotene has been shown to induce its expression in adult RARA SE+ samples.10,29 We observed that tamibarotene significantly upregulated CD38 only in the treated RARA SE+ pAML cell lines and samples (Figure 3C). We also observed that tamibarotene upregulated other differentiation markers (CD66 and CD11c) in the RARA SE+ cell lines and samples while not in the SE− cell lines and samples (Figure 3D-E). RARA SE+ cell lines and samples also exhibited increased apoptosis with tamibarotene treatment (Figure 3F). In the tamibarotene clinical trial patients, DHRS3, a known RARA target gene, is upregulated within 8 hours of the first tamibarotene dose and remains upregulated at day 15.10,30 Similar to its CD38 effects, tamibarotene induced DHRS3 in the pAML RARA SE+ cell lines and patient samples (Figure 3G). However, although there was no effect in the RARA SE− cell line, DHRS3 was minimally to moderately induced by tamibarotene in the RARA SE− patient samples, indicating tamibarotene’s potency but suggesting the role of other, RARA-independent modulators of retinoid responsiveness.
To gauge the transcriptional effects of tamibarotene on RARA SE+ pAML, we assessed the global gene expression changes of the p401 sample treated with tamibarotene compared with vehicle. While McKeown et al10 reported that tamibarotene induced minimal transcriptional effects in three RARA-low cell lines, in this RARA SE+ sample, we observed 130 genes significantly upregulated more than twofold (including DHRS3 and CD38) and 47 genes downregulated (Figure 4A; supplemental Table 5). Upregulated genes include integrins and genes involved with leukocyte motility and signaling, confirming a differentiating effect of tamibarotene in this sample (Figure 4B). When we compared the most upregulated genes in response to tamibarotene vs published genetic and chemical alterations by gene set enrichment analysis (GSEA), we confirmed that some of the most associated gene signatures were those involving retinoid signaling (false discovery rate <0.05) (Figure 4C-D; supplemental Figure 3B). Some of the other most upregulated gene signatures included interferon pathways (which have intertwined anticancer synergy with retinoid signaling)31,32 and MYC downregulated gene signatures (supplemental Table 6). Of known PML-RARA–repressed genes in APL,33 only a small number were upregulated with tamibarotene in the RARA SE+ sample (eg, IRF1, BHLHE40), suggesting some overlap but also distinct regulation of leukemia maintenance between the chimeric oncoprotein’s chromatin reorganization in APL and RARA-driven transcriptional repression in pAML.
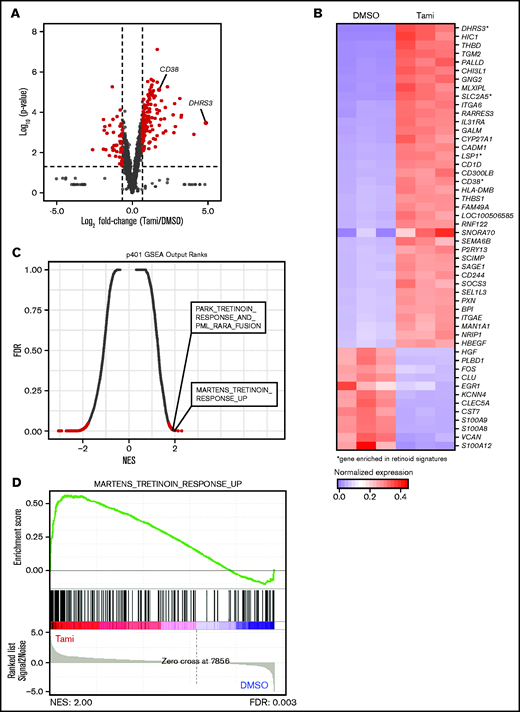
Tamibarotene-induced gene expression changes in a RARA SE+ pAML sample consistent with retinoid-differentiating effect. (A) Tamibarotene-induced gene expression changes from RNA-seq in p401 after 24 hours of tamibarotene treatment (100 nM, n = 4 biologic replicates), with significance determined by a Log2FC cutoff of 1 to −1 and a P value <.05. (B) Row-normalized expression of the top 50 most differentially regulated genes in panel A defined by absolute Log2FC. (C-D) Gene set enrichment analysis (GSEA) of significant genes from panel B, with (C) being a quantitative comparison of all gene sets available from the molecular signature database (MSigDB) by gene set enrichment analysis for tamibarotene-treated p401 cells. Data are presented as a scatterplot of the false discovery rate (FDR) vs normalized enrichment score (NES) for each evaluated gene set. Red indicates significant sets based on an FDR cutoff <0.05. (D) Plot of the running sum for the most enriched retinoid gene set within the tamibarotene-treated p401 data set, including the normalized enrichment score and the leading-edge subset of enriched genes. DMSO, dimethyl sulfoxide.
Tamibarotene-induced gene expression changes in a RARA SE+ pAML sample consistent with retinoid-differentiating effect. (A) Tamibarotene-induced gene expression changes from RNA-seq in p401 after 24 hours of tamibarotene treatment (100 nM, n = 4 biologic replicates), with significance determined by a Log2FC cutoff of 1 to −1 and a P value <.05. (B) Row-normalized expression of the top 50 most differentially regulated genes in panel A defined by absolute Log2FC. (C-D) Gene set enrichment analysis (GSEA) of significant genes from panel B, with (C) being a quantitative comparison of all gene sets available from the molecular signature database (MSigDB) by gene set enrichment analysis for tamibarotene-treated p401 cells. Data are presented as a scatterplot of the false discovery rate (FDR) vs normalized enrichment score (NES) for each evaluated gene set. Red indicates significant sets based on an FDR cutoff <0.05. (D) Plot of the running sum for the most enriched retinoid gene set within the tamibarotene-treated p401 data set, including the normalized enrichment score and the leading-edge subset of enriched genes. DMSO, dimethyl sulfoxide.
Tamibarotene has efficacy in RARA SE pAML patient-derived xenografts
We next wanted to confirm whether tamibarotene sensitivity in vivo is predicted by RARA SE status. We generated a RARA SE+ patient-derived xenograft (PDX) model of sample p401 (containing a KMT2A-MLLT10 rearrangement). Once engraftment was confirmed, mice were treated with either vehicle or tamibarotene until euthanasia. Leukemic burden in the peripheral blood was tracked by hCD45+hCD33+ cells; we observed that tamibarotene decreased leukemia disease burden compared with vehicle alone (Figure 5A). Mice were euthanized when moribund, and all mice had evident leukemia as the cause of clinical deterioration. However, the tamibarotene-treated mice also had lower spleen and liver weights at time of euthanasia than vehicle-treated mice (Figure 5B). Also, the mice given tamibarotene had a significant survival advantage compared with the mice given vehicle (Figure 5C). CD38 was upregulated only in the tamibarotene-treated mice, which was sustained over time (Figure 5D). We compared these findings vs those of a PDX model of the RARA SE− pAML sample p198 (also containing a KMT2A-MLLT10 rearrangement) and treated as noted above. We observed tamibarotene did not suppress peripheral leukemic burden (Figure 5E). Liver and spleen weights at time of euthanasia showed no difference between treatment groups (Figure 5F). Tamibarotene also did not prolong the survival of this RARA SE− model (Figure 5G) Overall, there was no to minimal significant weight loss in either group of mice with tamibarotene treatment (Figure 5H). Our results indicate that tamibarotene has superior antileukemic efficacy in RARA SE+ pAML patient samples compared with RARA SE− pAML samples, both in vitro and in vivo.

RARA SE presence predicts pAML in vivo sensitivity to tamibarotene. (A) Effect of tamibarotene (6 mg/kg by oral gavage daily) on peripheral blood leukemic burden in p401, a RARA SE+ pAML PDX mice (n = 5 per arm). (B) Effect of tamibarotene treatment on the liver and spleen weights of p401 PDX mice at time of euthanasia. (C) Effect of tamibarotene treatment on survival of p401 PDX mice. (D) CD38+ cells percentage in response to tamibarotene treatment in p401 PDX mice. (E) Effect of tamibarotene on the peripheral blood leukemia burden of p198, an RARA SE− pAML PDX (n = 6 per arm). (F) Effect of tamibarotene treatment on the liver and spleen weights of p198 PDX mice at time of euthanasia. (G) Effect of tamibarotene treatment on survival of p198 PDX mice. (H) Body weights of both p401 and p198 mice treated with tamibarotene over time. **.001 < P < .01; ***.0001 < P< .001. n.s., not significant.
RARA SE presence predicts pAML in vivo sensitivity to tamibarotene. (A) Effect of tamibarotene (6 mg/kg by oral gavage daily) on peripheral blood leukemic burden in p401, a RARA SE+ pAML PDX mice (n = 5 per arm). (B) Effect of tamibarotene treatment on the liver and spleen weights of p401 PDX mice at time of euthanasia. (C) Effect of tamibarotene treatment on survival of p401 PDX mice. (D) CD38+ cells percentage in response to tamibarotene treatment in p401 PDX mice. (E) Effect of tamibarotene on the peripheral blood leukemia burden of p198, an RARA SE− pAML PDX (n = 6 per arm). (F) Effect of tamibarotene treatment on the liver and spleen weights of p198 PDX mice at time of euthanasia. (G) Effect of tamibarotene treatment on survival of p198 PDX mice. (H) Body weights of both p401 and p198 mice treated with tamibarotene over time. **.001 < P < .01; ***.0001 < P< .001. n.s., not significant.
Discussion
For several decades, leukemia clinicians and scientists have urgently sought new drugs for both pAML and adult AML. In the past few years, there has been hope on the horizon with approval by the US Food and Drug Administration of liposomal daunorubicin/cytarabine, FLT3 inhibitors, IDH1/2 inhibitors, and B-cell lymphoma 2 inhibitors for adults with AML. Here we performed the first enhancer landscaping of pAML and confirmed that pAML and adult AML have generally different SE landscapes. We found that many known leukemia driver genes are SE associated. Our assessment of the “core pAML SE-associated genes” across all cytogenetic and molecular subtypes of pAML implies an addiction to misregulated transcriptional control. This aligns with common structural rearrangements in pAML driving altered gene expression programs that commonly causing a blockade in normal myelopoiesis. Although these chimeric oncoproteins may lack druggable pockets, we identified the nuclear hormone receptor RARA as a dependency in nearly two-thirds of pAML that was exploited with the retinoid tamibarotene for antileukemic effect in vitro and in vivo. Tamibarotene induced differentiation and apoptosis of RARA SE+ pAML. We also confirmed that the downstream targets of RARA (including pharmacodynamic biomarker DHRS3) appears to have similarly robust upregulation in pAML and thus could be incorporated into a pediatric trial. Although retinoids have multiple beneficial effects in patients with APL, trials in pAML and adult AML have shown inconsistent benefits. Those findings are supported by prior studies indicating that retinoid signaling may induce myeloid differentiation but not affect survival,34,35 but we and others submit that perhaps more specific selection of patients whose AML exhibits a heightened reliance on RARA signaling might show more conclusive benefit.10 IDH)
Although pAML is biologically different between infants, children, young adults, and older adults,7 we observed a finding also seen in adult AML; that is, a majority of samples contain a RARA SE that correlates to sensitivity to the second-generation retinoid tamibarotene.10 In addition, although McKeown et al10 studied tamibarotene’s effect on global gene expression of RARA-high cell lines, we were able to confirm that tamibarotene has similar effects in a RARA SE+ primary pAML sample. Lastly, in vivo modeling of tamibarotene confirmed that the antileukemic effects were confined to RARA SE+ PDX pAML models as well, with our model also detecting CD38 upregulation in the tamibarotene-treated mice. However, unlike the findings of the adult study, SE profiles did not seem to subgroup our pAML cohort into new subgroupings but rather appeared to be correlated to known cytogenetic/molecular features. We acknowledge that an overrepresentation of KMT2A-rearranged samples limits a full conclusion to this effect.
MLL- (or KMT2A)-rearranged pAML has long been known to be an epigenetically driven disease.36–38 In our cohort, KMT2A-rearranged samples also appear to have distinct chromatin profiles and cluster overall similarly than with other pAMLs, which agree with other published reports on KMT2A-rearranged leukemias having unique gene expression programs and chromatin profiles.36,39,40 A deeper understanding of the KMT2A-rearranged pAML core regulatory circuitry (CRC),41 compared with those of non–KMT2A-rearranged pAML, KMT2A-rearranged adult AML, and KMT2A-rearranged ALL, is critical to determine the chromatin-regulated difference in these types of acute leukemias, potentially highlighting different but related networks to exploit.
In addition, identification of the CRC of pAML globally and in those RARA SE+ samples may delineate the RARA-dependent and RARA-independent networks controlling pAML subgroups. Deeper investigations into the relationship between SE ranking and predictive sensitivity will be critical for pediatric clinical trial development. Furthermore, exploration of the most and least correlated SE-associated genes to the RARA SE locus may also provide insight into which patients with “high” RARA levels would most benefit from tamibarotene treatment. Lastly, mechanisms of resistance to tamibarotene in the setting of persistent activated retinoid signaling must be interrogated to guide tamibarotene clinical development in children with relapsed/refractory AML.
In conclusion, we present the first pAML cohort enhancer and SE landscape, which showed a high prevalence of a RARA SE. These samples were responsive to tamibarotene, in analogous fashion to previously published AML cell lines and adult PDX models.10 As the adult trial of tamibarotene thus far preliminarily seems positive and should be completed in the near future, we believe this bodes well for translating our findings to a pediatric trial, as our data indicate that a potentially large fraction of children with relapsed/refractory AML might be eligible for such a trial. Our data also provide a blueprint to identifying other druggable dependencies in this aggressive disease.
Acknowledgments
The authors thank Stephen C. Mack and Ronald Bernardi for many helpful conversations.
This project was supported by the Genomic and RNA Profiling Core at Baylor College of Medicine and the Cytometry and Cell Sorting Core at Baylor College of Medicine with funding from the CPRIT Core Facility Support Award (CPRIT-RP180672), the National Institutes of Health (NIH) (National Cancer Institute, P30 CA125123; National Center for Research Resources, S10 RR024574), and the expert assistance of Joel M. Sederstrom. M.W.P. is supported by the NIH (National Cancer Institute, 3R01CA215452-01S1 and 3R01CA215452-02S2). T.M.H. is supported by the NIH (National Cancer Institute, R01-CA164024) and Takeda Pharmaceuticals (IIS-AAML1031). A.M.S. is supported by the Cure Childhood Cancer Foundation, the Pablove Foundation, and the Turn It Gold Foundation. C.Y.L. is a CPRIT Scholar for Cancer Research and a Pew-Stewart Scholar for Cancer Research (Alexander and Margaret Stewart Trust); he is supported by CPRIT (RR150093) and the NIH (National Cancer Institute, R01CA215452). J.S.Y. is supported by Hyundai Hope on Wheels, the NIH (National Cancer Institute, 5K12CA090433-17), Alex’s Lemonade Stand Foundation, the Curing Kids Cancer Foundation, and CURE Childhood Cancer Foundation.
Authorship
Contribution: J.S.Y. and C.Y.L. conceived the concept and oversaw all experiments; T.M.H. provided the banked samples; H.W., O.S.-G., K.D., and A.D. conducted the patient sample and cell laboratory experiments (including ChIPmentation) with assistance from N.C.; M.W.P. performed all the computational analysis of the samples and putting together the figures; W.D.P. analyzed the RNA-Seq data; M.W.P., W.D.P., and J.V.K. uploaded the data to the Gene Expression Omnibus; M.T. and R.R. conducted the animal experiments, with assistance from J.J.J. and V.U.G. and oversight/experimental design by A.M.S. and J.S.Y.; C.V.C. and F.L. assisted with animal experiment interpretation; and J.S.Y. wrote the manuscript with significant editing by M.W.P. and C.Y.L.
Conflict-of-interest disclosure: C.Y.L. is an executive at and shareholder of Kronos Bio. and has intellectual property licensed to Syros Pharmaceuticals. The remaining authors declare no potential conflicts of interest.
Correspondence: Joanna S. Yi, Baylor College of Medicine, 1102 Bates Ave, Suite 1220, Houston, TX 77030; e-mail: jsyi@bcm.edu; and Charles Y. Lin, Baylor College of Medicine, One Baylor Plaza, Houston, TX 77030; e-mail: Charles.Y.Lin@bcm.edu.

