

Key Points
MEF2D is highly expressed in MLL-rearranged AML and required for leukemia development in vitro and in vivo.
MEF2D suppresses CEBPE-mediated myeloid differentiation in AML.

Abstract
Acute myeloid leukemia (AML) with MLL-rearrangement (MLL-r) comprises ∼10% of all AML cases and portends poor outcomes. Much remains uncovered on how MLL-r AML drives leukemia development while preventing cells from normal myeloid differentiation. Here, we identified that transcription factor MEF2D is a super-enhancer-associated, highly expressed gene in MLL-r AML. Knockout of MEF2D profoundly impaired leukemia growth, induced myeloid differentiation, and delayed oncogenic progression in vivo. Mechanistically, MEF2D loss led to robust activation of a CEBPE-centered myeloid differentiation program in AML cells. Chromatin profiling revealed that MEF2D binds to and suppresses the chromatin accessibility of CEBPE cis-regulatory regions. In human acute leukemia samples, MEF2D expression showed a strong negative correlation with the expression of CEBPE. Depletion of CEBPE partially rescued the cell growth defect and myeloid cell differentiation induced by the loss of MEF2D. Lastly, we show that MEF2D is positively regulated by HOXA9, and downregulation of MEF2D is an important mechanism for DOT1L inhibitor-induced antileukemia effects. Collectively, our findings suggest that MEF2D plays a critical role in human MLL-r AML and uncover the MEF2D-CEBPE axis as a crucial transcriptional mechanism regulating leukemia cell self-renewal and differentiation block.
Introduction
Acute myeloid leukemia (AML) is a deadly disease characterized by 2 hallmarks: (1) unlimited proliferation of myeloid-lineage progenitor cells and (2) impaired hematopoietic differentiation. Despite frontline chemotherapy, the 5-year patient survival remains lower than 30% for most majority subtypes.1 Recurrent chromosomal translocation of the KMT2A (MLL) gene is found among most childhood AML and a subset (∼10%) of adult AML with a poor prognosis and limited therapeutic options.2,3 The MLL rearrangement (MLL-r) produces a chimeric protein that recruits histone methyltransferase DOT1L-containing transcription elongation complex to selected oncogenic transcription factors, including HOX-A cluster genes such as HOXA9, to promote gene activation and leukemia development.4,5 Genetic or pharmacological inhibition of DOT1L leads to reduced MLL-r target gene expression and impaired leukemia development in preclinical models, and the DOT1L-specific inhibitors are being evaluated in clinical trials.6,7 Despite these efforts, MLL-r AML remains a therapeutic challenge. The oncogenic drivers and transcriptional dependencies of MLL-r AML remain poorly characterized.8
MEF2D is a member of MEF2 family transcriptional factors (MEF2A, MEF2B, MEF2C, and MEF2D) and plays cellular functions in skeletal, cardiac, and neuronal development.9,10 MEF2 family proteins have dual roles in both gene activation and repression by association with different complexes.9 The transcription activity of MEF2 family proteins can be stimulated by direct interaction with CBP/P300 coactivators.11 Upon binding of the class IIa histone/protein deacetylases (HDACs), MEF2 proteins can switch off their transcription activity and lead to transcriptional repression of target genes.12 In development, MEF2C-null mice are embryonic lethal, and MEF2A-null mice die perinatally, while MEF2D-null mice are viable and appear normal, suggesting distinct requirements of MEF2 family members during development.13-15 In normal hemopoiesis, MEF2D is involved in T-cell and early B-cell development.16-19 Recently, chromosomal translocations involving MEF2D have been reported in B-cell acute lymphoblastic leukemia (B-ALL) cases, although the molecular function of MEF2D-fusion proteins still requires further studies.20-22 Despite these pieces of knowledge, the biological function of wildtype MEF2D and its transcriptional targets in AML remain elusive.
The CCAAT/enhancer-binding protein ε (CEBPE), a DNA-binding transcription factor of the C/EBP family, has been known as a master regulator for myeloid cell differentiation.23-26 CEBPE knockout mice fail to undergo normal granulocytic differentiation and ultimately develop myelodysplasia phenotypes.24 Ectopic expression of CEBPE can induce monocytic differentiation in MLL-r AML cells.27 Interestingly, CEBPE has recently been reported to be an independent prognostic factor in human AML patients.28 Low-CEBPE levels strongly predict shorter overall survival and higher relapse rate.28 Recently, the Ikaros transcription factor Ikzf2 has been shown to repress the expression of CEBPE to promote leukemogenesis.29 A distal enhancer of murine CEBPE, which is located 6 kb downstream from its transcriptional start site, has been reported to be required for CEBPE expression and normal granulocyte differentiation.30 However, how MLL-r AML suppresses CEBPE expression to prevent normal myeloid differentiation remains to be explored.
Here, we report that MEF2D is significantly elevated in MLL-r patient AML samples and investigated the role of MEF2D in the regulation of CEBPE and AML maintenance using both in vitro and in vivo leukemia models.
Methods
The detailed procedures of cell culture, plasmid construction, antibodies, virus production and infection, clustered regularly interspaced short palindromic repeats (CRISPR)/CRISPR-associated protein 9 (Cas9)-mediated gene knockout, inhibitor treatment, quantitative real-time polymerase chain reaction (qRT-PCR), immunoblotting, flow cytometry, RNA-sequence and data analysis, Gene Set Enrichment Analysis (GSEA), chromatin immunoprecipitation (ChIP) and sequencing, Assay for Transposase Accessible Chromatin with high-throughput sequencing (ATAC-seq), as well as the detailed information for ChIP-seq and ATAC-seq data analysis are described in supplemental Methods.
Primary samples
Samples were obtained from AML patients with MLL-rearrangements seen at the University of Alabama at Birmingham. Mononuclear cells were isolated by Ficoll-Hypaque (Sigma Diagnostics, St. Louis, MO) separation. All subjects signed an informed consent form. Sample acquisition was approved by the Institutional Review Board at the University of Alabama at Birmingham Hospital, in accordance with an assurance filed with and approved by the Department of Health and Human Services, and met all requirements of the Declaration of Helsinki. Normal CD34+ cells were isolated from umbilical cord blood mononuclear cells using immunomagnetic beads (Miltenyi Biotech, Auburn, CA).
Competitive proliferation assay
Cas9-expressing cell lines were infected with individual single guide RNAs (sgRNAs) in LRCherry2.1 mCherry-expressing vector, followed by measurement of the percentage of mCherry-positive cells at indicated days post-infection using flow cytometry. The percentage of mCherry-positive cells at later time points was normalized to the percentage at the specified initial time point.
In vivo leukemia growth in xenograft models
All animal experiments were approved by the Institutional Animal Care and Use Committees at the University of Alabama at Birmingham. Detailed procedures are available in supplemental Methods.
Statistical analyses
Data are presented as the mean ± standard error of the mean from 3 independent experiments unless otherwise noted. Statistical analyses were performed by 2-tail Student t test for comparing 2 sets of data with assumed normal distribution unless otherwise noted. Mann-Whitney U test was performed for data sets not showing a normal distribution. χ2test was performed for categorical variables. Survival analyses were performed by using log-rank test with GraphPad Prism software (v8.0). *, **, and *** denote p values < .05, .01, and .001, respectively. NS denotes not significant.
Results
MEF2D is upregulated among primary samples of MLL-rearranged AML patients
Super-enhancers, which are formed by clusters of transcriptional enhancers, are occupied by exceptionally high levels of active enhancer-associated histone marks such as H3K27ac and tend to drive robust gene expression.31,32 In cancer cells, super-enhancer-associated genes are significantly enriched with genes important for tumor function, including oncogenic transcription factors, cell cycle regulators, antiapoptotic factors, and genes specific to the tumor’s cell of origin.31,33-36 To identify novel targets for putative therapeutic intervention in AML, we performed super-enhancer profiling using publicly available H3K27ac ChIP-seq datasets in a panel of human AML cell lines and normal CD34-positive hematopoietic stem and progenitor cells. We identified a robust super-enhancer occupation at the MEF2D locus in a subtype of AML samples (mostly MLL-r AML) (Figure 1A). The MEF2D super-enhancer is not present in normal human CD34+ hematopoietic stem and progenitor cells (HSPCs) or in cell lines without MLL-fusion (Figure 1A). We also confirmed the presence of MEF2D super-enhancer in primary human MLL-r AMLs (supplemental Figure 1A).

MEF2D is a super-enhancer gene overexpressed in human MLL-r AML and predicts poor survival. (A) H3K27ac ChIP-seq tracks in human AML cells with or without MLL gene fusion, as well as in CD34+ normal HSPCs. Super-enhancer regions were highlighted in MLL-r cell lines. Shown are cell line names and source data accession numbers in the Gene Expression Omnibus repository. (B-C) MEF2D mRNA (B) and protein (C) expression in MLL-r and non-MLL-r human AML cell lines. (D) MEF2D expression in various human AML subgroups, comparing to the healthy bone marrow control (GSE13159). (E) qPCR analysis of MEF2D expression in primary MLL-rearranged AML samples (n = 7) and normal CD34+ bone marrow cells isolated from healthy donors (n = 6). (F) Survival analysis in The Cancer Genome Atlas (TCGA) AML patients with high or medium MEF2D expression (n = 100), comparing to those with low MEF2D expression (n = 50). ***P < .001.
MEF2D is a super-enhancer gene overexpressed in human MLL-r AML and predicts poor survival. (A) H3K27ac ChIP-seq tracks in human AML cells with or without MLL gene fusion, as well as in CD34+ normal HSPCs. Super-enhancer regions were highlighted in MLL-r cell lines. Shown are cell line names and source data accession numbers in the Gene Expression Omnibus repository. (B-C) MEF2D mRNA (B) and protein (C) expression in MLL-r and non-MLL-r human AML cell lines. (D) MEF2D expression in various human AML subgroups, comparing to the healthy bone marrow control (GSE13159). (E) qPCR analysis of MEF2D expression in primary MLL-rearranged AML samples (n = 7) and normal CD34+ bone marrow cells isolated from healthy donors (n = 6). (F) Survival analysis in The Cancer Genome Atlas (TCGA) AML patients with high or medium MEF2D expression (n = 100), comparing to those with low MEF2D expression (n = 50). ***P < .001.
In normal development, MEF2D is expressed at high levels in specific tissues such as brain and muscle.9 Interestingly, in human cancer, MEF2D is expressed at the highest levels in AML in comparison with all other cancer types (supplemental Figure 1B). We examined MEF2D mRNA and protein expression in 8 different leukemia cell lines and found MEF2D was highly expressed in MLL-r leukemia lines but not non-MLL-r lines (Figure 1B-C). Consistently, MEF2D expression is elevated in AML patients harboring MLL rearrangement, compared with other AML subtypes or healthy controls (Figure 1D). Using primary human samples, we also confirmed that MEF2D is expressed at a significantly higher level in primary MLL-rearranged AML samples relative to normal CD34+ bone marrow cells isolated from healthy donors (Figure 1E). Furthermore, analysis of independent AML datasets showed that high MEF2D expression is strongly associated with poor survival (Figure 1F and supplemental Figure 1C), supporting a potential oncogenic role of MEF2D in AML.
MEF2D promotes the survival and self-renewal of leukemia cells in vitro, as well as tumorigenesis in xenografted animal models
To determine whether MEF2D plays a role in leukemic cells, we employed the CRISPR/Cas9-mediated gene knockout strategy to ask whether loss of MEF2D affects leukemia cell proliferation. We selected 2 sgRNAs targeting MEF2D at different exons and a Luciferase-targeting guide RNA as a negative control. By using a competition-based proliferation assay in a panel of 8 leukemia cell lines,37 we found that targeting MEF2D impaired the growth of 4 MLL-r leukemia lines (MOLM-13, MV4-11, OCI-AML2, and THP-1) but not the non-MLL-r leukemia lines (HEL, U937, SET-2, and K562) (Figure 2A-B). In contrast, a guide RNA targeting the pan-essential gene RPS19 impaired the proliferation of all 8 cell lines with similar efficiency, while the guide RNA targeting Luciferase gene did not affect cell proliferation (Figure 2C-D). We further confirmed that guide RNAs targeting different exons of MEF2D significantly reduced MEF2D protein levels in all 8 tested AML cell lines (Figure 2E). To further exclude the off-target effects that could occur in CRISPR/Cas9-mediated gene knockout, we selected an additional specific guide RNA targeting a MEF2D intron-exon junction region (Figure 2F), and this guide RNA also efficiently suppressed MLL-r AML growth and MEF2D expression (supplemental Figure 2A-B). As this guide RNA contains several mismatches to the human MEF2D complementary DNA (cDNA), it did not affect the exogenous expression of MEF2D (Figure 2F-G; supplemental Figure 2C). In this setting, we observed that the antiproliferation effect of MEF2D knockout could be rescued by exogenous expression of MEF2D in both MOLM-13 and MV4-11 cell lines (Figure 2H; supplemental Figure 2D), supporting an on-target effect of our CRISPR knockout study.
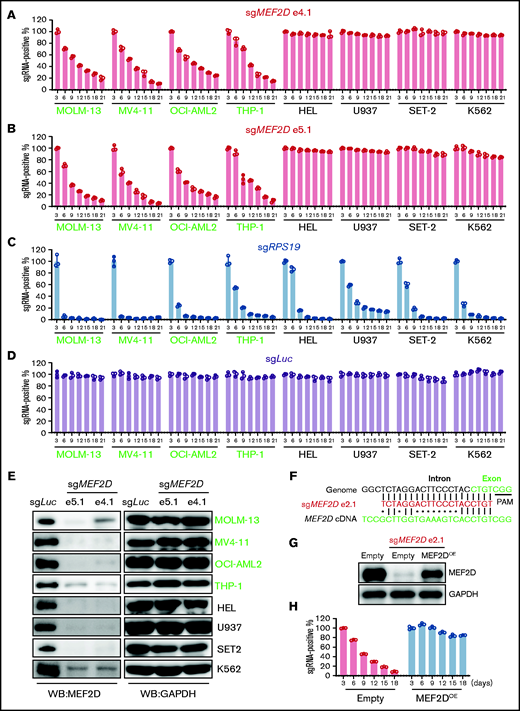
MEF2D is specifically required for MLL-rearranged AML. (A-D) Competitive proliferation assay showing that MEF2D is required for cell proliferation in MLL-r AML cells (left, green text) but not in non-MLL-r cells (right, black text). Cells were infected with indicated guide RNA, which is linked with an mCherry gene. The mCherry positive percentage was normalized to the day 3 measurement. Two independent guide RNAs targeting MEF2D exon 4 (e4.1; A) and exon 5 (e5.1; B) were used. An sgRNA targeting the pan-essential genes RPS19 (C) was used as a positive control and an sgRNA targeting the Luciferase gene sgLuc (D) was used as a negative control. (E) Western blot analysis showing CRIPSR/Cas9-mediated MEF2D gene knockout in 4 MLL-r AML cells (green) and 4 non-MLL-r AML cells (black). Two independent guide RNAs targeting MEF2D exon 4 (e4.1) and exon 5 (e5.1) were used. GAPDH serves as a loading control. (F) Comparison of MEF2D genomic and cDNA sequences at sgRNA (e2.1) recognition sites. Dots (•) indicate mismatches. PAM, protospacer-adjacent motif. (G) Western blot analysis showing MEF2D protein levels in indicated samples. Empty, empty vector; OE, overexpression. (H) Competitive proliferation assay in indicated MOLM-13 Cas9-expressing cell lines showing the effects upon MEF2D loss can be rescued by exogenous expression of MEF2D.
MEF2D is specifically required for MLL-rearranged AML. (A-D) Competitive proliferation assay showing that MEF2D is required for cell proliferation in MLL-r AML cells (left, green text) but not in non-MLL-r cells (right, black text). Cells were infected with indicated guide RNA, which is linked with an mCherry gene. The mCherry positive percentage was normalized to the day 3 measurement. Two independent guide RNAs targeting MEF2D exon 4 (e4.1; A) and exon 5 (e5.1; B) were used. An sgRNA targeting the pan-essential genes RPS19 (C) was used as a positive control and an sgRNA targeting the Luciferase gene sgLuc (D) was used as a negative control. (E) Western blot analysis showing CRIPSR/Cas9-mediated MEF2D gene knockout in 4 MLL-r AML cells (green) and 4 non-MLL-r AML cells (black). Two independent guide RNAs targeting MEF2D exon 4 (e4.1) and exon 5 (e5.1) were used. GAPDH serves as a loading control. (F) Comparison of MEF2D genomic and cDNA sequences at sgRNA (e2.1) recognition sites. Dots (•) indicate mismatches. PAM, protospacer-adjacent motif. (G) Western blot analysis showing MEF2D protein levels in indicated samples. Empty, empty vector; OE, overexpression. (H) Competitive proliferation assay in indicated MOLM-13 Cas9-expressing cell lines showing the effects upon MEF2D loss can be rescued by exogenous expression of MEF2D.
To systematically investigate the requirement of MEF2D in acute leukemia cells, we interrogated genome-wide CRISPR/Cas9 loss-of-function screens38 and analyzed the expression and dependency of MEF2D in 23 AML and 14 ALL cell lines. Interestingly, the dependency of MEF2D is significantly correlated with its expression level in both AML and ALL cells (supplemental Figure 2E-F). Consistent with our observations in AML cell lines and primary samples, MEF2D is expressed at significantly higher levels in MLL-r AML (supplemental Figure 2G), in which loss of MEF2D led to a more profound growth defect (supplemental Figure 2H). In ALL, we noticed that many MEF2DHigh cell lines do not carry MLL rearrangements (supplemental Figure 2F), indicating that other mechanisms may be involved in driving MEF2D expression. Our data also suggest that MEF2D may be required for certain non-MLL-r leukemias expressing high MEF2D levels. Indeed, in the non-MLL OCI-AML3 AML cell line where MEF2D is highly expressed (supplemental Figure 2E), knockout of MEF2D strongly impaired cell growth (supplemental Figure 2I-J). Collectively, our data suggest that MEF2D is a novel dependency in leukemias with aberrant MEF2D expression, such as MLL-r AML.
We further characterized MEF2D knockout AML cells by cellular analysis of cell apoptosis, cell cycle, and differentiation. We found that MEF2D knockout led to induction of apoptosis and increased sub-G1 cell population in different MLL-r AML cell lines (Figure 3A; supplemental Figure 3A-B), while the cell cycle distribution remained largely unaffected (supplemental Figure 3D-F). Furthermore, MEF2D depletion resulted in significant granulocytic and monocytic cell differentiation of leukemia cells, as measured by Wright-Giemsa staining and flow cytometry analysis of myeloid differentiation markers in MOLM-13 cells (Figure 3B-D). Similar cell differentiation phenotype was also observed in MEF2D-deficient MLL-r cell lines such as MV4-11 and THP-1 (supplemental Figure 3F-I). To examine the relevance of MEF2D to leukemia progression in vivo, Luciferase-expressing MOLM-13 cells were transduced with control and MEF2D sgRNAs and transplanted into immune-deficient recipient mice. The expression of MEF2D sgRNA resulted in a remarkable delay in leukemia progression (Figure 3E-F) and prolonged survival of the recipient mice (Figure 3G). The terminal leukemic cells in the MEF2D sgRNA group had similar protein levels of MEF2D to those from the control group (supplemental Figure 4J), indicating that the mice succumbed to an outgrowth of cells that escaped MEF2D depletion. Together, these data support a critical requirement of MEF2D for the maintenance of MLL-r AML in vitro and in vivo.
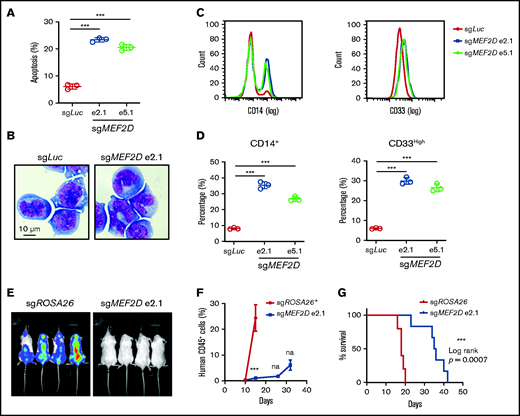
MEF2D knockout promotes myeloid differentiation and delays in vivo leukemogenesis of MLL-r AML. (A) Analysis of apoptotic cells in MOLM-13 cells 6 days after sgRNA-mediated knockout of MEF2D, relative to transduction of the sgLuc control sgRNA. (B) Wright-Giemsa of MOLM-13 cells 6 days after sgRNA-mediated knockout of MEF2D, relative to transduction of the sgLuc control sgRNA. (C) Representative flow cytometry analysis of differentiation markers CD14 (left) and CD33 (right) in MOLM-13 cells 6 days after sgRNA-mediated knockout of MEF2D, relative to transduction of the sgLuc control sgRNA. (D) Frequency of population with high myeloid differentiation markers CD14 (left) and CD33 (right) was measured by flow cytometry. (E) Luminescence of MOLM-13 (Cas9+, luciferase+) cells in the recipient mice at day 15 after xenotransplantation. (F) Percentage of human CD45+ cells in the peripheral blood of mice receiving MOLM-13 cells transduced with indicated sgRNAs at 10,15, 26-, and 32-day post injection. *All mice receiving MOLM-13 cells transduced with control guide RNA (sgROSA26) were dead before the day 26 measurement. (G) Kaplan–Meier survival curves of recipient mice transplanted with MOLM-13 cells expressing indicated sgRNAs.***P < .001; na, not analyzed.
MEF2D knockout promotes myeloid differentiation and delays in vivo leukemogenesis of MLL-r AML. (A) Analysis of apoptotic cells in MOLM-13 cells 6 days after sgRNA-mediated knockout of MEF2D, relative to transduction of the sgLuc control sgRNA. (B) Wright-Giemsa of MOLM-13 cells 6 days after sgRNA-mediated knockout of MEF2D, relative to transduction of the sgLuc control sgRNA. (C) Representative flow cytometry analysis of differentiation markers CD14 (left) and CD33 (right) in MOLM-13 cells 6 days after sgRNA-mediated knockout of MEF2D, relative to transduction of the sgLuc control sgRNA. (D) Frequency of population with high myeloid differentiation markers CD14 (left) and CD33 (right) was measured by flow cytometry. (E) Luminescence of MOLM-13 (Cas9+, luciferase+) cells in the recipient mice at day 15 after xenotransplantation. (F) Percentage of human CD45+ cells in the peripheral blood of mice receiving MOLM-13 cells transduced with indicated sgRNAs at 10,15, 26-, and 32-day post injection. *All mice receiving MOLM-13 cells transduced with control guide RNA (sgROSA26) were dead before the day 26 measurement. (G) Kaplan–Meier survival curves of recipient mice transplanted with MOLM-13 cells expressing indicated sgRNAs.***P < .001; na, not analyzed.
MEF2D inhibits CEBPE-centered myeloid differentiation programs in AML
To gain a genome-wide insight into how MEF2D regulates the transcriptional program of MLL-r leukemia, we performed RNA sequencing in MEF2D wildtype and knockout MOLM-13 cells. We identified 358 upregulated and 396 downregulated genes by knocking out of MEF2D (fold change > 1.5, FDR < 0.05) (Figure 4A; supplemental Table 1). In agreement with MEF2D’s known role in neural and muscle development, Gene Set Enrichment Analysis (GSEA) showed that genes downregulated by MEF2D knockout are enriched for nervous system development and skeletal muscle development, suggesting that MEF2D conservatively regulates a set of developmental genes in AML (Figure 4B; supplemental Figure 4A). Consistent with our cellular assays, we found that MEF2D positively regulates genes associated with stem cell maintenance and acute myeloid leukemia (Figure 4B). Gene ontology analysis also revealed a remarkable enrichment of genes involved in the granulocytic/myeloid process in the upregulated genes (Figure 4B; supplemental Figure 4B). Consistently, many genes associated with myeloid process or differentiation, such as BPI, MS4A3, and MPO,39-41 were significantly upregulated in MEF2D-deficient leukemia cells, while HDAC9, a canonical MEF2 target,42 was downregulated (Figure 4C).
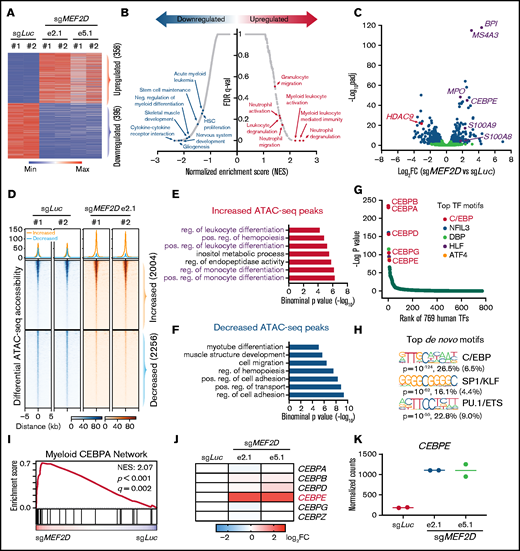
MEF2D represses genes involved in the CEBPE-centered myeloid differentiation. (A) Transcriptomic analysis of differentially expressed genes (fold change >1.5 and adjusted p-value <.05) between MEF2D-knockout and control MOLM-13 cells. (B) Gene sets enrichment analysis (GSEA) revealing top enriched gene signatures in upregulated and downregulated genes in MEF2D-knockout MOLM-13 cells. (C) Volcano plot showing fold change and adjusted p-value of gene expression between MEF2D-knockout and control MOLM-13 cells. Differentially expressed genes are marked in blue. (D) Heatmap displaying the ATAC-seq read densities in peaks with increased or decreased chromatin accessibility in MEF2D-knockout MOLM-13 cells, compared with sgLuc control. (E-F) Genomic Regions Enrichment of Annotations Tool annotation of ATAC-seq peaks with increased (E) or decreased (F) chromatin accessibility as identified in panel D. (G) Motifs enriched in increased ATAC-seq peaks against 769 human transcription factors. Top motifs were highlighted and labeled. (H) Top de novo motifs identified from increased ATAC-seq peaks. (I) GSEA revealing an enrichment of C/EBP network genes in MEF2D-knockout cells. (J) Heat map showing fold change of expression of C/EBP family genes upon MEF2D knockout. FC, fold change. (K) Normalized RNA-seq read counts of CEBPE in MOLM-13 cells harboring sgRNAs against Luciferase gene or MEF2D.
MEF2D represses genes involved in the CEBPE-centered myeloid differentiation. (A) Transcriptomic analysis of differentially expressed genes (fold change >1.5 and adjusted p-value <.05) between MEF2D-knockout and control MOLM-13 cells. (B) Gene sets enrichment analysis (GSEA) revealing top enriched gene signatures in upregulated and downregulated genes in MEF2D-knockout MOLM-13 cells. (C) Volcano plot showing fold change and adjusted p-value of gene expression between MEF2D-knockout and control MOLM-13 cells. Differentially expressed genes are marked in blue. (D) Heatmap displaying the ATAC-seq read densities in peaks with increased or decreased chromatin accessibility in MEF2D-knockout MOLM-13 cells, compared with sgLuc control. (E-F) Genomic Regions Enrichment of Annotations Tool annotation of ATAC-seq peaks with increased (E) or decreased (F) chromatin accessibility as identified in panel D. (G) Motifs enriched in increased ATAC-seq peaks against 769 human transcription factors. Top motifs were highlighted and labeled. (H) Top de novo motifs identified from increased ATAC-seq peaks. (I) GSEA revealing an enrichment of C/EBP network genes in MEF2D-knockout cells. (J) Heat map showing fold change of expression of C/EBP family genes upon MEF2D knockout. FC, fold change. (K) Normalized RNA-seq read counts of CEBPE in MOLM-13 cells harboring sgRNAs against Luciferase gene or MEF2D.
To further understand the altered transcription programs upon MEF2D loss, we performed a genome-wide ATAC-seq.43 MEF2D loss led to profound changes in chromatin accessibility, with a gain of 2004 peaks and a loss of 2256 accessible peaks (Figure 4D; supplemental Table 2). Consistent with transcriptomic changes, genomic regions with increased accessibility are enriched in myeloid lineage differentiation pathways (Figure 4E), while regions with reduced accessibility are enriched for genes in various developmental processes and cell adhesion pathways (Figure 4F). These results further support that MEF2D represses myeloid differentiation programs in leukemia cells. To identify key transcriptional regulators responsible for the myeloid differentiation phenotype induced by MEF2D knockout, we performed motif analysis on the regions with increased chromatin accessibility in MEF2D-deficient AML cells. We first scanned a collection of 769 human transcription factors and found that the motifs of C/EBP factors were significantly enriched in the peaks with a gain of ATAC-seq signal (Figure 4G). De novo motif analysis also revealed C/EBP binding sequence as the top enriched motif (P = 10−124, observed/expected = 4.1) (Figure 4H). Similar analysis of the regions with decreased ATAC-seq signal revealed AP-1 and MEF2 binding sequences as top enriched motifs (supplemental Figure 4G-H), indicating a role of MEF2D in gene activation. Consistent with our motif analysis, we observed that the genes regulated by the myeloid C/EBP network were significantly upregulated in MEF2D-knockout leukemia cells (Figure 4I). We next examined the expression of all 6 C/EBP family genes and found that CEBPE was the only C/EBP factor showing significant upregulation when MEF2D is lost (Figure 4J-K). From RNA-seq data, we also observed many known CEBPE target genes, including S100A8, S100A9, BPI, and MSA4A3, were significantly upregulated by MEF2D knockout (Figure 4C). Altogether, our data support that MEF2D actively represses a CEBPE-centered myeloid differentiation program in leukemia cells.
MEF2D binds to the CEBPE enhancer, maintains a repressive chromatin status, and inhibits gene transcription
Next, we examined how MEF2D regulates CEBPE expression. Firstly, we sought to validate that MEF2D negatively regulates CEBPE expression by performing MEF2D knockout in 3 independent MLL-r AML models. We found that CEBPE, together with its target genes, such as S100A8 and S100A9, were significantly increased after MEF2D knockout in all examined AML cells (Figure 5A). Western blot analysis also showed increased CEBPE protein levels in MEF2D-knockout cells (Figure 5B). Next, we performed chromatin immunoprecipitation coupled with sequencing (ChIP-seq) to determine genome-wide MEF2D binding sites in MOLM-13 and MV4-11 cells. MEF2D binding patterns were highly similar between MOLM-13 and MV4-11 cells, and we identified 33 239 peaks with consistent binding in both AML models (Figure 5C; supplemental Table 3). Genomic localization analysis showed ∼31.6% of MEF2D peaks at gene promoters and 68.4% of the peaks at putative distal, intergenic, and intragenic enhancers (Figure 5D). As expected, the MEF2 motif was among the top enriched motifs within the MEF2D peaks (Figure 5E). Importantly, MEF2D peaks were found at the enhancer and promoter regions of CEBPE, and loss of MEF2D caused strong gain of chromatin accessibility specifically at the CEBPE enhancers regions, but not at the CEBPE promoter (Figure 5F). We further validated the binding of MEF2D at CEBPE enhancer regions by chromatin immunoprecipitation followed by quantitative reverse transcription polymerase chain reaction (ChIP-qPCR) (Figure 5G). As MEF2D could act as a transcriptional repressor with histone deacetylase proteins, we hypothesized that MEF2D represses CEBPE expression by removing histone acetylation at CEBPE enhancers. To test this hypothesis, we performed ChIP assay for H3K27ac, a histone mark demarcating active enhancers. We found that depletion of MEF2D led to significantly increased levels of H3K27ac at CEBPE enhancers (Figure 5H). Lastly, we examined independent leukemia gene expression datasets and found that MEF2D shows a strong negative correlation with CEBPE in primary AML samples (Figure 5I-K). Interestingly, MFE2D expression also reversely correlates with CEBPE in ALL patient samples (Figure 5L), indicating that the MEF2D-CEBPE axis may also be present in other leukemia types. Overall, these results demonstrate that MEF2D transcriptionally regulates CEBPE expression in human AML.
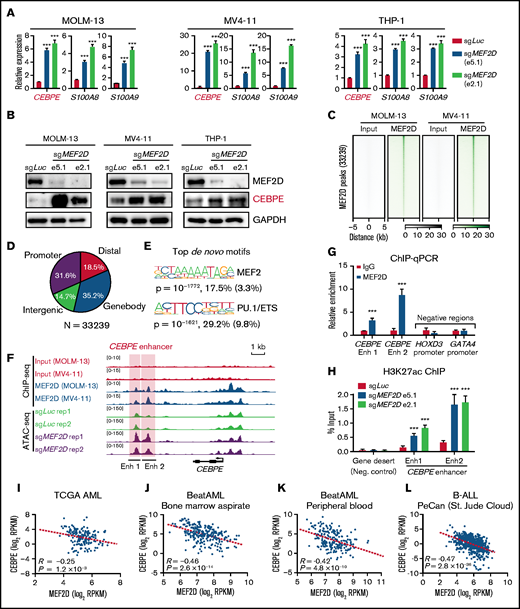
MEF2D directly binds to CEBPE and negatively regulates CEBPE expression and enhancer histone acetylation. (A) Quantitative reverse transcription polymerase chain reaction (RT-qPCR) showing expression of CEBPE and its target genes S100A8 and S100A9 in indicated AML cells with or without MEF2D knockout. (B) Western blot analysis of CEBPE in indicated control and MEF2D knockout AML cells. (C) Heatmap displaying MEF2D ChIP-seq read densities of 33 239 commonly identified from MOLM-13 and MV4-11 cells. (D) Genomic distribution of MEF2D ChIP-seq peaks commonly identified from MOLM-13 and MV4-11 cells. (E) Top de novo motifs identified from MEF2D ChIP-seq peaks. (F) ATAC-seq and MEF2D ChIP-seq profiles at the CEBPE locus in indicated leukemic cells. (G) ChIP-qPCR validating MEF2D binding at CEBPE enhancer regions. (H) ChIP-qPCR showing enrichment of H3K27ac at CEBPE enhancer regions. (I-K) CEBPE and MEF2D expression levels are negatively correlated in human AML patients. (L) CEBPE and MEF2D expression levels are negatively correlated in human B-ALL patients. ***P < .001.
MEF2D directly binds to CEBPE and negatively regulates CEBPE expression and enhancer histone acetylation. (A) Quantitative reverse transcription polymerase chain reaction (RT-qPCR) showing expression of CEBPE and its target genes S100A8 and S100A9 in indicated AML cells with or without MEF2D knockout. (B) Western blot analysis of CEBPE in indicated control and MEF2D knockout AML cells. (C) Heatmap displaying MEF2D ChIP-seq read densities of 33 239 commonly identified from MOLM-13 and MV4-11 cells. (D) Genomic distribution of MEF2D ChIP-seq peaks commonly identified from MOLM-13 and MV4-11 cells. (E) Top de novo motifs identified from MEF2D ChIP-seq peaks. (F) ATAC-seq and MEF2D ChIP-seq profiles at the CEBPE locus in indicated leukemic cells. (G) ChIP-qPCR validating MEF2D binding at CEBPE enhancer regions. (H) ChIP-qPCR showing enrichment of H3K27ac at CEBPE enhancer regions. (I-K) CEBPE and MEF2D expression levels are negatively correlated in human AML patients. (L) CEBPE and MEF2D expression levels are negatively correlated in human B-ALL patients. ***P < .001.
CEBPE is a critical downstream effector of MEF2D in MLL-r AML
To access the functional significance of the MEF2D-CEBPE axis in MLL-r AML, we asked whether depletion of CEBPE could reverse the cellular effects from MEF2D knockout. We established constitutive CEBPE knockout lines in MOLM-13 cells using 2 independent guide RNAs (Figure 6A) and examined the impact of MEF2D depletion on control and CEBPE knockout cell lines. Notably, CEBPE-deficient cells, but not CEBPE-wildtype cells, were more resistant to MEF2D loss, as determined by a competitive proliferation assay (Figure 6B). In addition, depletion of CEBPE could also partially rescue MEF2D knockout-induced growth defects in other MLL-r AML cells, including MV4-11 and THP-1 (supplemental Figure 5A-D). More importantly, CEBPE depletion largely abolished the increased leukemia cell differentiation caused by MEF2D knockout (Figure 6C-E). Lastly, we examined the expression of granulocytic differentiation genes such as S100A8 and S100A9. We found that CEBPE depletion could reverse the activation of S100A8 and S100A9 when MEF2D is lost (Figure 6F-G). These results suggest that MEF2D plays an essential role in repressing hematopoietic differentiation programs, a process heavily relying on the activation of CEBPE.
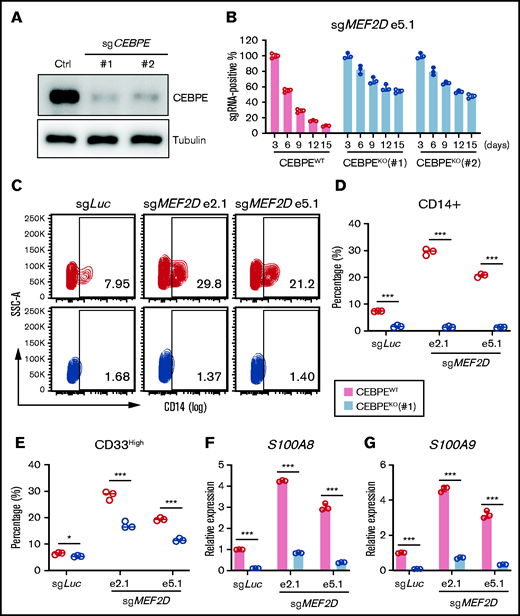
CEBPE depletion can partially rescue phenotypes of MEF2D loss. (A) Western blot analysis demonstrating efficient deletion of CEBPE after stable knockout of CEBPE using 2 independent guide RNAs, relative to empty vector control. (B) Competitive proliferation assay demonstrating CEBPE knockout partially rescues MEF2D loss-induced proliferation defect. MEF2D knockout was performed in CEBPE wildtype (WT) and 2 independent knockout (KO) lines by using sgRNA e5.1 linked with an mCherry reporter. The mCherry positive percentage was monitored every 3 days post infection and normalized to the day 3 measurement. (C) Flow cytometry analysis of myeloid differentiation marker CD14 in CEBPE wildtype and knockout MOLM-13 cells 6 days post MEF2D knockout, relative to transduction of sgLuc non-targeting control. (D-E) Flow cytometry analysis showing frequency of population with high myeloid differentiation markers CD14 (D) and CD33 (E) in CEBPE wildtype and knockout MOLM-13 cells 6 days post MEF2D knockout, relative to transduction of sgLuc non-targeting control. (F-G) RT-qPCR analysis of CEBPE target genes S100A8 (F) and S100A9 (G) in CEBPE wildtype and knockout MOLM-13 cells 6 days post MEF2D knockout, relative to transduction of sgLuc non-targeting control. *P < .05; ***P < .001.
CEBPE depletion can partially rescue phenotypes of MEF2D loss. (A) Western blot analysis demonstrating efficient deletion of CEBPE after stable knockout of CEBPE using 2 independent guide RNAs, relative to empty vector control. (B) Competitive proliferation assay demonstrating CEBPE knockout partially rescues MEF2D loss-induced proliferation defect. MEF2D knockout was performed in CEBPE wildtype (WT) and 2 independent knockout (KO) lines by using sgRNA e5.1 linked with an mCherry reporter. The mCherry positive percentage was monitored every 3 days post infection and normalized to the day 3 measurement. (C) Flow cytometry analysis of myeloid differentiation marker CD14 in CEBPE wildtype and knockout MOLM-13 cells 6 days post MEF2D knockout, relative to transduction of sgLuc non-targeting control. (D-E) Flow cytometry analysis showing frequency of population with high myeloid differentiation markers CD14 (D) and CD33 (E) in CEBPE wildtype and knockout MOLM-13 cells 6 days post MEF2D knockout, relative to transduction of sgLuc non-targeting control. (F-G) RT-qPCR analysis of CEBPE target genes S100A8 (F) and S100A9 (G) in CEBPE wildtype and knockout MOLM-13 cells 6 days post MEF2D knockout, relative to transduction of sgLuc non-targeting control. *P < .05; ***P < .001.
MLL-fusion protein promotes MEF2D expression via HOXA9-mediated gene activation
Lastly, we sought to understand how MEF2D expression is upregulated in MLL-r AML. Previous evidence suggests that MLL-fusion proteins (MLL-FPs) connect MLL to the DOT1L/H3K79me2 methyltransferase complex for target gene activation.4,44,45 We asked whether disruption of MLL-r transcription program by inhibition of DOT1L would affect MEF2D expression. To this end, we treated MOLM-13 cells with DOT1L-specific inhibitor SGC0946,46 which significantly reduced the expression of MLL-FP targets such as HOXA9 (Figure 7A). Interestingly, MEF2D mRNA and protein levels were also downregulated by DOT1L inhibition, with CEBPE expression levels upregulated (Figure 7A-B). Similar results were also observed in other independent MLL-r AML lines MV4-11 and THP-1 (supplemental Figure 6A-D). Consistent with MEF2D gene expression change, DOT1L inhibition led to reduced super-enhancer signal at MEF2D gene, as indicated by the binding of the super-enhancer marker BRD4 (Figure 7C).
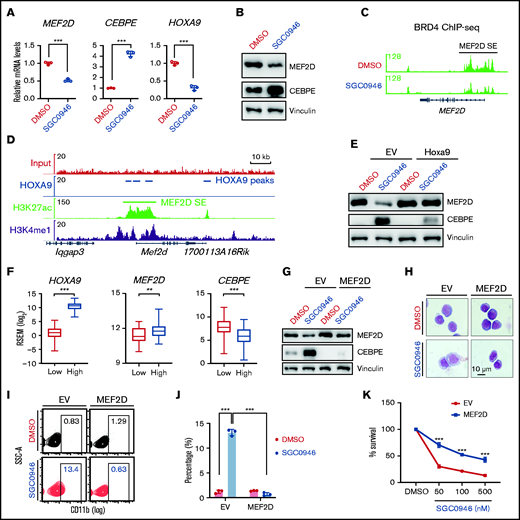
MEF2D is transcriptionally regulated by DOT1L and HOXA9 in MLL-r AML. (A) RT-qPCR analysis of MEF2D, CEBPE, and HOXA9 in MOLM-13 cells post 4-day treatment of 1 µM SGC0946 or dimethyl sulfoxide (DMSO). (B) Western blot analysis of MEF2D and CEBPE protein levels in MOLM-13 cells post 4-day treatment of 1 µM SGC0946 or DMSO. (C) BRD4 ChIP-seq data profile in MV4-11 cells treated with DMSO or 5 µM SGC0946 DMSO (GSE71776). (D) HOXA9, H3K27ac, and H3K4me1 ChIP-seq profile in HOXA9/MEIS1-transformed leukemia cells (GSE103446). (E) Western blot analysis showing MEF2D and CEBPE protein levels in control- or Hoxa9- overexpressed MOLM13 cells post 4-day treatment of 1 µM SGC0946 or DMSO. (F) Relative expression levels of HOXA9, MEF2D, and CEBPE in TCGA AML patient samples with low (n = 41, red) and high (n = 124, blue) HOXA9 expression. Boxplots show medians and interquartile ranges, whiskers represent the lowest and highest observations. Data were analyzed by Mann-Whitney U test. (G) Western blot analysis showing MEF2D and CEBPE protein levels in control- or MEF2D- overexpressed MOLM13 cells post 4-day treatment of 1 µM SGC0946 or DMSO. (H) Wright-Giemsa of control- or MEF2D- overexpressed MOLM-13 cells post 6-day treatment of 1 µM SGC0946 or DMSO. (I-J) Flow cytometry analysis of control- or MEF2D-overexpressed MOLM-13 cells post 6-day treatment of 1 µM SGC0946 or DMSO. (K) Growth of control- or MEF2D-overexpressed MOLM-13 cells post 6-day treatment of DMSO or indicated doses of SGC0946. **P < .01; ***P < .001.
MEF2D is transcriptionally regulated by DOT1L and HOXA9 in MLL-r AML. (A) RT-qPCR analysis of MEF2D, CEBPE, and HOXA9 in MOLM-13 cells post 4-day treatment of 1 µM SGC0946 or dimethyl sulfoxide (DMSO). (B) Western blot analysis of MEF2D and CEBPE protein levels in MOLM-13 cells post 4-day treatment of 1 µM SGC0946 or DMSO. (C) BRD4 ChIP-seq data profile in MV4-11 cells treated with DMSO or 5 µM SGC0946 DMSO (GSE71776). (D) HOXA9, H3K27ac, and H3K4me1 ChIP-seq profile in HOXA9/MEIS1-transformed leukemia cells (GSE103446). (E) Western blot analysis showing MEF2D and CEBPE protein levels in control- or Hoxa9- overexpressed MOLM13 cells post 4-day treatment of 1 µM SGC0946 or DMSO. (F) Relative expression levels of HOXA9, MEF2D, and CEBPE in TCGA AML patient samples with low (n = 41, red) and high (n = 124, blue) HOXA9 expression. Boxplots show medians and interquartile ranges, whiskers represent the lowest and highest observations. Data were analyzed by Mann-Whitney U test. (G) Western blot analysis showing MEF2D and CEBPE protein levels in control- or MEF2D- overexpressed MOLM13 cells post 4-day treatment of 1 µM SGC0946 or DMSO. (H) Wright-Giemsa of control- or MEF2D- overexpressed MOLM-13 cells post 6-day treatment of 1 µM SGC0946 or DMSO. (I-J) Flow cytometry analysis of control- or MEF2D-overexpressed MOLM-13 cells post 6-day treatment of 1 µM SGC0946 or DMSO. (K) Growth of control- or MEF2D-overexpressed MOLM-13 cells post 6-day treatment of DMSO or indicated doses of SGC0946. **P < .01; ***P < .001.
We then examined whether MEF2D is a direct target of MLL-FP by analyzing previously reported MLL-FP ChIP-seq datasets.4 While the MLL-AF9 fusion protein binds to its known targets such as HOX-A cluster genes and MEIS1, no significant binding signal was detected at MEF2D gene locus including its super-enhancer region (supplemental Figure 6C-E), suggesting that MEF2D may be indirectly regulated by MLL-FP. HOXA9 is a key target of MLL-FP and an important regulator of AML cell self-renewal.47 Considering the high expression levels of MEF2D in MLL-r AML (Figure 1B-E), we asked whether MEF2D is indirectly upregulated by MLL targets such as HOXA9. Previous Hoxa9 ChIP-seq in Hoxa9/Meis1-transformed murine leukemia cells suggests potential Hoxa9 binding at Mef2d super-enhancer regions (Figure 7D). Interestingly, analysis of a published microarray dataset48 revealed that knockdown of HOXA9 led to reduced MEF2D expression in MOLM-14 human MLL-AF9 AML cells (supplemental Figure 6F). In a nascent RNA-seq dataset from a tamoxifen-inducible HoxA9-ER leukemia cell line,49 Mef2d mRNA levels also showed rapid downregulation following Hoxa9 inactivation (supplemental Figure 6G). Moreover, ectopic expression of murine Hoxa9 completely restored MEF2D levels in DOT1L inhibitor-treated AML cells, and also blocked the upregulation of CEBPE (Figure 7E; supplemental Figure 6H). In AML patients, MEF2D expression levels were significantly higher in AMLs with high HOXA9 expression, while CEBPE levels were significantly reduced (Figure 7F; supplemental Figure 6I-J). These results support HOXA9 as a positive regulator of MEF2D in leukemia cells.
Finally, we accessed the functional significance of MEF2D inhibition in DOT1L-mediated antileukemia effects. We constitutively expressed MEF2D in MOLM-13 AML cells to restore MEF2D expression levels following DOT1L inhibition (Figure 7G). Overexpression of MEF2D not only suppressed basal CEBPE expression levels but also blocked the upregulation of CEBPE induced by DOT1L inactivation (Figure 7G). Consistent with the rescue effect on CEBPE expression, sustained MEF2D levels also reversed DOT1L inhibitor-induced myeloid differentiation and induced significant resistance to DOT1L inhibition (Figure 7H-K). Together, these data suggest that downregulation of MEF2D is an important mechanism for DOT1L inhibitor-triggered antileukemia effects.
Discussion
CEBPE has been known as a master regulator of myeloid cell development.23-26 The expression of CEBPE is suppressed in MLL-r AML and strongly predicts disease outcome.28 However, little is known about how CEBPE is dynamically regulated in normal and malignant hematopoiesis. Previous work has identified an enhancer located several kilobases downstream of CEBPE and depletion of this enhancer led to reduced CEBPE expression.30 Our study shows that MEF2D is a novel transcriptional regulator of CEBPE and the MEF2D-CEBPE axis plays an important role in MLL-r AML. Interestingly, in both human AML and B-ALL samples, we also observed a strong negative correlation between MEF2D and CEBPE expression. It would be interesting to investigate whether MEF2D regulates CEBPE expression in normal hematopoiesis and other leukemia contexts. On the other hand, as depletion of CEBPE could only partially rescue MEF2D loss-induced effects, other MEF2D targets might mediate the pro-leukemia function of MEF2D. Indeed, our ChIP-seq and RNA-seq data indicate that MEF2D can bind to and activate genes such as FLT3 and TRIB1, which were previously reported as oncogenic factors in AML development.50,51 These genes may also be crucial for MEF2D-mediated AML progression.
Previous studies have shown that MEF2C is a critical target of MLL-fusion proteins and plays an essential role in leukemia development.52 MEF2 proteins have both overlapping and divergent functions in many development processes. For example, during muscle regeneration upon injury, deletion of individual Mef2a, Mef2c, or Mef2d genes in satellite cells does not affect muscle regeneration, while muscle regeneration is completely abolished when the 3 genes are deleted in combination.53 Similarly, both Mef2c and Mef2d are activated in early B-cell development; however, knockout of either single gene does not cause abnormality, while significant B-cell development defect can be only identified in Mef2c/d double knockout mice.16 Our data and previous studies on MEF2C collectively suggest that both MEF2C and MEF2D are required for MLL-r AML progression, as depletion of either factor causes profound defects in leukemia development. It is possible that MEF2C and MEF2D regulate different sets of target genes to promote leukemia development. As MEF2 proteins form homo- and heterodimers that constitutively bind to response elements,54 another possible explanation is that MEF2C and MEF2D proteins form heterodimers to achieve maximal protein stability and/or transcriptional activity in MLL-r AML. Whether and how MEF2D and MEF2C crosstalk with each other in MLL-r AML represents an interesting area of future investigation.
We also show that the MLL-FP target HOXA9 binds to MEF2D super-enhancer and contributes to MEF2D gene activation. Because super-enhancers are often enriched with binding of multiple tissue-specific transcription factors, it is likely that there are other transcription factors activating MEF2D gene expression. Our results also demonstrate that aberrant MEF2D expression can be suppressed by DOT1L inhibition, possibly through downregulation of HOXA9. Importantly, enforced MEF2D expression could block DOT1L inhibitor-caused antileukemia effects such as growth defect and myeloid differentiation. Therefore, our data support that downregulation of MEF2D is an important mechanism underlying DOT1L inhibitor-mediated therapeutic effects in MLL-r AML.
Altogether, our study has shown that highly expressed MEF2D in MLL-r leukemias is linked to a suppressed CEBPE pathway, thereby causing aberrant self-renewal and differentiation blockage. This new knowledge provides a possibility that disrupting the MEF2D-CEBPE regulatory axis might serve as a therapeutic strategy for AML patients. Although our study was focused on MLL-r AML where MEF2D is highly expressed, our data indicated MEF2D could be equally crucial in specific non-MLL-r AML or ALL cases with MEF2D overexpression. The concept generated here may have broader implications in other leukemia subtypes.
Acknowledgments
The authors gratefully thank Christopher Vakoc and Charles Mullighan for providing Cas9-experssing leukemia cells and the MEF2D cDNA, respectively. They acknowledge the support of core facilities at the University of Alabama at Birmingham, including Comprehensive Flow Cytometry Core, Animal Resources Program, Small Animal Imaging Facility, and Research Computing facility. The authors thank the Lu laboratory members for their critical comments and discussion. R.L. is a recipient of the American Society of Hematology Scholar Award. This work was supported in part by Leukemia Research Foundation (to R.L.), Concern Foundation (to R.L.), Young Supporters Board of the O’Neal Comprehensive Cancer Center (to R.L.), Institutional Research Grant number IRG15-59-IRG from the American Cancer Society (to R.L.), and NIH R01HL153220 (to Y.Z.).
Authorship
Contribution: L.Z., P.Z., X.Z., and H.Z. performed the experiments and analyzed the data; P.M.G., D.Z., and R.L. analyzed the deep sequencing data; S.Q. and R.B. assisted with human sample collection; S.A., Y.Z., C.L., D.Z., R.B., and R.L. interpreted the data; R.L. conceived the study, supervised the work, and designed the research; L.Z. and R.L. wrote the manuscript with input from all other authors.
Conflict-of-interest disclosure: The authors declare no competing financial interests.
Correspondence: Rui Lu, University of Alabama at Birmingham, 1824 6th Ave S WTI 510G, Birmingham, AL 35294; e-mail: ruilu1@uabmc.edu.

