

Key Points
Index case of nivolumab response associated with altered circulating T-cell composition and heterogeneous PD-L1 expression on AML blasts.
Single-cell approaches provide complementary insight into cellular mechanisms of response and resistance to transplant/checkpoint blockade.

Abstract
Relapse of myeloproliferative neoplasms (MPNs) after allogeneic hematopoietic stem cell transplantation (HSCT) is associated with poor outcomes, as therapeutic approaches to reinstate effective graft-versus-leukemia (GVL) responses remain suboptimal. Immune escape through overexpression of PD-L1 in JAK2V617F-mutated MPN provides a rationale for therapeutic PD-1 blockade, and indeed, clinical activity of nivolumab in relapsed MPN post-HSCT has been observed. Elucidation of the features of response following PD-1 blockade in such patients could inform novel therapeutic concepts that enhance GVL. Here, we report an integrated high-dimensional analysis using single-cell RNA sequencing, T-cell receptor sequencing, cellular indexing of transcriptomes and epitopes by sequencing (CITE-seq), and assay for transposase-accessible chromatin using sequencing (scATAC-seq), together with mass cytometry, in peripheral blood mononuclear cells collected at 6 timepoints before, during, and after transient response to PD-1 blockade from an index case of relapsed MPN following HSCT. Before nivolumab infusion, acute myeloid leukemia (AML) blasts demonstrated high expression of chemokines, and T cells were characterized by expression of interferon-response genes. This baseline inflammatory signature disappeared after nivolumab infusion. Clinical response was characterized by transient expansion of a polyclonal CD4+ T-cell population and contraction of an AML subpopulation that exhibited megakaryocytic features and elevated PD-L1 expression. At relapse, the proportion of the AML subpopulation with progenitor-like features progressively increased, suggesting coevolution of AML blasts and donor-derived T cells. We thus demonstrate how single-cell technologies can provide complementary insight into cellular mechanisms underlying response to PD-1 blockade, motivating future longitudinal high-dimensional single-cell studies of GVL responses in relapsed myeloid disease.
Introduction
Relapsed myeloproliferative neoplasms after allogeneic hematopoietic stem cell transplantation (HSCT) have dismal prognosis, and novel therapeutic options are urgently needed.1 Immunotherapies that reinstate the graft-versus-leukemia (GVL) effect may be efficacious in this setting.2 Indeed, the observed overexpression of PD-L1 in JAK2V617F+ mutated acute myeloid leukemia (AML) provided an immunologic basis for use of off-label PD-1 blockade in an index case of relapsed JAK2V617F+ secondary AML post-HSCT who experienced transient response but acquired subsequent resistance.3 While the sensitivity to PD-1 blockade is uncommon among myeloid malignancies,4 the course of this patient afforded an opportunity to deeply examine the coevolving kinetics of heterogeneous leukemic and immune cell populations after therapy.
Various DNA-, RNA- and protein-based single-cell technologies now allow multidimensional phenotypic characterization of cell populations that promise to provide orthogonal insight into cell identities and states.5 To leverage their complementary strengths, we performed an integrated single-cell analysis of the cellular populations in serial samples collected from the patient described above to elucidate the molecular and cellular determinants of these distinct clinical outcomes of AML to PD-1 blockade following HSCT.
Methods
Additional methods are described in the supplemental Appendix.
Biospecimen collection
Peripheral blood samples were collected at the University Medical Center in Freiburg, Germany3 and procured under the local institutional review board–approved protocol. Written informed consent was obtained before sample collection. Peripheral blood mononuclear cells (PBMCs) were isolated by Ficoll-Hypaque density gradient centrifugation and stored in vapor-phase liquid nitrogen after cryopreservation with 10% dimethyl sulfoxide until analysis.
Mass cytometry
Cytometry by time of flight (CyTOF) was performed using a 35-antibody panel (supplemental Table 1) on a Fluidigm Helios Mass Cytometer as previously described.6
Single-cell RNA, CITE, TCR, and ATAC sequencing
Single-cell 5' transcriptome/cellular indexing of transcriptomes and epitopes by sequencing (CITE)/T-cell receptor (TCR) and chromatin profiles were obtained using the Chromium Single Cell Immune and Chromium Single Cell assay for transposase-accessible chromatin using sequencing (ATAC-seq) platforms (10x Genomics) according to manufacturer’s instructions.
Data annotation and clustering
Annotation of single-cell RNA sequencing (scRNA-seq) clusters of AML blasts, T cells, B cells, monocytes, erythrocytes, and megakaryocytes was performed based on canonical marker expression,7,8 and labels were transferred onto single-cell ATAC-seq (scATAC-seq) data (supplemental Figure 1A-F). T-cell clusters (scRNA-seq) were identified using an overclustering strategy with FindClusters and a resolution of 2.5 with subsequent manual annotation based on CITE-seq expression of canonical markers.7 CyTOF data were manually gated for the longitudinal analysis of AML blasts (CD45lo CD34+), T cells (CD45hi CD3+), and regulatory T cells (CD127lo CD25+) over time, expression of CD69 and PD-L1 on AML blasts, and export of T-cell data (FlowJo 10.7.1). Exported T-cell data were clustered and annotated using CATALYST.9
Results and discussion
The patient relapsed with JAK2V617F+ secondary AML post-HSCT following polycythemia vera and progressed on multiple salvage therapies (ruxolitinib, hydroxyurea, and decitabine) before treatment with the anti-PD-1 antibody nivolumab.3 We collected serial peripheral blood samples before nivolumab infusion, at time of response (C2D1, C4D1), at relapse, at unsuccessful re-exposure to nivolumab (C6D1), and at progression. To dissect the cellular mechanisms underlying this clinical course at high-resolution, we performed a multidimensional, single-cell analysis on this longitudinal sample cohort (Figure 1A). In total, we obtained 27 777 single-cell transcriptomes (scRNA-seq with CITE-seq and TCR sequencing), 28 713 chromatin profiles (scATAC-seq), and measured surface marker expression on 677 322 cells (CyTOF). All 3 data modalities demonstrated transient reduction of AML blasts and parallel increase of T cells at the time of response (Figure 1B), mirroring flow cytometric measurements.3
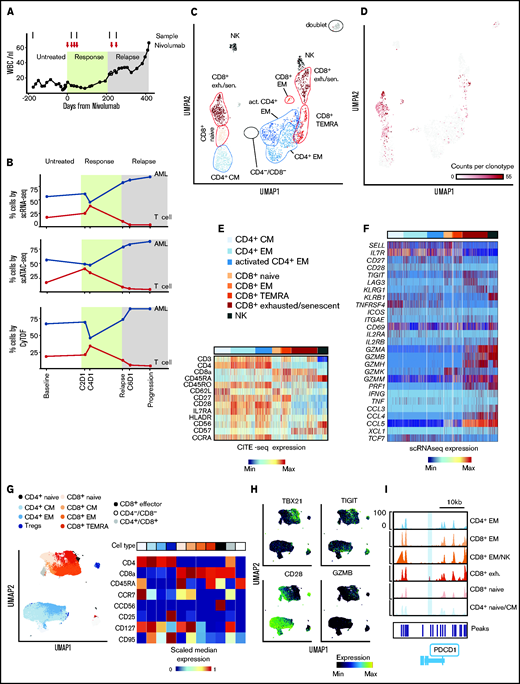
Annotation of T-cell subclusters across different single-cell technologies. (A) Clinical course showing white blood cell (WBC) count per nanoliter with transient partial response to nivolumab (C2D1, C4D1) and subsequent disease progression with unsuccessful re-exposure to nivolumab (relapse, C6D1, and progression). (B) Percentage of AML and T cells in peripheral blood quantified with scRNA-seq (27 777 cells), scATAC-seq (28 713 cells), and CyTOF (677 322 cells). (C) UMAP representation and clustering (scRNA-seq) of T/NK cells (n = 2711). Annotation of clusters based on surface marker expression (E) and single-cell gene expression (F). (D) Clonal expansion of T cells defined as number of T cells with the same clonotype based on identical complementarity defining region 3β (CDR3β) sequence. Gray indicates no CDR3β sequence detected. (E-F) Surface marker expression obtained through CITE-seq (E) and single-cell gene expression (F) of single T/NK cells across clusters. (G) UMAP representation and clustering of T cells (CyTOF) based on protein expression of lineage-defining surface markers. The heatmap shows the median expression of markers used for cluster annotation. (H) Protein expression of TBX21, TIGIT, CD28, and GZMB on T cells (CyTOF). (I) Chromatin accessibility of PDCD1 gene (encoding PD-1 protein) across T-cell subpopulations defined by scATAC-seq (supplemental Figure 1I). exh., exhausted; sen., senescent; CM, central memory; EM, effector memory; TEMRA, effector memory T cell re-expressing CD45RA.
Annotation of T-cell subclusters across different single-cell technologies. (A) Clinical course showing white blood cell (WBC) count per nanoliter with transient partial response to nivolumab (C2D1, C4D1) and subsequent disease progression with unsuccessful re-exposure to nivolumab (relapse, C6D1, and progression). (B) Percentage of AML and T cells in peripheral blood quantified with scRNA-seq (27 777 cells), scATAC-seq (28 713 cells), and CyTOF (677 322 cells). (C) UMAP representation and clustering (scRNA-seq) of T/NK cells (n = 2711). Annotation of clusters based on surface marker expression (E) and single-cell gene expression (F). (D) Clonal expansion of T cells defined as number of T cells with the same clonotype based on identical complementarity defining region 3β (CDR3β) sequence. Gray indicates no CDR3β sequence detected. (E-F) Surface marker expression obtained through CITE-seq (E) and single-cell gene expression (F) of single T/NK cells across clusters. (G) UMAP representation and clustering of T cells (CyTOF) based on protein expression of lineage-defining surface markers. The heatmap shows the median expression of markers used for cluster annotation. (H) Protein expression of TBX21, TIGIT, CD28, and GZMB on T cells (CyTOF). (I) Chromatin accessibility of PDCD1 gene (encoding PD-1 protein) across T-cell subpopulations defined by scATAC-seq (supplemental Figure 1I). exh., exhausted; sen., senescent; CM, central memory; EM, effector memory; TEMRA, effector memory T cell re-expressing CD45RA.
Identification and annotation of T-cell subpopulations
Within the T-cell/natural killer (NK)-cell compartment, scRNA-seq (n = 2711) distinguished CD4+ and CD8+ naive, memory, and exhausted/senescent T-cell populations (Figure 1C), and single-cell TCR sequencing analysis identified expanded clonotypes (Figure 1D). This annotation was based on surface markers quantified using CITE-seq (Figure 1E) and single-cell gene expression (Figure 1F). On CITE-seq, NK cells were characterized as CD3− and CD56+. Annotation of naive and memory T-cell populations was based on surface expression of CD3, CD4, CD8, CD62L, and CD45RA/R0. Activated memory CD4+ T cells had the highest expression of HLA-DR and CCR4, consistent with Th2 polarization.10 CD8+ T cells in the exhaustion/senescent cluster demonstrated features of both exhaustion (high gene module scores based on genes linked to T-cell exhaustion; supplemental Figure 1G; high gene expression of TIGIT, LAG3, granzymes, and chemokines; and downregulation of IL7RA and CD28) and senescence (ie, upregulation of KLRG1 and CD57) (Figure 1E-F).
Clonal T-cell expansion was mainly observed within CD8+ T cells and most pronounced in the CD8+ exhausted T-cell cluster (Figure 1D), consistent with previous reports of tumor-infiltrating CD8+ T cells.11,12 Using CyTOF, similar naive and memory T-cell clusters were identified in CD3+ cells (n = 85 574) based on expression of CD4, CD8, CCR7, CD45RA, CD95, and CD127 (Figure 1G-H; supplemental Figure 1H). The 30-fold higher number of T cells analyzed with CyTOF provided higher resolution and allowed the ability to discern additional phenotypes, such as CD4+ naive, CD8+ central memory, a small population of CD8+ CD56+ effector T cells and a distinct cluster of regulatory T cells (CD127lo CD25+). In agreement with scRNA-seq, most CD8+ T cells exhibited a terminally differentiated effector phenotype (expression of TBX21, GZMB, and TIGIT; downregulation of CD28) (Figure 1H).
T-cell subpopulations based on scATAC-seq (n = 4962) were least defined and mainly permitted the ability to distinguish CD4+ and CD8+ naive and memory T-cell clusters as well as an exhausted CD8+ T-cell cluster. T cells in the CD8+ exhausted cluster showed a chromatin accessibility profile notable for a known exhaustion-associated peak within the PDCD1 gene as well as greater accessibility of TBX21 and EOMES transcription factor motifs and, similar to scRNA-seq, high gene activity scores of the granzyme XCL2 or TIGIT (Figure 1I; supplemental Figure 1I-K).13
In sum, using 3 different single-cell technologies, T-cell subpopulations could be reproducibly identified. While CyTOF was able to analyze the highest number of single cells and therefore provided the most granular definition of T-cell clusters, information on cell states defined by scRNA-seq was most detailed at the level of individual single cells and additionally provided information on TCR sequences and surface marker expression.
Response is driven by expansion of polyclonal CD4+ T cells
Having annotated the various T-cell states, we then studied their individual kinetics. By scRNA-seq, the increase of T cells at response was driven by an increase in nonexhausted memory CD4+ T cells of diverse clonotypes that decreased upon disease relapse (Figure 2A, left). Conversely, the proportion of exhausted/senescent CD8+ T cells diminished at response and then increased at relapse. With CyTOF and scATAC-seq, we confirmed the increase of CD4+ memory T cells at response and their contraction during disease progression (Figure 2A, right; supplemental Figure 1K). Unbiased clustering of CyTOF T-cell data further indicated that changes in clinical condition were marked by distinct T-cell states (Figure 2B), likely driven by the proportional shifts of T-cell subsets. For example, regulatory T cells increased within the CD4+ T-cell compartment at the time of progression, which we were able to also confirm with manual gating (Figure 2C).
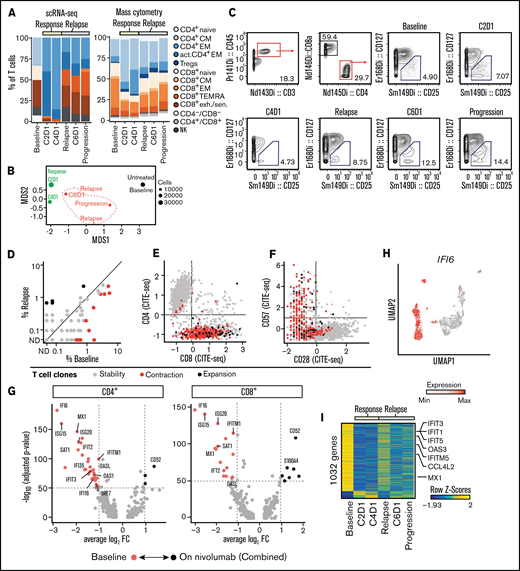
Expansion of CD4+ T cells at time of response to PD-1 blockade. (A) Relative abundance of T-cell clusters defined by scRNA-seq (Figure 1C) and cytometry by time-of-flight (CyTOF) (Fig. 1G) at transient partial response to nivolumab (C2D1, C4D1) and subsequent disease progression with unsuccessful re-exposure to nivolumab (relapse, C6D1, and progression). (B) Multidimensional scaling (MDS) plot of T cells based on marker expression (CyTOF). The size of the dots indicates the number of T cells per sample. Black indicates sampling before nivolumab; green, sampling at time of transient response; red, sampling at time of relapse. (C) Quantification of regulatory T cells using CyTOF and manual gating. (D) Abundance of clonally expanded T-cell clonotypes relative to all detected T-cell clonotypes before nivolumab (%Baseline) and at relapse (relapse, C6D1, and progression). T-cell clonotypes are defined by identical complementarity defining region 3β (CDR3β) sequence. Statistical testing using Fisher’s exact test (P < .05). Gray indicates unchanged abundance; red, lower abundance at relapse; black, higher abundance at relapse; ND, not detected. (E-F) Expression of CD8, CD28, and CD57 on T cells quantified using CITE-seq. Coloring indicates whether cells belong to clonotypes that were stable (gray), contracted (red), or expanded (black) in (D). (G-H) Differentially expressed genes in T cells before and after nivolumab treatment based on scRNA-seq. Expression of IFI6 on single T cells (H) mapped to UMAP representation (Figure 1C). (I) Differential gene activity scores calculated from scATAC-seq of T cells. FC, fold change.
Expansion of CD4+ T cells at time of response to PD-1 blockade. (A) Relative abundance of T-cell clusters defined by scRNA-seq (Figure 1C) and cytometry by time-of-flight (CyTOF) (Fig. 1G) at transient partial response to nivolumab (C2D1, C4D1) and subsequent disease progression with unsuccessful re-exposure to nivolumab (relapse, C6D1, and progression). (B) Multidimensional scaling (MDS) plot of T cells based on marker expression (CyTOF). The size of the dots indicates the number of T cells per sample. Black indicates sampling before nivolumab; green, sampling at time of transient response; red, sampling at time of relapse. (C) Quantification of regulatory T cells using CyTOF and manual gating. (D) Abundance of clonally expanded T-cell clonotypes relative to all detected T-cell clonotypes before nivolumab (%Baseline) and at relapse (relapse, C6D1, and progression). T-cell clonotypes are defined by identical complementarity defining region 3β (CDR3β) sequence. Statistical testing using Fisher’s exact test (P < .05). Gray indicates unchanged abundance; red, lower abundance at relapse; black, higher abundance at relapse; ND, not detected. (E-F) Expression of CD8, CD28, and CD57 on T cells quantified using CITE-seq. Coloring indicates whether cells belong to clonotypes that were stable (gray), contracted (red), or expanded (black) in (D). (G-H) Differentially expressed genes in T cells before and after nivolumab treatment based on scRNA-seq. Expression of IFI6 on single T cells (H) mapped to UMAP representation (Figure 1C). (I) Differential gene activity scores calculated from scATAC-seq of T cells. FC, fold change.
To determine whether PD-1 blockade led to changes in the TCR repertoire of clonally expanded T cells, we compared the abundance of T-cell clones defined by CDR3β sequences before PD-1 blockade and after relapse. Among 1679 clonotypes, we detected 11 clonotypes with decreased and 4 clonotypes with increased abundance (P < .05; Fisher’s exact test) (Figure 2D). The phenotype of these dynamic clonotypes was CD8+ CD28− CD57+ (Figure 2E-F) and reflects the fact that we obtained most TCR sequences from this T-cell population.
In addition to changes in T-cell subsets and the TCR repertoire, we measured differences in gene expression using scRNA-seq. Notably, in both CD4+ and CD8+ T cells, the greatest difference in gene expression manifested as increased interferon (IFN)-response genes before PD-1 blockade, suggesting a baseline inflammatory state (Figure 2G; supplemental Tables 3 and 4). This gene signature drove the separation of the uniform manifold approximation and projection (UMAP) representation of T cells as exemplified by expression of IFI6 (Figure 2H). Analysis of gene activity scores calculated from single T-cell ATAC-seq profiles confirmed this high baseline expression of IFN-response genes (Figure 2I).
Taken together, response to PD-1 blockade was associated with a transient expansion of polyclonal CD4+ memory T cells. Furthermore, gene expression of T cells before nivolumab infusion was characterized by high expression of IFN-response genes, which disappeared after PD-1 blockade.
Evolution of AML blasts in response to PD-1 blockade
Differential gene expression analysis in AML blasts using both scATAC-seq and scRNA-seq revealed baseline enrichment of pathways involving interleukin-8 (IL-8) (CXCL1, CXCL2, CXCL3, CXCL6, CXCL8), IFN-γ (CXCL10, CCL20, STAT1, JAK1, IFNGR2), IL-11 (IL-11), and IL-6 (CCL2) (Figure 3A-B; supplemental Figure 2A-B). This chromatin-based and transcriptional evidence of broad, proinflammatory baseline activity is consistent with chronic IFN signaling, which can contribute to the establishment of the exhausted state before anti-PD-1 therapy through increased PD-L1 expression.3,14 The baseline inflammatory state was also detectable with CyTOF through upregulated CD69 expression on AML blasts (supplemental Figure 2C), a known consequence of increased IFN-γ signaling.15
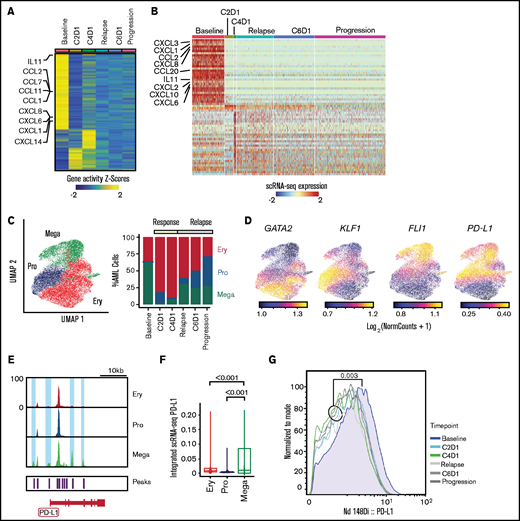
Evolution of AML blasts following PD-1 blockade. (A-B) Differentially expressed genes in AML blasts calculated from imputed gene activity scores based on scATAC-seq (A) or from gene expression obtained through scRNA-seq (B). Timepoints include transient partial response to nivolumab (C2D1, C4D1) and subsequent disease progression with unsuccessful re-exposure to nivolumab (relapse, C6D1, and progression). (C) UMAP representation and clustering (scATAC-seq) of AML cells (n = 20 148) with progenitor-like (Pro), megakaryocytic (Mega), and erythroid (Ery) features and relative abundance of clusters over the clinical course. (D) Imputed gene activity scores of GATA2, KLF1, FLI1, and PD-L1 from scATAC-seq data used for annotation of AML cell clusters (C). (E) Chromatin accessibility of CD274 gene (encoding PD-L1 protein) across AML subclusters. (F) PD-L1 expression projected from scRNA-seq data onto scATAC-seq AML subclusters. Statistical testing using Wilcoxon rank sum test. (G) Expression of PD-L1 on AML blasts measured with CyTOF at different timepoints.
Evolution of AML blasts following PD-1 blockade. (A-B) Differentially expressed genes in AML blasts calculated from imputed gene activity scores based on scATAC-seq (A) or from gene expression obtained through scRNA-seq (B). Timepoints include transient partial response to nivolumab (C2D1, C4D1) and subsequent disease progression with unsuccessful re-exposure to nivolumab (relapse, C6D1, and progression). (C) UMAP representation and clustering (scATAC-seq) of AML cells (n = 20 148) with progenitor-like (Pro), megakaryocytic (Mega), and erythroid (Ery) features and relative abundance of clusters over the clinical course. (D) Imputed gene activity scores of GATA2, KLF1, FLI1, and PD-L1 from scATAC-seq data used for annotation of AML cell clusters (C). (E) Chromatin accessibility of CD274 gene (encoding PD-L1 protein) across AML subclusters. (F) PD-L1 expression projected from scRNA-seq data onto scATAC-seq AML subclusters. Statistical testing using Wilcoxon rank sum test. (G) Expression of PD-L1 on AML blasts measured with CyTOF at different timepoints.
To interrogate longitudinal compositional changes in AML blasts, we identified 3 AML subsets marked by gene activity scores of characteristic transcription factors: a megakaryocyte-like subpopulation expressing FLI1 (Mega), a progenitor-like subpopulation with expression of TAL1 and GATA2 (Pro), and an erythrocyte-like population expressing KLF1 (Ery) (Figure 3C-D; supplemental Figure 2D), similar to previous scRNA-seq–defined cell populations.16
At response, the most notable changes were contraction of the Mega cluster and expansion of the Ery cluster. After relapse, the Pro cluster progressively expanded (Figure 3C). We hypothesized that this kinetics may have been driven by immune evasive or suppressive mechanisms. Although downregulation of HLA class II has been reported to contribute to leukemic immune evasion after HSCT,17-19 we did not detect differences in HLA expression after PD-1 blockade (supplemental Figure 2E). To address suppressive mechanisms, we examined the CD274 gene (encoding PD-L1) given its recently described regulation by the JAK2 gene.3 Notably, 2 chromatin peaks within CD274 and 2 peaks in its promoter region were only observed in the Mega subpopulation (Figure 3E). Furthermore, integration of scRNA-seq data into scATAC-seq space showed the highest expression of PD-L1 in the Mega cluster, consistent with the finding in JAK2V617F+ myeloproliferative neoplasms that thrombocytes have high PD-L1 expression3 (Figure 3F). Finally, CyTOF showed that while expression of PD-L1 on AML blasts was generally low, it was highest at baseline compared with any timepoint after nivolumab therapy (Figure 3G), confirming these results to be detectable at the level of DNA accessibility, RNA, and protein expression.
Discussion
Novel approaches to reinvigorate GVL responses through immunomodulation are urgently needed to overcome the poor prognosis in relapsed myeloid disease following HSCT. Immune checkpoint blockade using CTLA-4 or PD-1 blocking antibodies has shown clinical activity in this setting. Examples include durable responses in relapsed extramedullary AML following ipilimumab or remissions after nivolumab infusion.4,20 However, response rates are generally low, and more insight into the exact mechanisms underlying clinical activity is needed. Recent work suggests that PD-L1 overexpression in JAK2V617F+-mutated MPN may be a mechanism that could be targeted using PD-1 blockade.3 Here, we used 3 different single-cell technologies to deeply interrogate serially collected peripheral blood samples from a patient with relapsed JAK2V617F+ secondary AML post-HSCT who experienced transient response to nivolumab in order to generate novel hypotheses for research on PD-1 blockade and GVL.
Single-cell technologies are able to provide unprecedented resolution into cellular mechanisms and expression profiles. While still very costly, this wealth of information can serve as the basis for hypothesis generation from selected clinical cases or experiments, followed up with more focused analyses on larger numbers of samples.21 These technologies have their individual strengths and caveats. For example, mass cytometry allows for high-dimensional phenotyping with comparatively low cost per cell of hundreds of thousands of cells but is restricted to antibody panels that measure expression of fewer than 100 analytes. scATAC-seq and scRNA-seq technologies give insight into thousands of features per individual cell and are increasingly combined with additional modalities such as surface marker expression (CITE-seq) or TCR and B-cell receptor sequencing,22 potentially providing almost-complete profiles of the genetics, transcriptional state, and protein expression of individual cells. Nevertheless, the costs of single-cell sequencing are considerable, and current technologies are limited to thousands of cells, rendering analysis of rare cell populations such as antigen-specific T cells challenging. For example, due to the sparse nature of single-cell sequencing data and the lower number of T-cell profiles obtained, smaller cell populations such as regulatory T cells were not clearly identifiable with scRNA-seq or scATAC-seq but formed a distinct cluster on CyTOF. A potential approach to overcome this limitation is the annotation of single-cell profiles using larger reference datasets, enabling the annotation of small subpopulations with few events.23 At the same time, the current pace of technological development suggests a significantly increased throughput for single-cell sequencing in the next years that may alleviate this problem.
Using CyTOF, scRNA-seq, and scATAC-seq, we showcase that DNA-, RNA-, and protein-based single-cell technologies can provide overlapping cell definitions and orthogonal insights into immune responses. While our study precludes generalization, these results highlight 2 important themes. First, all 3 technologies showed that the transient expansion of T cells was driven by CD4+ memory T cells, suggesting their involvement in mediating response. Indeed, studies have linked CD4+ T-cell frequencies to clinical benefit from PD-1 pathway blockade in AML/MDS and lung cancer,24,25 and effective use of CD8-depleted donor lymphocyte infusions (“CD4+ DLI”) attests to the clinical potency of GVL-inducing CD4+ T cells.26,27 Thus, understanding the mechanistic role CD4+ T cells play in mediating anti-leukemic responses to checkpoint blockade may elucidate therapeutic strategies to ensure durable remissions.
Second, both scATAC-seq and scRNA-seq detected high baseline T-cell expression of IFN-response genes that was no longer detectable after PD-1 blockade and was mirrored by a unique baseline chemokine signature in AML blasts evident on all 3 technologies. Importantly, the composition of AML blasts evolved over time. Using scATAC-seq, we saw that AML blasts with megakaryocytic features and higher PD-L1 expression contracted after PD-1 blockade and were outgrown by AML populations with erythroid-like and progenitor-like features. Multiple studies in both solid and hematologic malignancies have reported the role of IFN signaling in mediating resistance to checkpoint blockade,28 and upregulation of PD-L1 expression through IFN-γ signaling is a known resistance mechanism in AML.14 Our data implicate this pathway as a harbinger of adaptive resistance and highlight the importance of defining the distribution of PD-L1 expression across all leukemic cells, especially for current clinical trials investigating PD-1 blockade in relapsed myeloid disease. In addition, IFN signaling expression should be evaluated as a predictive marker of transient response and a potential disease modifier.
Altogether, these findings provide a blueprint for how complementary, high-dimensional approaches can elucidate coevolving features of leukemia and immune cells after immunotherapy, and such aspects should be explored in future studies.
Acknowledgments
The authors are grateful for support from the Longwood Medical Area CyTOF Core and the Dana-Farber Cancer Institute Center for Immuno-Oncology. The authors thank Srinika Ranasinghe for coordination of Center for Immuno-Oncology research operations, Nicoletta Cieri for expert advice on analysis of T-cell phenotypes, and Emma S. Hathaway and Matthew Nazzaro for excellent technical assistance with CyTOF experiments. The authors thank the members of the Wu laboratory for helpful discussions and suggestions.
This work was supported by the National Cancer Institute (NCI) of the National Institutes of Health (grant P01CA229092) (C.J.W.). L.P. is supported by a research fellowship from the German Research Foundation (PE 3127/1-1). S.L. is supported by the NCI Research Specialist Award (R50CA251956-01). P.B. is supported by NCI grant K08CA248458 and the Amy Strelzer Manasevit Research Program, which is funded through Be The Match Foundation. P.B. is a Scholar of the American Society of Hematology. S.H.G. is supported by a Kay Kendall Leukaemia Fund Fellowship. Scientific and financial support for the CIMAC-CIDC Network is provided through NCI cooperative agreement U24CA224331 (to the Dana-Farber Cancer Institute CIMAC).
Authorship
Contribution: L.P. performed experiments, analyzed data, designed figures and wrote the manuscript; T.H. and S.L. performed single-cell sequencing; S.H.G. performed experiments; E.M.T. performed CyTOF experiments; D.S. provided clinical data; R.Z. provided samples and interpreted data; K.J.L., M.S., F.S.H., and D.N. contributed to the interpretation of results; and P.B. and C.J.W. designed and supervised the study, interpreted results, and wrote the manuscript.
Conflict-of-interest disclosure: C.J.W. holds equity in BioNTech and receives research support from Pharmacyclics. D.N. holds stock in Madrigal Pharmaceuticals and received research funding from Pharmacyclics. E.M.T. reports travel fees and honoraria from Fluidigm Corporation and is a current Fluidigm employee. F.S.H. reports grants, personal fees, and other funding from Bristol-Myers Squibb; personal fees from Merck and EMD Serono; grants, personal fees, and other funding from Novartis; personal fees from Surface, Compass Therapeutics, Apricity, Aduro, Sanofi, Pionyr, Torque, Rheos, Bicara, Psioxus Therapeutics, Eisai, Checkpoint Therapeutics, Idera, Takeda, Genentech/Roche, personal fees from Bioentre, Gossamer, and Iovance; and other funding from Pieris Pharmacutical outside the submitted work; in addition, F.S.H. has a patent (Methods for Treating MICA-Related Disorders #20100111973) with royalties paid, patents (Tumor antigens and uses thereof #7250291; Therapeutic Peptides #9402905; Vaccine compositions and methods for restoring NKG2D pathway function against cancers #10279021; Antibodies that bind to MHC class I polypeptide-related sequence #10106611) issued, and patents (Angiopoiten-2 Biomarkers Predictive of Anti-immune checkpoint response #20170248603; Compositions and Methods for Identification, Assessment, Prevention, and Treatment of Melanoma using PD-L1 Isoforms #20160340407; Therapeutic peptides #20160046716; Therapeutic Peptides #20140004112; Therapeutic Peptides #20170022275; Therapeutic Peptides #20170008962; Method of using pembrolizumab and trebananib; anti-galectin antibody biomarkers predictive of anti-immune checkpoint and anti-angiogenesis responses #20170343552) pending. K.J.L. reports equity in Fluidigm. P.B. reports equity in Agenus, Amgen, Breakbio, Johnson & Johnson, Exelixis, and BioNTech. The remaining authors declare no competing financial interests.
Correspondence: Pavan Bachireddy, The University of Texas MD Anderson Cancer Center, 1515 Holcombe Blvd, Houston, TX 77030, e-mail: pbachireddy@mdanderson.org.

