

Key Points
Candidate discovery of translational feasibility for noninvasive measurement of miRNA from plasma vesicles as a biomarker for AML patients.
Preclinical validation of miR-1246 (candidate among 15 miRNA) as a potential minimally invasive AML biomarker for early monitoring of MRD.
Abstract
Recurrent disease remains the principal cause for treatment failure in acute myeloid leukemia (AML) across age groups. Reliable biomarkers of AML relapse risk and disease burden have been problematic, as symptoms appear late and current monitoring relies on invasive and cost-ineffective serial bone marrow (BM) surveillance. In this report, we discover a set of unique microRNA (miRNA) that circulates in AML-derived vesicles in the peripheral blood ahead of the general dissemination of leukemic blasts and symptomatic BM failure. Next-generation sequencing of extracellular vesicle-contained small RNA in 12 AML patients and 12 controls allowed us to identify a panel of differentially incorporated miRNA. Proof-of-concept studies using a murine model and patient-derived xenografts demonstrate the feasibility of developing miR-1246, as a potential minimally invasive AML biomarker.
Introduction
Acute myeloid leukemia (AML) evolves as an aggressive, molecularly heterogeneous disease arising from clonal differentiation arrest and uncontrolled hematopoietic progenitor proliferation in the bone marrow (BM), with late dissemination to the peripheral blood (PB). Early detection of AML has been challenging, with no unifying molecular marker for noninvasive PB-based screening. Rather, symptoms appear late, and disease detection relies on flow cytometry and morphologic assessment of BM aspirates.1,2 Disease tracking based on cellular assays is further complicated by the prompt clearance of leukemic blasts in circulation during therapy and after remission, when serial BM surveillance is invasive and cost-ineffective.3,4
To address the urgent need for an actionable AML biomarker, we considered cell-free microRNA (miRNA) a powerful, minimally invasive metric, and specifically, a subset of circulating AML-associated miRNA that escapes ribonuclease degradation through incorporation into 30- to 130-nm extracellular vesicles (EVAML).5-8 We hypothesized that plasma EVs from AML patients contain a unique complement of miRNA, whereby EVAML seed the PB ahead of the general dissemination of leukemic cells. Small-RNA sequencing in 12 AML patients and 12 controls allowed us to identify a panel of differentially incorporated miRNA. In a murine model of AML and patient-derived xenografts (PDX), we show that circulating EVAML precede AML blasts and correlate with disease burden, and we validate miR-1246 as a potential noninvasive EVAML miRNA biomarker.
Methods
Animals
Animal studies were approved by the OHSU and St. Jude’s Institutional Animal Care and Use Committee. For Molm-14 xenografts, cells (0.1 × 10⁶ per animal) were transplanted into NOD.Cg-PrkdcscidIl2rgtm1Wjl/SzJ (NSG) mice7 and imaged by IVIS.6 For PDX, CD3-depleted blasts were injected into sublethally irradiated NSG-SMG3.
Cells and patient materials
Molm-14 cells were cultured in RPMI 1640 with 10% Fetal Bovine Serum (FBS) and 1× penicillin/streptomycin (ThermoFisher) at 37°C, 5% CO2. Patient materials were obtained under Institutional Review Board–approved protocols at Texas Children's Cancer Center or St. Jude’s Children’s Research Hospital.
Flow cytometry
Data were acquired using LSR-FORTESSAII (BD-Biosciences) and analyzed using FlowJo (TreeStar).
Statistics
Student t test was used to assess significance.
Results and discussion
Circulating EVAML concentration correlates with BM disease burden
To formally demonstrate EV equilibration of AML blasts from BM to PB, we modeled AML tumor burden in vivo using our validated Molm-14 xenografts. In vivo imaging of mice bearing Molm-14 cells transduced with luciferase or myristoylated/membrane-targeted Green Fluorescent Protein (mGFP) lentivectors showed a gradual gain in signal (Figure 1A). Luciferase activity matched high tumor burden in the BM measured by human CD45% (hCD45), whereas PB hCD45% was negligible, indicating the characteristic lack of correlation that complicates disease monitoring (Figure 1B). Although we did not detect circulating leukemia cells, we observed a higher overall concentration of circulating EVs in xenografted mice (Figure 1C). EVs are nanoscale particles (Figure 1D) constitutively released by all cell types, but AML EVs (EVAML) are unique in their composition and contribute to disease progression.6,7 Because we previously showed that AML cells expressing mGFP release EVs that are detectable by microscopy,7 we determined EVAML concentration in plasma from xenografts and control animals with a 3-dimensional hydrogel-embedding technique for detection of EVs by high-resolution microscopy (Figure 1E). Plasma from mice with ∼20% BM chimerism contained ∼40 mGFP+ EVs per 1 × 10⁻⁴ μL, whereas those with ∼50% chimerism had ∼658 mGFP+ EVs per 1 × 10⁻⁴ μL, indicating a correlation between circulating EVAML and AML BM burden (Figure 1F,H). EVAML could be distinguished from circulating host EVs by labeling plasma-derived EVs with CellMask a lipophilic dye. Our data demonstrated EVAML (colabeled with CellMask/GFP) make up a sizable fraction of circulating EV, consistent with equilibration between BM and PB and their potential utility as a cell-free biomarker (Figure 1G,I).
![Correlation between EVs levels and AML disease burden. (A) In vivo imaging of mice xenografted with Molm-14 cells expressing luciferase at 1, 2, and 3 weeks. Images were taken by IVIS (left), and values were normalized to controls to calculate fold change (right). (B) Correlative analysis of tumor burden between human CD45 (hCD45) levels measured by flow cytometer in both the PB and BM in red vs luciferase activity in gray. (C) EV quantification using NanoSight analyzer from Molm-14 xenografted (red) or control (black) mice. Data show relative vesicles abundance over time (left) and correlation analysis at week 3 of PB and BM (red) vs EV abundance (blue). (D) Cryo-TEM image of Molm-14–derived EVs. Scale bar is 100 nm. (E) Workflow for measuring circulating EVs in the PB of mice bearing mGFP+ AML cells. (F) EV counts per unit volume (1 × 10⁻⁴ μL) correspond to BM tumor burden. (G) Quantification of relative AML EV count in the PB compared with total lipid vesicles in plasma. Each point represents EV count per unit volume (1 × 10⁻⁴ μL). (H) Representative 3-dimensional images and concentration of 20% (top) and 50% (bottom) animal cohorts. Bounding box represents 100 μm × 100 μm × 10 μm volume. Concentrations determined using [EVs/µL = (average EV count) × (volume/1) × (dilution factor)]. mGFP (white). (I) PB plasma of AML xenografted NSG mice contain numerous lipid vesicles and a discrete mGFP EV population (right) not seen in nonengrafted control animals (left). CellMask Lipid Dye (red), mGFP (green). Bounding box is 5 μm x 5 μm. Images captured with CoreDV epifluorescence microscope with 100× 1.49 TIRF objective and Nikon Coolpix CCD camera. Significance determined by Student t test. *P < .05; ***P < .001.](https://ash.silverchair-cdn.com/ash/content_public/journal/bloodadvances/5/21/10.1182_bloodadvances.2021004621/3/m_advancesadv2021004621f1.png?Expires=1767714305&Signature=lWmcvEKCPmOqAJN7mXqBq323PLlFLfedXcfseXSlyoBmNcn3kxaknznAkzQJATUpCrWcV1TAA3cDR~7BpADJ4iDrWvkKu4Pvq3JlrduJ3L~~vZsp33l0CgUlfWQDS7pCQZNo2KWzyd0h9Kj3TwcLbJKGKVToqwO~7AlZ8Go6xJLeJa6SxnmA0h28oK0SNblu9PvERsErc1qOxN9krDY~-4H4EWyS7KFSSom0NHdX1na4cQQUdROx3jQxw1LOiy7mXCJa0YeQPhMooKiQXtPnDTl3IeBM2aEALIKKIVxHEYcZxX-34u91aHt8k9cBraobLYmA6zCIpH5ovDu0WYhUzQ__&Key-Pair-Id=APKAIE5G5CRDK6RD3PGA)
Correlation between EVs levels and AML disease burden. (A) In vivo imaging of mice xenografted with Molm-14 cells expressing luciferase at 1, 2, and 3 weeks. Images were taken by IVIS (left), and values were normalized to controls to calculate fold change (right). (B) Correlative analysis of tumor burden between human CD45 (hCD45) levels measured by flow cytometer in both the PB and BM in red vs luciferase activity in gray. (C) EV quantification using NanoSight analyzer from Molm-14 xenografted (red) or control (black) mice. Data show relative vesicles abundance over time (left) and correlation analysis at week 3 of PB and BM (red) vs EV abundance (blue). (D) Cryo-TEM image of Molm-14–derived EVs. Scale bar is 100 nm. (E) Workflow for measuring circulating EVs in the PB of mice bearing mGFP+ AML cells. (F) EV counts per unit volume (1 × 10⁻⁴ μL) correspond to BM tumor burden. (G) Quantification of relative AML EV count in the PB compared with total lipid vesicles in plasma. Each point represents EV count per unit volume (1 × 10⁻⁴ μL). (H) Representative 3-dimensional images and concentration of 20% (top) and 50% (bottom) animal cohorts. Bounding box represents 100 μm × 100 μm × 10 μm volume. Concentrations determined using [EVs/µL = (average EV count) × (volume/1) × (dilution factor)]. mGFP (white). (I) PB plasma of AML xenografted NSG mice contain numerous lipid vesicles and a discrete mGFP EV population (right) not seen in nonengrafted control animals (left). CellMask Lipid Dye (red), mGFP (green). Bounding box is 5 μm x 5 μm. Images captured with CoreDV epifluorescence microscope with 100× 1.49 TIRF objective and Nikon Coolpix CCD camera. Significance determined by Student t test. *P < .05; ***P < .001.
Correlation between EVs levels and AML disease burden. (A) In vivo imaging of mice xenografted with Molm-14 cells expressing luciferase at 1, 2, and 3 weeks. Images were taken by IVIS (left), and values were normalized to controls to calculate fold change (right). (B) Correlative analysis of tumor burden between human CD45 (hCD45) levels measured by flow cytometer in both the PB and BM in red vs luciferase activity in gray. (C) EV quantification using NanoSight analyzer from Molm-14 xenografted (red) or control (black) mice. Data show relative vesicles abundance over time (left) and correlation analysis at week 3 of PB and BM (red) vs EV abundance (blue). (D) Cryo-TEM image of Molm-14–derived EVs. Scale bar is 100 nm. (E) Workflow for measuring circulating EVs in the PB of mice bearing mGFP+ AML cells. (F) EV counts per unit volume (1 × 10⁻⁴ μL) correspond to BM tumor burden. (G) Quantification of relative AML EV count in the PB compared with total lipid vesicles in plasma. Each point represents EV count per unit volume (1 × 10⁻⁴ μL). (H) Representative 3-dimensional images and concentration of 20% (top) and 50% (bottom) animal cohorts. Bounding box represents 100 μm × 100 μm × 10 μm volume. Concentrations determined using [EVs/µL = (average EV count) × (volume/1) × (dilution factor)]. mGFP (white). (I) PB plasma of AML xenografted NSG mice contain numerous lipid vesicles and a discrete mGFP EV population (right) not seen in nonengrafted control animals (left). CellMask Lipid Dye (red), mGFP (green). Bounding box is 5 μm x 5 μm. Images captured with CoreDV epifluorescence microscope with 100× 1.49 TIRF objective and Nikon Coolpix CCD camera. Significance determined by Student t test. *P < .05; ***P < .001.
Identification of an AML signature from plasma EV miRNA
We recently reported the selective in vitro and in vivo enrichment of miRNAs in EVAML5,6. To identify an miRNA signature specific to AML patients, we performed small-RNA sequencing of EVs, purified from 1 mL plasma by serial ultracentrifugation, of 12 newly diagnosed AML patients (supplemental Table 1) and 12 healthy controls (Figure 2A). NGS-miRNA libraries were constructed using NEBNEXT kit, and samples were sequenced using the Illumina NextSeq500. Gene-wise linear models were employed to compare differential expression (DE) in these groups using R/Bioconductor software, limma,9 and False Discovery Rate (FDR) adjustments.10 DE genes were defined as greater than or equal to twofold change and FDR (P < .05), and 243 miRNAs met criteria (107 upregulated and 136 downregulated in the AML group; Figure 2B; supplemental Figure 1A). Principal Component Analysis (PCA) showed a good separation between the groups using the selected DE miRNAs, supporting the feasibility of a prediction model for AML (supplemental Figure 1B). We identified 15 large-effect size DE miRNAs that were greater than or equal to eightfold upregulated in the AML group with FDR (P < .05), including miR−144−5p , miR−96−5p, miR−145−5p, miR−378a−5p, miR−222−5p, miR−181a−3p, miR−181b−5p, miR−199b−5p, miR−3154, miR−92a−1−5p, miR−25−5p, miR−27a−5p, miR−1246, miR−6503−3p, and miR−6503−5p (Figure 2C).
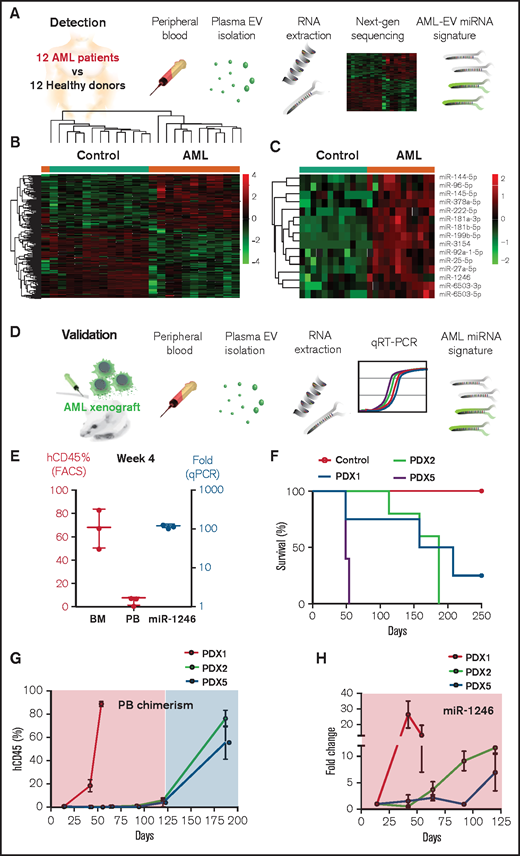
Identification of AML miRNA signature from patients’ plasma EVs . (A) Workflow for characterization of EVs miRNA content. The RNA content of EVs from blood plasma collected from 12 AML patients and 12 healthy donors were sequenced using Nextseq500 analyzer. (B) Heat map showing the 243 differentially expressed miRNA between the AML patients (orange) and the healthy donors (green) groups. (C) Heat map showing the AML signature composed of 15 miRNAs uniquely upregulated in the AML patients (orange) vs the healthy donors (green). (D) Workflow for validation of miR-1246, a candidate miRNA among the AML signature. Molm-14 cells or PDXs were executed, and miR-1246 levels were measured in the blood plasma EVs by quantitative polymerase chain reaction (qPCR). (E) Correlative analysis at 4 weeks in Molm-14 xenografted mice between human CD45 levels measured by flow cytometer in both the PB and BM (red), and miR-1246 levels measured by qPCR and normalized to U6 control (blue). (F) Survival curve of PDXs (n = 5 per group; PDX1, PDX2, and PDX5). (G) Flow cytometer analysis showing PB chimerism represented by hCD45 levels over time in mice (n = 5 per group) xenografted with PDX1, PDX2, and PDX5. (H) qPCR analysis showing fold change of miR-1246 over time in PDX1 (red), PDX2 (blue), and PDX5 (green) relative to week 2. Data were normalized to U6 control (dCT), and fold change was determined relative to nonengrafted controls (ddCT).
Identification of AML miRNA signature from patients’ plasma EVs . (A) Workflow for characterization of EVs miRNA content. The RNA content of EVs from blood plasma collected from 12 AML patients and 12 healthy donors were sequenced using Nextseq500 analyzer. (B) Heat map showing the 243 differentially expressed miRNA between the AML patients (orange) and the healthy donors (green) groups. (C) Heat map showing the AML signature composed of 15 miRNAs uniquely upregulated in the AML patients (orange) vs the healthy donors (green). (D) Workflow for validation of miR-1246, a candidate miRNA among the AML signature. Molm-14 cells or PDXs were executed, and miR-1246 levels were measured in the blood plasma EVs by quantitative polymerase chain reaction (qPCR). (E) Correlative analysis at 4 weeks in Molm-14 xenografted mice between human CD45 levels measured by flow cytometer in both the PB and BM (red), and miR-1246 levels measured by qPCR and normalized to U6 control (blue). (F) Survival curve of PDXs (n = 5 per group; PDX1, PDX2, and PDX5). (G) Flow cytometer analysis showing PB chimerism represented by hCD45 levels over time in mice (n = 5 per group) xenografted with PDX1, PDX2, and PDX5. (H) qPCR analysis showing fold change of miR-1246 over time in PDX1 (red), PDX2 (blue), and PDX5 (green) relative to week 2. Data were normalized to U6 control (dCT), and fold change was determined relative to nonengrafted controls (ddCT).
Validating EVAML miRNA in preclinical models
To demonstrate reproducibility and validity, we systematically determined levels of EVAML-associated miR-1246 in plasma from AML xenograft models as a representative miRNA because it was consistent with our previous report of EVAML miRNA from AML cell lines,5 which exposed it as a high-confidence reproducible candidate independent of the analysis (Figure 2D). We observed a high correlation between miR-1246 levels and tumor burden (hCD45%) in Molm-14 xenografts at week 4, whereas the frequency of PB blasts was negligible (Figure 2E). We further validated our data using 3 PDX models with variable latency (Figure 2F). In the more aggressive model, PDX5, miR-1246 levels were significantly correlated with disease progression (Figure 2G-H). Interestingly, in the long-latency PDX models (PDX1 and 2), miR-1246 levels accurately mirrored the tumor progression at early disease stages despite the low PB chimerism (Figure 2G-H). Moreover, miR-1246 monitored residual disease early after chemotherapy initiation, and its levels were higher in patients with elevated blast counts (supplemental Figure 2). Our data, in sum, support further development of plasma EV-miRNA as a minimally invasive biomarker and for longitudinal tracking in AML patients.
Several recent reports support the potential of plasma miRNA as minimally invasive markers of disease.11,12 However, unlike previous attempts that examined freely circulating miRNAs, we set out to take advantage of the disease-specific enrichment and extended half-life of small-RNAs protected within circulating EVs.12 An additional advantage, given the molecular and cytogenetic heterogeneity of AML, is that several distinct subtypes appear to share the overexpression of select miRNAs.13-15 Here, we leveraged these potential advantages for EVAML and investigated circulating plasma EVs miRNA from a cohort of 12 AML patients vs 12 healthy donors. That screen not only identified a panel of 15 EV-contained miRNAs that distinguish AML patients from healthy controls, but we selectively validated EVAML miRNA using PDX models from human AML patients. Our data consistently identified miR-1246 as a highly sensitive marker of leukemic burden along with 7 uniformly expressed miRNA as potential normalization controls: let−7i−5p, miR−942−5p, miR−374b−3p, miR−361−3p, miR−589−5p, miR−3613−5p, and miR−885−5p. As previous studies,13,14 our EVAML miRNA panel included freely circulating miR−181a−3p, miR−181b−5p, hsa−miR−199b−5p, and miR−6503−3p, suggesting the reproducibility and sensitivity of our analysis, whereas miR-1246 was EV-specific.
Current cell-based markers can provide useful prognostic guidance, but BM-based qPCR and flow cytometry require an invasive and costly aspiration procedure.1,2 Specifically, our results provide proof-of-principle for miR-1246 (among 15 miRNA) as a potential biomarker for AML for future monitoring of residual disease and early detection of relapse. Follow-up studies will have to test AML subtype specificity and longitudinal performance in patients, ideally pairing EVAML miRNA(s) with an additional cell-free marker of disease. The generated results serve as preclinical validation and demonstrate the translational feasibility of measuring miRNAs noninvasively from patients’ plasma.
Acknowledgments
The authors thank Stefanie Kaech-Petrie, Aurelie Snyder, and Xiaolin Nan for imaging support, Gunagchun Song for data deposition help, and Michael Morin for NanoSight assistance. The authors also thank the St Jude Comprehensive Cancer Center (SJCCC) Preclinical Testing Program (PTP), funded through National Institutes of Health, National Cancer Institute (NCI) grant P30CA021765, including Aman Seth and Rebecca Thorne for their assistance with the PDX studies.
The published content is solely the responsibility of the authors and does not necessarily represent the official views of the NIH or the funding foundations. This work was funded by Hyundai Hope on Wheels and MaxBlue Butterfly Campaign (P.K.) and Collins Medical Trust, Oregon (S.A). Support was also provided by the National Institutes of Health, NCI under award F30CA247601 Friends of Doernbecher in funding of J.T.B.
Authorship
Contribution: All the authors have approved their authorship in this work, gave input to the manuscript, and contributed as follows: S.A. and P.K. conceptualized the work; S.A., J.T.B., J.M.K., and P.K. provided the methodology; S.A., J.T.B., D.-W.C., and S.J. did the investigating; S.A., J.T.B., L.G., and J.Y.L. provided the formal analysis; S.A. and P.K. wrote the original draft; S.A. and J.T.B. provided the visualization; S.A., G.J., J.M.K., T.M.H., and P.K. provided resources; S.A., J.T.B., and P.K. acquired funding; and S.A., J.M.K., and P.K. supervised.
Conflict-of-interest disclosure: The authors declare no competing financial interests.
Correspondence: Sherif Abdelhamed, St. Jude Children’s Research Hospital, Memphis, TN 38105; e-mail: Sherif.Abdelhamed@stjude.org; and Peter Kurre, Children’s Hospital of Philadelphia, University of Pennsylvania, Philadelphia, PA 19104; e-mail: kurrep@e-mail.chop.edu.

