

Key Points
CCL5 is differentially expressed by DLBCL cells and efficiently recruits TAMs through their expression of CCR1/CCR5.
Most DLBCL TAMs have a noncanonical gene signature.

Abstract
Tissue invasion by tumor cells induces a host inflammatory response that variably impacts tumorigenesis. This has been well documented for tumor-associated macrophages (TAMs) that could play a pro/M2- or an anti/M1-tumoral function. TAMs frequently infiltrate diffuse large B-cell lymphoma (DLBCL), an aggressive neoplasm arising from germinal center–experienced B cells. However, the pathway leading to the presence of TAMs in DLBCL remains unknown, and their impact is unclear. Here, we show that some DLBCL tumor cells expressed the chemokine CCL5, enabling the differential recruitment of blood monocytes through their expression of CCR1 and CCR5. CCL5 expression by DLBCL was not related to molecular subtypes, and healthy tonsillar B cells did not produce this chemokine, implying a posttransformation event. A single-cell analysis revealed that most DLBCL TAMs had a noncanonical gene signature with the concomitant expression of M1 and M2 genes. The presence of noncanonical TAMs may explain the lack of impact of macrophages on DLBCL development reported in some survival studies.
Introduction
Tumor-associated macrophages (TAMs) constitute the most abundant immune cells present in tumors. Recent CIBERSORT analysis of tumor transcriptome data sets revealed that they may represent up to 50% of the total leukocyte content in tumors.1 Their ontogeny varies from tissue-resident to recruited cells from blood.2 The former population of tissue-resident macrophages is formed very early during development at the fetal stage, and some of them are maintained throughout life in the steady-state. Upon tumor development, they may expand by retaining their specific gene signature profile, distinguishing them from the recruited population.3,4 The latter recruited population originates from precursor blood monocytes that will rapidly differentiate into macrophages upon tissue extravasation. Depending on the microenvironment, TAMs polarize into 2 main canonical functional profiles.5 The one with high expression of antigen presentation and T-cell costimulatory molecules characterizes the M1 profile. M1 macrophages usually produce proinflammatory cytokines and may express proapoptotic molecules. According to their signature profile, M1 macrophages possess an overall antitumoral function. High expression of scavenger receptors enabling tissue regeneration characterizes the second M2 subset. M2 macrophages usually coproduce anti-inflammatory cytokines and possess proangiogenic functions. As a consequence, M2 macrophages are characterized by an overall protumoral function. Emergence of new tools, including single-cell analyses, changed our understanding of macrophage biology with the identification of noncanonical macrophages, which coexpress M1 and M2 markers.6,7
The impact of TAMs on tumor development has been studied extensively. A dominant protumoral function was recently confirmed by meta-analyses, at least in solid tumors.8 Diffuse large B-cell lymphoma (DLBCL) is the most common form of lymphoma arising from antigen-experienced B cells; it represents >90% of aggressive lymphomas. In addition to genomic abnormalities driving tumorigenesis, the tumor microenvironment plays a key role in DLBCL development.9 In the DLBCL microenvironment, TAMs are present to a variable extent, and TAM genes are part of the stromal-1 DLBCL subtype associated to a favorable prognosis.10 However, when macrophage infiltration was studied specifically, variable impacts on clinical outcomes were reported. In 2015, a review of the literature indicated that, for patients treated with a rituximab-based regimen, 1 study found a favorable impact, 1 study found an adverse impact, and 2 studies did not find any significant impact.11 When M1 and M2 polarization profiles were taken into account with the costaining CD68/HLA-DR and CD68/CD163, respectively, 2 studies found an adverse effect and 1 study did not find any impact for the M2 profile. The M1 profile did not modulate the clinical outcome of patients in 1 study. Since then, another study reported a lack of impact, and 3 other studies reported an adverse impact for total TAMs and/or M2 TAMs.12-15 In the present study, we identified the chemokine responsible for TAMs’ presence in DLBCL lesions, as well as analyzed the polarization profile of these TAMs and their clinical impact on DLBCL using 4 public data sets.
Materials and methods
Animal experimentation
Mouse experimentation followed the ARRIVE guidelines and was approved by the Grenoble Veterinary Committee. DLBCL cells (0.5 × 10⁶) in 0.1 mL phosphate buffered saline were injected subcutaneously. Tumor engraftment was assessed by skin palpation and confirmed by histology. Mice were euthanized when the tumor volume reached 0.5 cm3. For in vivo chemotactic studies, nude mice were obtained from Charles River Laboratories. metCCL5 (100 mg/kg; R&D Systems) was injected intraperitoneally for 5 consecutive days. The generation of humanized NOG mice was described previously.16 Tumor growth was monitored by measuring tumor volume with a caliper.
Human experimentation
The Grenoble Ethic Committee approved human studies. DLBCL diagnosis was performed by 2 independent pathologists. Frozen DLBCL samples and corresponding formalin-fixed paraffin-embedded DLBCL biopsies were obtained at diagnosis from the Center of Biological Resources (Grenoble, France) after patients provided informed consent. Peripheral blood mononuclear cells were obtained from healthy donors (French Blood Establishment, Grenoble). Tonsils were obtained from patients with tonsillitis at Grenoble University Hospital. A consort diagram detailing the use of human samples is presented as supplemental Figure 1.
Immunohistochemistry
Immunostaining for CD45 (c2B11 + PD7/26; Dako), CD68 (PGM-1; Dako), and CD163 (10D6; ThermoFisher) was performed after heat-induced epitope retrieval in 10 mM citrate (pH 6.0). Staining for F4/80 (cBM8; eBioscience) was performed after proteinase K treatment. Fluorochrome-conjugated anti-mouse immunoglobulin (Ig) isotypes and anti-rat horseradish peroxidase were used as secondary reagents. Images were taken with a Axio Imager M2 microscope (Carl Zeiss) with a Plan NeoFluar 40×/0.75 objective.
Flow cytometry
All fluorochrome-conjugated antibodies were from BD Biosciences. Bcl2, CD163, and CD68 staining was performed after cell fixation and permeabilization using a transcription factor buffer kit (BD Biosciences). Fluorescence was analyzed with an Accuri C6 or an LSR II flow cytometer (BD Biosciences). CD20+/CD20− fractions of frozen primary DLBCL and tonsil CD19+ naive (IgD+/CD38−), germinal center (GC; CD38+); and memory (IgD−/CD38−) B-cell subsets were purified on a FACSAria (BD Biosciences). Dead cells and cell doublets were excluded by 7-aminoactinomycin D staining and by plotting the height against the area for forward scatter, respectively. Purity and viability were >95%.
Chemokine profiling and ELISA
Thirty 20-µm sections of frozen DLBCL biopsies were pooled and lysed in Na phosphate 0.01 M, EDTA 1 mM, EGTA 1 mM, NaF 1 mM, NaCl 0.15 M, pH = 7.2, containing 1% Triton X-100, 0.1% NaDOC, 1 mM PMSF and complete mini cocktail protease inhibitors from Roche. Protein quantification in lysates was performed with a BCA Protein Assay Kit (Pierce). The human cytokine/chemokine profiling kit and the CCL3, CCL4, and CCL5 enzyme-linked immunosorbent assays (ELISAs) were from R&D Systems. Pixel density quantification was performed with ImageJ software. The origin of the DLBCL cell lines was described elsewhere.16 All cell lines were checked for the absence of mycoplasma (PlasmoTest Kit; InvivoGen). DLBCL cells (0.5 × 10⁶/mL) were incubated for 48 hours for supernatant conditioning. Cell stimulation was performed with an anti–B-cell receptor (BCR; goat anti-human Ig; 1 µg/mL; Life Technologies), Fc-CD40L (1 µg/mL; Enzo Life Sciences), and tumor necrosis factor (TNF; 100 ng/mL; Adipogen). Cell-free supernatants were analyzed by ELISA for CCL5 content.
PCR
Total RNA was extracted with an RNeasy Micro Kit (QIAGEN), and complementary DNA was generated using oligo(dT)12-18 and SuperScript II reverse transcriptase (ThermoFisher). For CCL5, 5'-cggaaggaaccatctcactg-3' and 5'-agcactccttggcaaaactg-3' were used as forward and reverse primers, respectively. Denaturation was performed at 94°C, annealing was performed at 60°C, and extension was performed at 72°C (30 seconds each). Forty cycles were applied. Amplified polymerase chain reaction (PCR) products were visualized on agarose gels using ethidium bromide staining or were quantified using an iCycler iQ Real-Time PCR Detection System and a SYBR Green–based kit (iQ Supermix; both from Bio-Rad). Expression levels were normalized using actin messenger RNA (mRNA). Results were quantified using a standard curve generated with serial dilutions of input DNA. DLBCL cells (0.5 × 10⁶/mL) were incubated for 24 hours with Trichostatin A (TSA; 500 ng/mL) or for 72 hours with decitabine (10 µM; both from Sigma). Dimethyl sulfoxide (DMSO) was used as vehicle control.
Migration/invasion assay
Monocytes were purified by negative selection with a Classical Monocyte Isolation Kit (Miltenyi Biotec), according to the manufacturer’s instructions. Purity exceeded 80%. DLBCL cells were incubated in bottom compartments of 8-µM 24-well Transwell plates (Nunc) at 0.5 × 10⁶ cells per milliliter. Twenty-four hours later, 0.2 × 10⁶ purified monocytes were added to upper compartments. After 2 hours of incubation, cells from the bottom compartment were stained for CD14, and CD14+ monocytes were enumerated by flow cytometry with an Accuri C6 (BD Biosciences) set on a volume-based event acquisition. Flow variations were controlled by the addition of fluorescent beads (BD Biosciences). The invasion assay was performed similarly but the filter was covered with 50 µL of Matrigel (BD Biosciences), and the incubation time was extended to 18 hours. Polyclonal goat anti-CCL5 (R&D Systems) and control goat IgG (Sigma) were used at 10 µg/mL. metCCL5 was used at 100 ng/mL. Maraviroc and BX471 (Sigma) were used at 100 µM and 100 nM, respectively.
Single-cell analysis
Viable 7-AAD−/CD14+ single cells from tumor lesions from DLBCL patients were sorted, using the autoclone module (BD Biosciences), directly into 96-well plates filled with CellsDirect Reaction Mix (Invitrogen). Individual cell lysis, complementary DNA synthesis, and amplification were performed according to the Fluidigm Advanced Development Protocol by single-cell microfluidic real-time PCR using Dynamic Array IFCs (Biomark Fluidigm). Preamplified products (22 cycles) were diluted fivefold before analysis with Universal PCR Master Mix and inventoried TaqMan gene expression assays in 96.96 Dynamic Arrays on a Biomark System (Fluidigm). For single-cell analysis, cycle threshold (Ct) values were calculated from the system’s software (Biomark Real-time PCR Analysis; Fluidigm). Cells lacking a detectable signal for the housekeeping gene (GAPDH) and/or CD14/CD68 were excluded from analysis; relative expression values were defined as 40-Ct. Data were generated with a pool of cells, sorted using fluorescence activated cell sorting, from the 3 TAMhigh DLBCL patients shown in Figure 1E.
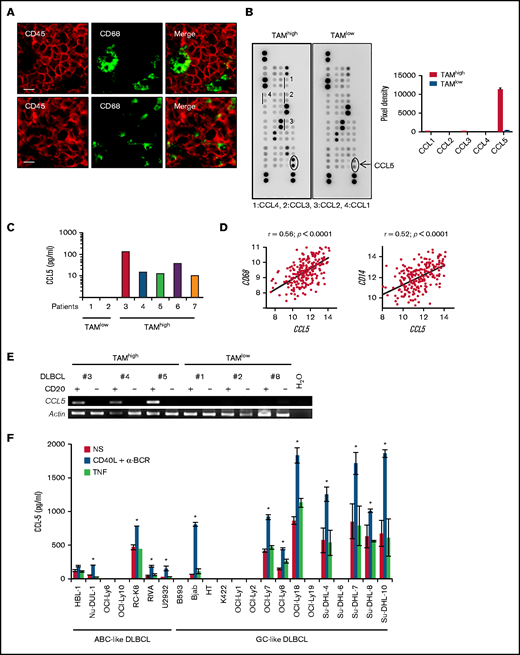
CCL5 expression in DLBCL correlates with TAM. (A) Tonsil (upper panels) and DLBCL biopsies (lower panels) were stained for CD68 and CD45. The photographs are representative of ≥10 tonsils and 10 DLBCLs. Scale bars, 10 µm. (B) Lysates of 2 DLBCL biopsies were profiled for chemokine expression (left panels). Duplicate dots corresponding to CCL5 are shown. Dots corresponding to other monocyte-acting chemokines are underlined. A quantification by pixel intensity is provided for the monocyte-specific chemokines (right panel). (C) CCL5 was quantified in 7 additional DLBCL biopsy lysates by ELISA. (D) Correlation plots for CCL5 and CD68 or CD14 mRNA expression in tumor lesions from the GSE10846 DLBCL dataset. P values and Pearson correlation coefficients (r) are shown. (E) Reverse transcription PCR analysis of CCL5 mRNA expression in the CD20+ and CD20− fractions obtained from primary DLBCL samples. (F) CCL5 concentration in the supernatant of nonstimulated (NS), CD40L/α-BCR, and TNF-stimulated DLBCL cell lines. The figure is representative of ≥5 experiments. Data are mean ± standard deviation. *P < .05 vs NS group.
CCL5 expression in DLBCL correlates with TAM. (A) Tonsil (upper panels) and DLBCL biopsies (lower panels) were stained for CD68 and CD45. The photographs are representative of ≥10 tonsils and 10 DLBCLs. Scale bars, 10 µm. (B) Lysates of 2 DLBCL biopsies were profiled for chemokine expression (left panels). Duplicate dots corresponding to CCL5 are shown. Dots corresponding to other monocyte-acting chemokines are underlined. A quantification by pixel intensity is provided for the monocyte-specific chemokines (right panel). (C) CCL5 was quantified in 7 additional DLBCL biopsy lysates by ELISA. (D) Correlation plots for CCL5 and CD68 or CD14 mRNA expression in tumor lesions from the GSE10846 DLBCL dataset. P values and Pearson correlation coefficients (r) are shown. (E) Reverse transcription PCR analysis of CCL5 mRNA expression in the CD20+ and CD20− fractions obtained from primary DLBCL samples. (F) CCL5 concentration in the supernatant of nonstimulated (NS), CD40L/α-BCR, and TNF-stimulated DLBCL cell lines. The figure is representative of ≥5 experiments. Data are mean ± standard deviation. *P < .05 vs NS group.
Public database mining
Gene expression profiling data sets associated with clinical information on DLBCL patients treated with Rituximab-Cyclophosphamide, Hydroxydaunorubicine, Oncovin, Prednisone (R-CHOP) from GSE10846 (n = 233), GSE32918 (n = 140), GSE53786 (n = 70), and GSE23501 (n = 70) were used.10,17-19 For survival analysis, thresholds were determined using maxstat function in R software, which allows determination of the optimal cut-point for continuous variables. Probe identifications used for GSE10846, GSE53786, and GSE23501 were 1555759_a_at (CCL5), 205098_at (CCR1), 208304_at (CCR3), 206991_s_at (CCR5), 201743_at (CD14), and 203507_at (CD68). Probe identifications used for GSE32918 were ILMN_2098126 (CCL5), ILMN_1678833 (CCR1), ILMN_1656684 (CCR3), ILMN_2145033 (CCR5), ILMN_2396444 (CD14), and ILMN_2267914 (CD68). The GenomicScape Web site was used to study CCL5 expression in the different B-cell differentiation stages with the human B cells to plasma cells data set.20,21
Statistics
Statistical analyses were performed with a 2-tailed paired Student t test on samples of equal size. The Pearson coefficient was used for correlation analyses. Overall survival was analyzed using the Kaplan-Meier method and a log-rank statistical test. Differences between >2 groups were analyzed by 1-way analysis of variance. P values >.05 were considered nonsignificant. All statistical analyses were performed using Prism software (GraphPad Software, San Diego, CA).
Results
CCL5 expression is variable in DLBCL
DLBCL are tumors arising from GC-experienced B cells. In healthy secondary lymphoid organs, the GC contains tingible body macrophages. All CD68+ tingible body macrophages were negative for the hematopoietic marker CD45, suggesting a tissue-resident origin for these cells (Figure 1A). By contrast, all CD68+ TAMs in DLBCL lesions expressed the hematopoietic marker CD45. These indicated that they were likely of a hematopoietic origin and suggested a chemotactic recruitment of monocyte precursors from peripheral blood. We selected frozen DLBCL biopsies with a high and low TAM infiltration, defined as >200 and <20 CD68+ cells per mm2, respectively. Chemokine profiling identified upregulation of CCL5 in the TAMhigh case (Figure 1B). The other monocyte-acting chemokines, CCL1, CCL2, CCL3, and CCL4, were not detected above background. ELISA further confirmed the presence and absence of CCL5 in 4 additional TAMhigh and 2 TAMlow patients, respectively (Figure 1C). Data mining of the GSE10846 data set for DLBCL patients further showed that CCL5 expression positively correlated with CD68, as well as with a second monocyte/macrophage marker, CD14 (Figure 1D). Significant correlations were also observed in 3 additional DLBCL data sets (GSE32918, GSE53786, and GSE23501) (supplemental Figure 2). We next wanted to determine CCL5 origin by performing mRNA analysis; we detected specific CCL5 expression by tumor cells in the CD20+ tumoral fraction of primary DLBCL but not in the CD20− environment fraction (Figure 1E). In this analysis, CCL5 detection was restricted to TAMhigh patients (patients 3 through 5 in Figure 1C). Finally, 13 of 22 DLBCL cell lines were positive for CCL5 secretion by ELISA (Figure 1F). In these lines, CCL5 secretion was constitutive and upregulated by anti-BCR/CD40L but not the TNF stimuli used here as a negative control for the TNF superfamily. Anti-BCR/CD40L stimulation never induced secretion in the negative cell lines. In this experiment, we observed that CCL5 was equally produced by activated B-cell–like (ABC; n = 5) and GC-like (n = 8) DLBCL subtypes. These results show that CCL5 expression by DLBCL tumor cells is a variable event mirroring TAM infiltration observed in situ.
CCL5 induction in DLBCL cells is a posttumoral transformation event
We next observed that CCL5 expression was not statistically different between DLBCL molecular subtypes in the 4 analyzed data sets (Figure 2A; supplemental Figure 3). CD68 expression was also equally distributed among DLBCL molecular subtypes, making compatible the correlation between CD68 and CCL5 expression presented above. Phenotyping of the CCL5+ DLBCL cell lines OCI-Ly7, Nu-DUL-1, Su-DHL-4, and Su-DHL-10 revealed a wide heterogeneity (Figure 2B). The phenotype of the other 8 CCL5+ cell lines has been published elsewhere and showed a similar heterogeneity.16 In total, all of the cell lines expressed the mature B cell markers CD19 and HLA-DR, with the exception of 1 that lost CD19 expression. Bcl-2 expression was found in 5 of 13 cell lines. GC-like and ABC-like DLBCL tumor cells are thought to arise from light zone and post-GC B cells, respectively.22 The light CXCR4 and dark zone CD83 markers were heterogeneously expressed. Seven cell lines had switched to an IgG+/IgM− phenotype. The activation (CD38 and CD69), memory B-cell (CD27), and plasmablast (CD138) markers were also differentially expressed in these cell lines. The presence of the most common somatic mutations in the analyzed DLBCL cell lines was assessed using the COSMIC database. We did not identify specific mutations correlating with CCL5 expression. The presence of commonly found gene translocations among IGH, BCL2, BCL6, and MYC also did not identify specific rearrangements correlating with CCL5 expression. With regard to healthy tonsillar B cells, we did not detect CCL5 protein in the supernatant from purified naive, GC, or memory B cells, even after stimulation with anti-BCR/CD40L, or in the CCL5 mRNA from these healthy B cells (Figure 2C). Such an absence of CCL5 expression was confirmed in a data set analyzing all stages of B-cell differentiation, from naive to fully differentiated bone marrow–established plasma cells (supplemental Figure 4). We next treated a panel of 5 CCL5− DLBCL cell lines with the demethylating agent decitabine and the histone deacetylase inhibitor TSA (Figure 2D). Notably, TSA and decitabine treatments induced CCL5 transcription in all of the CCL5− DLBCL cell lines, demonstrating that CCL5− DLBCL cells still contained a functional CCL5 locus but remained epigenetically silent.
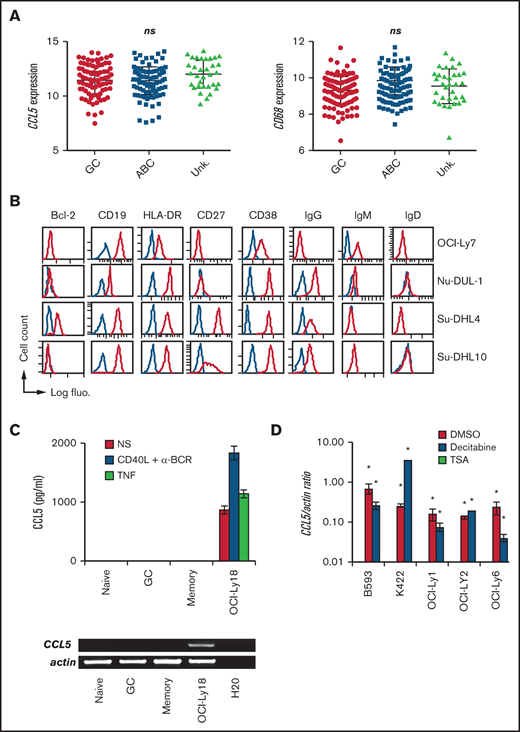
CCL5 production in DLBCL is a posttumoral transformation event. (A) CCL5 and CD68 mRNA expression in tumors among GC, ABC, and unknown (Unk.) DLBCL subtypes from the GSE10846 data set. Differences were analyzed by 1-way analysis of variance. (B) DLBCL cell lines were phenotyped by flow cytometry for the indicated markers. Blue lines correspond to control Ig staining. (C) ELISA for CCL5 in the supernatant of nonstimulated (NS), CD40L/α-BCR, and TNF-stimulated tonsillar B-cell subsets (upper panel). Reverse transcription PCR analysis of CCL5 mRNA expression in CD19+IgD+CD38− naive, CD19+CD38+ GC, and CD19+IgD−CD38− memory B cells (lower panel). OCI-Ly18 was used as a positive control. Data are representative of 3 patients with tonsillitis. (D) Quantitative reverse transcription PCR analysis for CCL5 mRNA in CCL5− DLBCL cell lines treated with decitabine, TSA, or DMSO vehicle control. A value of 1 was arbitrarily assigned to DMSO-treated CCL5+ OCI-Ly18. Data (mean ± standard deviation) are representative of 3 independent experiments. *P < .05 vs DMSO-treated group. ns, not significant.
CCL5 production in DLBCL is a posttumoral transformation event. (A) CCL5 and CD68 mRNA expression in tumors among GC, ABC, and unknown (Unk.) DLBCL subtypes from the GSE10846 data set. Differences were analyzed by 1-way analysis of variance. (B) DLBCL cell lines were phenotyped by flow cytometry for the indicated markers. Blue lines correspond to control Ig staining. (C) ELISA for CCL5 in the supernatant of nonstimulated (NS), CD40L/α-BCR, and TNF-stimulated tonsillar B-cell subsets (upper panel). Reverse transcription PCR analysis of CCL5 mRNA expression in CD19+IgD+CD38− naive, CD19+CD38+ GC, and CD19+IgD−CD38− memory B cells (lower panel). OCI-Ly18 was used as a positive control. Data are representative of 3 patients with tonsillitis. (D) Quantitative reverse transcription PCR analysis for CCL5 mRNA in CCL5− DLBCL cell lines treated with decitabine, TSA, or DMSO vehicle control. A value of 1 was arbitrarily assigned to DMSO-treated CCL5+ OCI-Ly18. Data (mean ± standard deviation) are representative of 3 independent experiments. *P < .05 vs DMSO-treated group. ns, not significant.
CCL5 produced by DLBCL recruits blood monocytes expressing CCR1 and CCR5
Analysis of blood monocytes from healthy donors showed that these cells may respond to CCL5 as a result of the surface expression of CCR1 and CCR5, whereas the third known CCL5-sensitive CC motif receptor, CCR3, was not expressed (Figure 3A). Four DLBCL cell lines expressing CCL5 (OCI-Ly18, Su-DHL-8, Su-DHL-4, and RC-K8) significantly recruited more blood monocytes than did CCL5− OCI-Ly6 cells (Figure 3B, upper left panel). We then used the OCI-Ly6 and OCI-Ly18 DLBCL cell lines as representatives for CCL5− and CCL5+ tumor cells, respectively. In these 2 cell lines, CCL5 was the only monocyte-recruiting chemokine that was differentially expressed (supplemental Figure 5). CCL3 and CCL4 were weakly detected in both lines by immunodot but not by a specific CCL3 and CCL4 ELISA (data not shown). Monocyte migration was blocked using anti-CCL5 antibody (Figure 3B, upper right panel). Targeting of CCR1 with BX471 and targeting of CCR5 with maraviroc resulted in a significant reduction in monocyte migration (Figure 3B, lower left panel). Combined blockade with metCCL5 or BX41/maraviroc combination further blocked monocyte migration. OCI-Ly18 also induced a significant monocyte invasion compared with the CCL5− cell line OCI-Ly6 (Figure 3B, lower right panel).
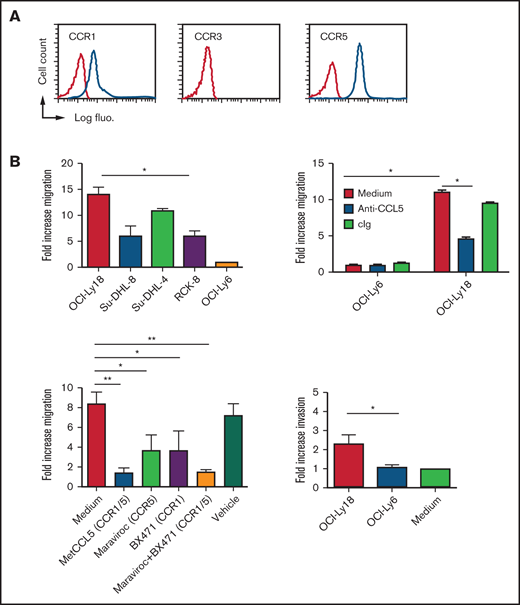
In vitro tumor-derived CCL5 chemotactic activity. (A) Surface expression of CCL5 receptors on CD14+ gated blood monocytes from a healthy donor. Red lines correspond to control Ig staining. Results are representative of 5 healthy donors. (B) Chemoattraction of purified human blood monocytes by the indicated DLBCL cell lines (upper left panel), in the presence of CCL5 antagonism (upper right panel) and in the presence of CCR1/CCR5 antagonism (lower left panel). An invasion assay is also shown (lower right panel). Data (mean ± standard deviation) are representative of 3 independent experiments with 3 donors. *P < .05, **P < .01 vs vehicle-treated group. The fold increase is compared with medium alone. cIg, control Ig; fluo., fluorescence.
In vitro tumor-derived CCL5 chemotactic activity. (A) Surface expression of CCL5 receptors on CD14+ gated blood monocytes from a healthy donor. Red lines correspond to control Ig staining. Results are representative of 5 healthy donors. (B) Chemoattraction of purified human blood monocytes by the indicated DLBCL cell lines (upper left panel), in the presence of CCL5 antagonism (upper right panel) and in the presence of CCR1/CCR5 antagonism (lower left panel). An invasion assay is also shown (lower right panel). Data (mean ± standard deviation) are representative of 3 independent experiments with 3 donors. *P < .05, **P < .01 vs vehicle-treated group. The fold increase is compared with medium alone. cIg, control Ig; fluo., fluorescence.
We next xenografted these 2 DLBCL cell lines in immunodeficient nude mice. We observed 50 ± 11 F4/80+ murine macrophages per square millimeter infiltrating OCI-Ly18 tumors compared with 2.2 ± 2 murine macrophages per square millimeter in OCI-Ly6 tumors (Figure 4A). In this experiment, the activity of human CCL5 in mice is consistent with the high identity (85%) between human and mouse CCL5.23 Flow cytometry analysis after xenograft tumor dissociation further revealed that most of the CD11b+ myeloid cells present in these tumors were F4/80+ macrophages (Figure 4B, left panel). In this model, short-term systemic administration of metCCL5 significantly blocked OCI-Ly18 tumor infiltration by macrophages (Figure 4B, middle panel). Treatment did not affect tumor growth (Figure 4B, right panel). As a second in vivo model, we used humanized NOG mice whose bone marrow produced human CD45+/CD14+ monocytes (Figure 4C, left panel). In this model, we only detected human CD68+ macrophages in OCI-Ly18 lesions (Figure 4C, right panels). In patients, expression of these 2 CCL5 receptors, CCR1 and CCR5, was also observed in DLBCL lesions, and their mRNA expression correlated positively with CCL5 expression in the 4 analyzed data sets (Figure 5A; supplemental Figure 6). Their expression also correlated with the 2 monocyte/macrophage markers CD14 and CD68. This was never the case for CCR3. Flow cytometry analysis of primary DLBCL tumors confirmed that TAMs coexpressed CCR1 and CCR5 (Figure 5B). Taken together, our data show that CCL5 produced by DLBCL tumor cells efficiently recruits blood monocytes in tumor lesions via their expression of CCR1 and CCR5 receptors.
![In vivo tumor-derived CCL5 chemotactic activity. (A) Tumors from nude mice xenografted with DLBCL cell lines were stained for murine macrophages (F4/80; left panels). Scale bar, 50 µm. A quantitative analysis (mean ± standard deviation [SD]) is shown for a group of 5 mice (right panel). ***P < .001 (B) Flow cytometry analysis of myeloid cells recovered from OCI-Ly18 xenograft tumors (left panel). A quantitative analysis (mean ± SD) for the percentage of infiltrating CD11b+/F4/80+ macrophages is shown for a group of 10 mice grafted with the indicated tumors (middle panel). Mice were treated systemically with metCCL5 or control phosphate buffered saline (PBS); tumor volume during treatment (arrows show treatment timepoints) is also shown (right panel). ***P < .001. (C) Bone marrow cells from humanized NOG mice were stained for human CD45 (huCD45) and human CD14 (huCD14; upper left panel). The rectangle denotes the presence of human monocytes. Humanized NOG mouse xenografts of the indicated DLBCL cell lines were stained for human macrophages (CD68; upper right panels). Scale bar, 20 µm. A quantitative analysis (mean ± standard deviation) is shown for a group of 3 mice (lower right panel). fluo., fluorescence.](https://ash.silverchair-cdn.com/ash/content_public/journal/bloodadvances/5/21/10.1182_bloodadvances.2021004203/2/m_advancesadv2021004203f4.png?Expires=1764980911&Signature=dKV6O3RE3We5rIYVUbErZEynlNT4jS-o5LHOFwR1b8Pzdr2X8J4N5GcbnYoDBd5Y4nX480Pq9BYwjX-6sTXllnAFi~B0U2~w5TAQr736Vvu9FjtmYbysCm5M0Lp09tLOP2WvfPowpq9S~~ws1ZGHT~CGD80CK981QOrv~KPx3rY9q45VmJ0KQH0t-nrUsKqvjjsVFEosHX~ymUAHtMA0Nk6jdbueoKgXZicrNOxjwhjOtPWSmBWB4btE5WYwmiOIp-LqmrfSpCo4GDU0lEEJTJt8YAkvB79Ce-v4WvFGqdDV5kqDj7orc0i5XuseACho39c~X07EqUkLqfGKDcs5wg__&Key-Pair-Id=APKAIE5G5CRDK6RD3PGA)
In vivo tumor-derived CCL5 chemotactic activity. (A) Tumors from nude mice xenografted with DLBCL cell lines were stained for murine macrophages (F4/80; left panels). Scale bar, 50 µm. A quantitative analysis (mean ± standard deviation [SD]) is shown for a group of 5 mice (right panel). ***P < .001 (B) Flow cytometry analysis of myeloid cells recovered from OCI-Ly18 xenograft tumors (left panel). A quantitative analysis (mean ± SD) for the percentage of infiltrating CD11b+/F4/80+ macrophages is shown for a group of 10 mice grafted with the indicated tumors (middle panel). Mice were treated systemically with metCCL5 or control phosphate buffered saline (PBS); tumor volume during treatment (arrows show treatment timepoints) is also shown (right panel). ***P < .001. (C) Bone marrow cells from humanized NOG mice were stained for human CD45 (huCD45) and human CD14 (huCD14; upper left panel). The rectangle denotes the presence of human monocytes. Humanized NOG mouse xenografts of the indicated DLBCL cell lines were stained for human macrophages (CD68; upper right panels). Scale bar, 20 µm. A quantitative analysis (mean ± standard deviation) is shown for a group of 3 mice (lower right panel). fluo., fluorescence.
In vivo tumor-derived CCL5 chemotactic activity. (A) Tumors from nude mice xenografted with DLBCL cell lines were stained for murine macrophages (F4/80; left panels). Scale bar, 50 µm. A quantitative analysis (mean ± standard deviation [SD]) is shown for a group of 5 mice (right panel). ***P < .001 (B) Flow cytometry analysis of myeloid cells recovered from OCI-Ly18 xenograft tumors (left panel). A quantitative analysis (mean ± SD) for the percentage of infiltrating CD11b+/F4/80+ macrophages is shown for a group of 10 mice grafted with the indicated tumors (middle panel). Mice were treated systemically with metCCL5 or control phosphate buffered saline (PBS); tumor volume during treatment (arrows show treatment timepoints) is also shown (right panel). ***P < .001. (C) Bone marrow cells from humanized NOG mice were stained for human CD45 (huCD45) and human CD14 (huCD14; upper left panel). The rectangle denotes the presence of human monocytes. Humanized NOG mouse xenografts of the indicated DLBCL cell lines were stained for human macrophages (CD68; upper right panels). Scale bar, 20 µm. A quantitative analysis (mean ± standard deviation) is shown for a group of 3 mice (lower right panel). fluo., fluorescence.
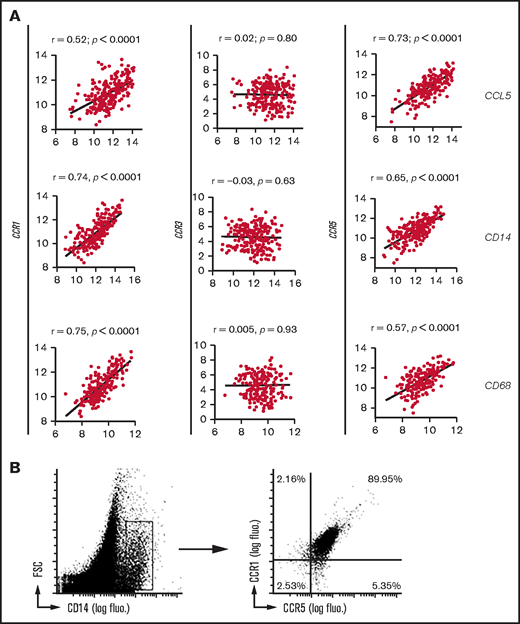
CCL5 receptor expression on TAMs from DLBCL tumor lesions. (A) Correlation plots for CCL5, CD14, or CD68 and CCR1/CCR3/CCR5 mRNA expressions obtained from the GSE10846 DLBCL data set. P values and Pearson correlation coefficients (r) are shown. (B) Flow cytometry analysis of human primary DLBCL tumors for CCR1/CCR5 expression. Cells were gated on CD14 expression. Results are representative of 3 DLBCL patients. fluo. fluorescence; FSC, forward scatter.
CCL5 receptor expression on TAMs from DLBCL tumor lesions. (A) Correlation plots for CCL5, CD14, or CD68 and CCR1/CCR3/CCR5 mRNA expressions obtained from the GSE10846 DLBCL data set. P values and Pearson correlation coefficients (r) are shown. (B) Flow cytometry analysis of human primary DLBCL tumors for CCR1/CCR5 expression. Cells were gated on CD14 expression. Results are representative of 3 DLBCL patients. fluo. fluorescence; FSC, forward scatter.
Noncanonical tumor-associated macrophages are frequent in DLBCL
In an effort to better characterize TAMs in DLBCL lesions, we first observed that they were heterogeneous, with the presence of canonical M2-macrophages identified by the expression of the scavenger receptor CD163, as well as CD163− non-M2–macrophages (59% ± 2.3% and 41% ± 9.7%, respectively) (Figure 6A). We next performed a single-cell analysis with a set of genes defined from recently published characterizations of M1- and M2-like TAMs.24-27 Fifty-seven individual TAM cells from 3 TAMhigh CCL5-expressing primary DLBCL tumors were analyzed for their expression of M1- and M2-like genes. This analysis confirmed the heterogeneity of CD163 expression, with 54.4% of TAMs expressing this marker. It also identified heterogeneity of expression for CD86. Next, CD86 and CD163 positivity was used to identify M1 and M2 subsets, respectively. Notably, most of the M2 and M1 cells coexpressed genes associated with the M1 and M2 signatures, respectively (Figure 6B). This allowed us to define M1M2 cells as CD86+ or CD163+ TAMs coexpressing ≥1 additional M2 and M1 marker, respectively. The percentage of M2 cells with the coexpression of at least a second M2 gene (52% ± 15%) was not statistically different from M2 cells with the coexpression of at least a second M1 gene (42% ± 9%; P = .6). Similarly, the percentage of M1 cells coexpressing a second M1 gene (54% ± 15%) was not statistically different from the percentage of M1 cells coexpressing a second M2 gene (45% ± 14%; P = .6). We further observed that up to 4 of 5 M1 genes and 6 of 7 M2 genes considered in our study could be coexpressed in a single M2 or M1 cell, respectively (Figure 6C). We next pursued our phenotyping of noncanonical M1M2 macrophages by focusing on CD163+CD86+ cells, because these markers are among the most commonly used for characterization of M2 and M1 TAMs, respectively (Figure 6D). All CD163+CD86+ cells were positive for transcription of the antigen-presenting molecule HLA-DR and the proangiogenic VEGFA. About half or more of these cells were positive for the scavenger receptor CD36, the anti-inflammatory cytokines IL10 and TGF-β1, and the proinflammatory cytokines IL1β and IL8. Fewer than 30% of the cells were positive for the scavenger receptor CD206 and the antioxidant enzyme that is prone to inflammation resolution, HMOX-1. Finally, none of them were positive for the proapoptotic TRAIL. Notably, the mRNA expression level in noncanonical M1M2 cells was similar to the one observed in canonical M1 and M2 cells (Figure 6E). Flow cytometry analysis, at the protein level, of the same 3 patients revealed that it was possible to identify M1 CD86+CD163− macrophages (Figure 6F, left panel). Among the CD163+ cells, we noticed that 2 populations differed significantly with regard to CD86 expression (Figure 6F, middle panel). We considered CD86low/CD163+ and CD86high/CD163+ cells as M2 and M1M2 noncanonical cells, respectively. With this gating, canonical M1 and M2 TAMs represented 15.74% ± 1.2% and 21.1% ± 4.76%, respectively, of CD68+ macrophages in DLBCL lesions. The majority (49.2% ± 5.3%) were noncanonical. Further analysis of these latter cells for surface receptor expression revealed results that were highly consistent with mRNA single-cell data; they all expressed HLA-DR+, whereas only a fraction expressed CD36+ and CD206+ (Figure 6F, right panel). Taken together, these data show the presence of TAMs in DLBCL with a noncanonical signature.
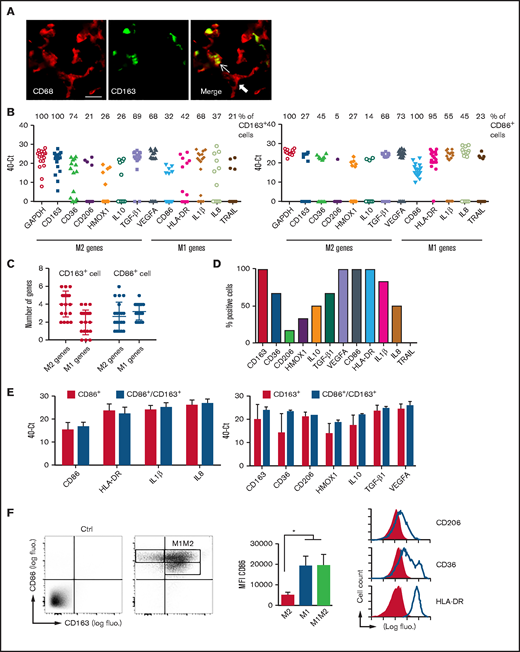
Polarization profile of TAMs in DLBCL. (A) Sections of DLBCL biopsies were stained by immunofluorescence for CD68 and CD163. Thin and thick arrows show an M2 and non-M2 macrophage, respectively. Photographs are representative of 10 patients. Scale bar, 10 µm. (B) Signal intensity (40−Ct value) of the indicated genes in CD163+ (left panel) and CD86+ (right panel) single cells. The percentage of CD163+ M2 and CD86+ M1 macrophages coexpressing the indicated M1 and M2 genes is shown on top of the panels. (C) The number of M1/M2 genes expressed in CD163+ M2 and CD86+ M1 single cells. (D) Phenotypic description of CD86+CD163+ noncanonical M1M2 macrophages at the mRNA level. (E) Expression levels (40−Ct value) of M1 genes in CD86+ M1 macrophages compared with CD86+CD163+ M1M2 cells (left panel) and expression levels of M2 genes in CD163+ M2 macrophages compared with CD86+CD163+ M1M2 cells (right panel). (F) Frozen DLBCL cell suspensions were analyzed by flow cytometry for expression of canonical CD86 M1 and CD163 M2 markers on gated CD68+ TAMs (left panel). Staining with control antibodies to determine the gating is also shown. Mean ± standard deviation (SD) fluorescence (fluo.) intensity for CD86 on the 3 TAM subtypes (middle panel). Surface expression of receptors in noncanonical M1M2 macrophages (right panel). Shaded line graphs represent isotype control. Data are mean ± SD and are representative of the 3 DLBCL patients shown in Figure 5B. *P < .05. IL, interleukin; TGF-β1, transforming growth factor β1; VEGFA, vascular endothelial growth factor A.
Polarization profile of TAMs in DLBCL. (A) Sections of DLBCL biopsies were stained by immunofluorescence for CD68 and CD163. Thin and thick arrows show an M2 and non-M2 macrophage, respectively. Photographs are representative of 10 patients. Scale bar, 10 µm. (B) Signal intensity (40−Ct value) of the indicated genes in CD163+ (left panel) and CD86+ (right panel) single cells. The percentage of CD163+ M2 and CD86+ M1 macrophages coexpressing the indicated M1 and M2 genes is shown on top of the panels. (C) The number of M1/M2 genes expressed in CD163+ M2 and CD86+ M1 single cells. (D) Phenotypic description of CD86+CD163+ noncanonical M1M2 macrophages at the mRNA level. (E) Expression levels (40−Ct value) of M1 genes in CD86+ M1 macrophages compared with CD86+CD163+ M1M2 cells (left panel) and expression levels of M2 genes in CD163+ M2 macrophages compared with CD86+CD163+ M1M2 cells (right panel). (F) Frozen DLBCL cell suspensions were analyzed by flow cytometry for expression of canonical CD86 M1 and CD163 M2 markers on gated CD68+ TAMs (left panel). Staining with control antibodies to determine the gating is also shown. Mean ± standard deviation (SD) fluorescence (fluo.) intensity for CD86 on the 3 TAM subtypes (middle panel). Surface expression of receptors in noncanonical M1M2 macrophages (right panel). Shaded line graphs represent isotype control. Data are mean ± SD and are representative of the 3 DLBCL patients shown in Figure 5B. *P < .05. IL, interleukin; TGF-β1, transforming growth factor β1; VEGFA, vascular endothelial growth factor A.
DLBCL patient survival based on CD68 and CCL5 expression
We next analyzed the modulation of patient survival in the 4 data sets used here by CD68 and CCL5 mRNA expression levels. It was not possible to define any threshold for CD68 that positively or negatively modulated patient survival in 3 of the 4 data sets (Figure 7). The fourth dataset showed an increased risk in the high-expression group. CCL5 stratification gave different results, with 1 data set showing no modulation and 2 data sets showing a lower risk in the high expression groups. The data set showing an increased risk for high expression of CD68 behaved similarly for CCL5. Taken together, this analysis shows that CCL5 production by tumor cells and TAM infiltration have a variable impact on DLBCL patient clinical outcome.
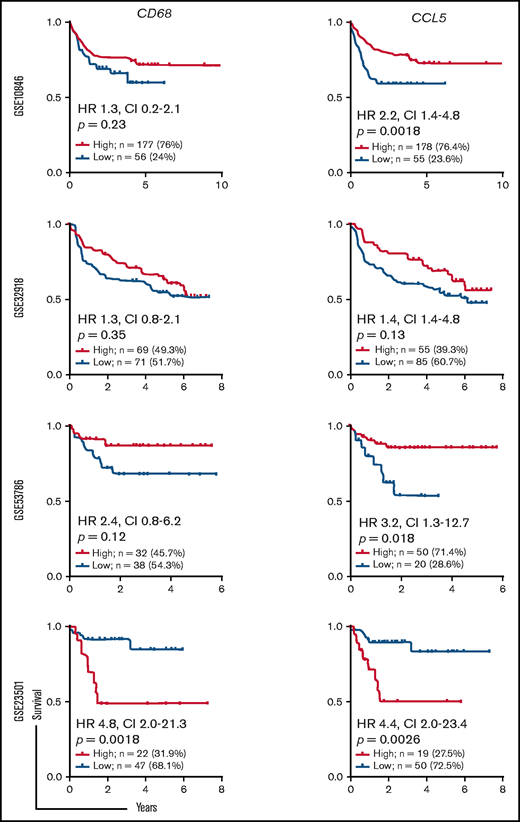
Impact of CD68 and CCL5 expression on the survival of patients with DLBCL. The patients treated with R-CHOP from the indicated data sets were analyzed for the prognostic value of CD68 (left panels) and CCL5 (right panels) mRNA expression. Overall survival is shown. Log-rank P values, hazard ratios (HR), and confidence intervals (CI) are shown.
Impact of CD68 and CCL5 expression on the survival of patients with DLBCL. The patients treated with R-CHOP from the indicated data sets were analyzed for the prognostic value of CD68 (left panels) and CCL5 (right panels) mRNA expression. Overall survival is shown. Log-rank P values, hazard ratios (HR), and confidence intervals (CI) are shown.
Discussion
By screening chemokine expression in DLBCL, we only found CCL5 as a chemokine acting on monocytes upregulated in some patients/cell lines. We did not detect expression of CCL1, CCL2, CCL3, or CCL4. This is consistent with several previous observations. At the protein level, CCL5 was detected in 1 sample of primary DLBCL, 3 DLBCL cell lines established from patients, and 7 of 7 Epstein-Barr virus–transformed DLBCL-like lymphoblastoid cell lines.28-30 Evidence also exists arguing for a chemotactic role for CCL5 in these tumors. Indeed, CCR1 was co-upregulated with CCL5 in 4 of 4 primary DLBCL samples compared with control lymph nodes, and the pair CCR1/CCR5 was part of the top 5 neighbor genes of CLL5 at the gene expression level.31,32 In the latter study, CCL5 mRNA was not detected in other non-Hodgkin B-cell lymphomas, such as chronic lymphocytic leukemia and follicular lymphoma. In the present study, we did not find evidence at the mRNA or protein level of CCL5 expression in healthy B cells using cells originating from tonsil, no matter their stage of differentiation, arguing in favor of a posttransformation event for the induction of CCL5 in DLBCL. It should be noted that Mueller et al reported CCL5 mRNA in healthy B cells from peripheral blood.28 CCL5 expression was not dependent on the cell of origin based on the ABC/GC classification. New DLBCL classifications have recently emerged based on genetic alterations.33,34 CCL5 was not part of the genes showing recurrent mutations. Its locus also was not targeted by the chromosomal modifications identified in studies used to define the new DLBCL clusters. Finally, screening of the identified chromosome modifications in the set of DLBCL cell lines used here did not reveal a common targeted chromosome in the CCL5+ and CCL5− subgroups. We observed that 5 of 5 CCL5− DLBCL cell lines started to produce this chemokine after treatment with epigenetic modulators targeting histone deacetylation and DNA demethylation, further arguing in favor of a posttransformation event at the origin of CCL5 induction in DLBCL. However, the latter should be taken with caution given the unknowns regarding DLBCL (epi)genetics.
In an in vitro migration/invasion assay and in 2 in vivo animal models, we further demonstrated that CCL5-producing DLBCL cell lines were able to chemoattract blood monocytes. The chemoattraction of blood monocytes is a likely explanation for the infiltration of TAMs into DLBCL lesions. TAM infiltration in DLBCL is variable, and several DLBCL cohorts have been studied with regard to the impact of TAMs on patient clinical outcome. As stated in the Introduction, results vary. Our present analysis of the expression levels of CD68 mRNA in 4 other cohorts, all consisting of patients treated with R-CHOP, further confirm that TAMs may not modulate clinical outcomes significantly, at least in some patients. The single-cell analysis of TAMs performed here may provide an explanation for the frequent lack of TAMs’ impact reported in DLBCL. Indeed, we observed that most macrophages present in DLBCL lesions coexpress M1 and M2 markers, allowing the classification of these cells as noncanonical macrophages. Obviously, our conclusion is based on gene expression levels, and we are not providing any functional data with regard to tumor development with these noncanonical macrophages. However, it is striking to note that the expression levels of the M1/M2 functional markers analyzed here are not different from noncanonical macrophages, strongly suggesting that they may perform a similar function. Noncanonical TAMs have been reported in glioma and breast cancers.35,36 To the best of our knowledge, this is the first time that noncanonical macrophages have been observed in DLBCL.
We also studied the modulation of patient clinical outcome by CCL5 expression level. Despite the fact that preclinical data indicated a promoting role for CCL5 in diabetic mice,37 results varied from 1 cohort to another but were extremely different from the ones obtained with CD68. The latter is explained by the fact that CCL5 acts on cell types other than monocytes. Indeed, it acts on eosinophils and T cells.38 A potential role in mast cells has also been reported.39 In hematological malignancies, Hodgkin lymphoma (HL) is the best-known neoplasm that constitutively produces CCL5.40 CCL5 also recruits monocytes and other cells in HL.41 The development of HL is highly dependent on its microenvironment. Although patient survival studies and CCL5 expression are lacking, high CCL5 expression is likely to be an adverse parameter because of its promoting role demonstrated in preclinical models. In this cancer, an autocrine-promoting loop has been demonstrated because the tumor cells express CCL5 and one of its receptors (CCR5). Inhibition of this loop using an anti-CCL5 antibody impairs in vitro growth of HL tumors.42 In HL, it is believed that CCL5 is also produced by and acts on environmental cells. Maraviroc (CCR5 antagonism) treatment inhibits HL development in xenograft experiments.41 We did not find any such role by using metCCL5 as an antagonist of CCR1 and CCR5 in our in vivo model. This is likely due to the fact that no tumor autocrine loop of CCL5/CCR5 exists in DLBCL, because DLBCLs have not been reported to express CCL5 receptors. In addition, CCL5 expression in DLBCL tumors is more restricted because it is only produced by tumor cells. Taken together, our study highlights the fact that TAM depletion or CCL5 targeting may not be efficient in some DLBCL patients.
Acknowledgments
This work was supported by la ligue contre le cancer (committee 38 and 73), the fonds européen de développement régional, and the région Auvergne/Rhône-Alpes (B.H.).
Authorship
Contribution: M.A.-L. and B.H. designed the study; B.M. and M.Q. performed experiments; M.D.G. and M.A.-L. performed single-cell analyses; J.M. and B.M. analyzed data sets; S.T. and J.-F.M. generated humanized NOG mice; C.R. provided human tonsils; N.S. provided human DLBCL; B.M., M.A.-L., and B.H. analyzed data; and B.M. and B.H. wrote the manuscript.
Conflict-of-interest disclosure: The authors declare no competing financial interests.
Correspondence: Benoît Manfroi, Institut Necker Enfants Malades, INSERM U1151, CNRS UMR 8253, 156 rue de Vaugirard, 75015 Paris, France; e-mail: benoit.manfroi@inserm.fr.

