

Key Points
OxPhos inhibition induces mitochondrial trafficking from BM stroma cells to AML cells accompanied by mitochondrial fission and mitophagy.
Mitochondrial coupling and crosstalk with BM stroma cells facilitate the development of AML cell resistance to OxPhos inhibition.

Abstract
Acute myeloid leukemia (AML) cells are highly dependent on oxidative phosphorylation (OxPhos) for survival, and they continually adapt to fluctuations in nutrient and oxygen availability in the bone marrow (BM) microenvironment. We investigated how the BM microenvironment affects the response to OxPhos inhibition in AML by using a novel complex I OxPhos inhibitor, IACS-010759. Cellular adhesion, growth, and apoptosis assays, along with measurements of expression of mitochondrial DNA and generation of mitochondrial reactive oxygen species indicated that direct interactions with BM stromal cells triggered compensatory activation of mitochondrial respiration and resistance to OxPhos inhibition in AML cells. Mechanistically, inhibition of OxPhos induced transfer of mitochondria derived from mesenchymal stem cells (MSCs) to AML cells via tunneling nanotubes under direct-contact coculture conditions. Inhibition of OxPhos also induced mitochondrial fission and increased functional mitochondria and mitophagy in AML cells. Mitochondrial fission is known to enhance cell migration, so we used electron microscopy to observe mitochondrial transport to the leading edge of protrusions of AML cells migrating toward MSCs. We further demonstrated that cytarabine, a commonly used antileukemia agent, increased mitochondrial transfer of MSCs to AML cells triggered by OxPhos inhibition. Our findings indicate an important role of exogenous mitochondrial trafficking from BM stromal cells to AML cells as well as endogenous mitochondrial fission and mitophagy in the compensatory adaptation of leukemia cells to energetic stress in the BM microenvironment.
Introduction
The interaction between stromal cells in the bone marrow (BM) microenvironment with acute myeloid leukemia (AML) cells promotes the survival of AML cells.1-3 AML cells are also highly dependent on oxidative phosphorylation (OxPhos) and continually adapt to fluctuations in nutrient and oxygen availability in the BM microenvironment.4-7 In a previous study, we reported anti-AML activity of the first-in-class OxPhos inhibitor IACS-010759, whose mechanisms of action include deprivation of energy, depletion of aspartate, and increase in intracellular reactive oxygen species (ROS).8 Recent studies demonstrated that ROS trigger BM stromal cells to transfer their mitochondria to leukemia cells through tunneling nanotubes (TNTs) under conditions of stress or chemotherapy.9-11 Transfer of functional mitochondria has been shown to increase mitochondrial respiration and the production of adenosine triphosphate in recipient cells, leading to improved functional activity.12
In preclinical studies, the majority of AML tumor models were responsive to OxPhos inhibition through targeting of complex I,8 but it is unknown how the BM microenvironment affects these responses. Despite promising preclinical studies, carboxyamidotriazole, a putative complex I inhibitor, failed to demonstrate clinical benefit in multiple solid tumors.13 The phase I trial of BAY87-2243 (a novel complex I inhibitor that demonstrated antitumor efficacy without toxicity in mice) was terminated because of unexpected toxicities in humans.14 These findings indicate the narrow therapeutic window of OxPhos inhibitors that have limited potency in humans and support the need for relevant preclinical models geared toward understanding mitochondrial biogenesis and the crosstalk between tumor cells and their microenvironment.
In this study, we investigated the mechanisms by which the BM microenvironment facilitates development of secondary resistance to OxPhos inhibition in AML cells. We observed that treatment with an OxPhos inhibitor (OxPhosi) induced adhesion of AML cells to BM mesenchymal stem cells (MSCs), formation of TNTs, mitochondrial transfer from MSCs to AML cells, and mitochondrial fission. The mitochondria transferred from MSCs were then degraded by mitophagy in AML cells. Our findings indicate that under conditions of OxPhos inhibition, AML cells successfully replenish functional mitochondria through exogenous transfer of mitochondria supplied by MCSs and endogenous fission of healthy mitochondria. These processes together facilitate the development of resistance to OxPhos inhibition in AML cells by maintaining their mitochondrial function.
Methods
Primary samples, cell lines, culture conditions, and reagents
Primary AML cells were obtained from 26 AML patients, and primary MSCs were obtained from healthy donor BM. OxPhosi-sensitive OCI-AML3 cells,8 OxPhosi-resistant MOLM13 cells,8 U937 cells,8 and MSCs were transduced with lentiviral vectors encoding a fusion of the sequence of a mitochondrial matrix enzyme (pyruvate dehydrogenase E1 alpha 1 [PDHA1]) to the amino terminus of the green fluorescent protein copGFP (AML cells) or of the red fluorescent protein dsRed (MSCs). The OxPhosi IACS-0107598 was obtained from the Institute for Applied Cancer Science at MD Anderson Cancer Center (Houston, TX). Cytarabine, cytochalasin D, the intercellular adhesion molecule 1 (ICAM-1) neutralizing antibody, natalizumab, dansylcadaverine, and bafilomycin were used as described.
Types of cell analyses
Cell viability and proliferation were assessed by cell counters using the Trypan blue exclusion method or MTS assays. Apoptotic cell death was analyzed by annexin V/propidium iodide staining and flow cytometry as described elsewhere.15 Total cellular ROS production was quantified by using a CellROX Deep Red Flow Cytometry Assay Kit. The cap analysis gene expression (CAGE) protocol was described previously.16 Normalized data were subjected to EdgeR and DEGseq (an R package for identifying differentially expressed genes from RNA sequencing data)17,18 ; gene set enrichment analysis19 was performed to determine differences in expression in gene promoters. Adhesion of AML cells to MSCs was assessed by adhesion assays described elsewhere.20
The Seahorse XF24 Extracellular Flux analyzer (Seahorse Bioscience) was used to measure the oxygen consumption rate (OCR) of OCI-AML3 and MOLM13 cells and MSCs according to the manufacturer’s instructions.21 Briefly, AML cells were cultured with or without the indicated concentrations of IACS-010759 and/or an anti-ICAM-1 antibody in the presence or absence of MSCs for 2 hours. Before use in the extracellular flux assays, cocultured AML cells were separated from the MSC monolayer by careful pipetting. AML cells were counted, and 5 × 10⁵ cells were added to each well for the extracellular flux assays. For MSCs, 6 × 10⁴ cells were added to each well with or without treatment by IACS-010759 (30 nM) for 2 hours. Three technical replicates for each condition were plated.
Immunoblot analysis was performed as previously described.15 OCI-AML3 and MOLM13 cells stably transfected with PDHA1-GFP and/or MSCs transfected with PDHA1-dsRed were plated . Confocal fluorescence images were captured with a confocal microscope. We used a Mitophagy Detection Kit (Dojindo Molecular Technologies) to detect mitophagy.22 Mitochondrial membrane potentials were measured by using a JC-1 Mitochondrial Membrane Potential Assay Kit. For electron microscopy analysis, cells were fixed with 2% glutaraldehyde, and for immunoelectron microscopy analysis, cells were fixed with 2% paraformaldehyde and 0.025% glutaraldehyde and were examined by using a Hitachi HT7700 transmission electron microscope. A Human Mitochondrial DNA Monitoring Primer Set (Takara Bio) was used for quantitative polymerase chain reaction.
In vivo mouse experiments for CAGE analysis
NOD-scid IL2Rγnull (NSG) mice 6 to 8 weeks old were injected with 1 million AML patient-derived xenograft (PDX) cells. Four weeks after confirmation of engraftment in peripheral blood by hCD45+ flow cytometry, the mice were randomly assigned to receive IACS-010759 (5.0 mg/kg; 5 days on and 2 days off) or vehicle (solvent-only control) by oral gavage (n = 3 in each group). Mice were euthanized when full engraftment was detected by flow cytometry or when any sign of morbidity was observed. Spleen cells were collected and enriched for human cells by depletion of mouse cells with an EasySep Mouse/Human Chimera Isolation Kit.
Murine/human mtDNA quantification in the in vivo mouse model
Human primary AML cells were injected into NSG mice. The ratio of murine to human mitochondrial DNA (mtDNA) in spleen-resident AML cells was determined after oral treatment once per day with IACS-010759 (5.0 mg/kg per day; 5 days on and 2 days off for 21 days) or vehicle using the Mouse Feeder Cell Quantification Kit.
Statistical analyses
GraphPad Prism 9 was used for statistical analysis. All values are expressed as the mean ± standard deviation (SD). Differences between groups were assessed by 2-way analysis of variance or Student t test. P < .05 was considered statistically significant. Additional details regarding methods are provided in the supplemental Materials and Methods.
Results
OxPhos inhibition activates cell adhesion in AML cells
We first investigated the role of BM stromal cells, the obligate component of the BM microenvironment, in the resistance of AML cells to OxPhos inhibition. Because availability of primary AML cells was limited, we used OxPhosi-sensitive and OxPhos-dependent OCI-AML3 cells and OxPhosi-resistant MOLM13 and U937 cells.8 As shown in Figure 1A, MSC coculture reduced the inhibitory effects of IACS-010759 on cell growth in sensitive OCI-AML3 cells but not in resistant MOLM13 cells. IACS-010759-induced inhibition of cell growth was also significantly reduced by coculturing less sensitive U937 cells with MSCs. No significant inhibition of cell growth by IACS-010759 was observed in MSCs.
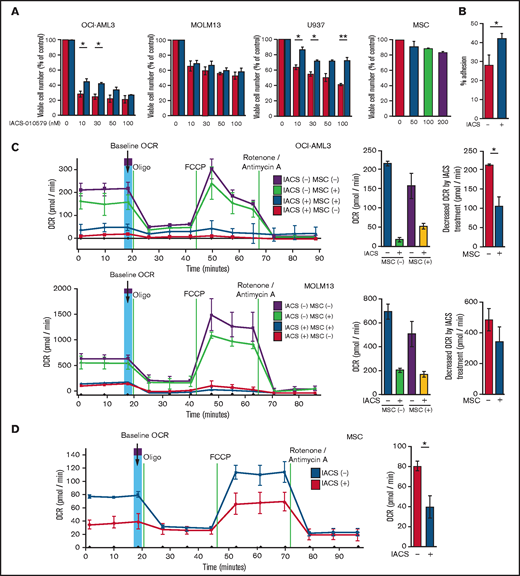
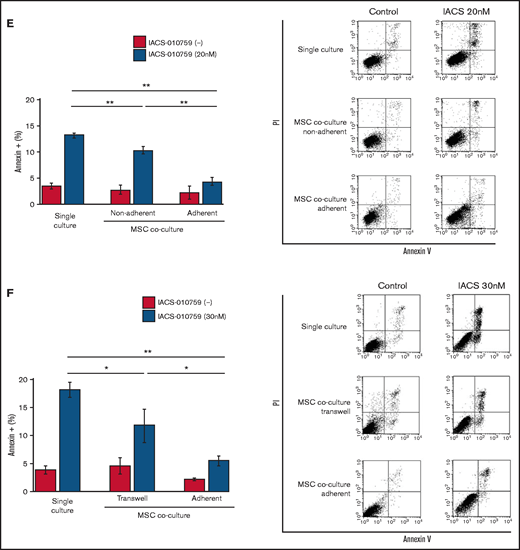
Differentially expressed promoters in OxPhosi-resistant and OxPhosi-sensitive AML cells cocultured with MSCs are associated with reduced antileukemic efficacy of OxPhos inhibition. (A) OCI-AML3, MOLM13, and U937 cells were treated with the indicated doses of the OxPhosi IACS-010759 for 72 hours in the presence or absence of MSCs. The number of viable cells (percent of control) was determined with a Vi-Cell XR cell counter using the trypan blue exclusion method. Gray bars, cultured without MSCs; black bars, cultured with MSCs. MSCs were treated with IACS-010759 for 72 hours in single-culture conditions. (B) Adhesion of OCI-AML3 cells to cocultured MSCs. OCI-AML3 cells were cultured on MSCs for 48 hours with or without IACS-010759 (30 nM). Adherent cells were counted as described in the supplemental Materials and Methods. (C) The OCR was measured by extracellular flux assay in OCI-AML3 and MOLM13 cells treated with IACS-010759 (30 nM) with or without MSCs for 2 hours. Cocultured AML cells were separated from the MSC monolayer by careful pipetting before the extracellular flux assay. A total of 5 × 10⁵ cells per well were used. Three technical replicates for each condition were plated. During the assay, oligomycin (Oligo), carbonyl cyanide-p-trifluoromethoxyphenylhydrazone (FCCP), rotenone, and antimycin A were added according to the manufacturer’s instructions as described in the supplemental Materials and Methods. Representative of the results from 3 independent Cell Mito Stress Tests, and calculated values for the baseline OCR (indicated by the arrow) are shown. Comparisons of the reductions in OCR by treatment with IACS-010759 (IACS) between the single-culture condition and MSC coculture condition are shown on the right. (D) OCR was measured by extracellular flux assay in MSCs treated with IACS-010759 (30 nM) for 2 hours. A total of 6 × 10⁴ cells per well were used. Three technical replicates for each condition were plated. During the assay, oligomycin, FCCP, rotenone, and antimycin A were added according to the manufacturer’s instructions. Representative Cell Mito Stress Test results (n = 3), and calculated values for the baseline OCR (indicated by the arrow) are shown. (E-F) OCI-AML3 cells were treated with 20 nM or 30 nM IACS-010759 for 72 hours in the presence or absence of MSCs. Nonadherent OCI-AML3 cells were separated from the MSC monolayer by careful pipetting. OCI-AML3 cells that adhered to MSCs were separated from cocultured MSCs by magnetic-activated cell sorting (MACS) using anti-CD45 microbeads after trypsinization as described in panel E (supplemental Materials and Methods) or (F) separated by the transwell insert into upper and lower compartments. Apoptosis of treated cells was detected by staining with annexin V-fluorescein isothiocyanate (FITC)/propidium iodide (PI) and an anti-CD45 allophycocyanin (APC)-conjugated antibody using flow cytometry. Representative flow cytometry plots showing annexin V (x-axis) and PI (y-axis) staining are shown on the right . Error bars in the graphs show the means ± SDs of the results from 3 independent experiments. *P < .05; **P < .01.
Differentially expressed promoters in OxPhosi-resistant and OxPhosi-sensitive AML cells cocultured with MSCs are associated with reduced antileukemic efficacy of OxPhos inhibition. (A) OCI-AML3, MOLM13, and U937 cells were treated with the indicated doses of the OxPhosi IACS-010759 for 72 hours in the presence or absence of MSCs. The number of viable cells (percent of control) was determined with a Vi-Cell XR cell counter using the trypan blue exclusion method. Gray bars, cultured without MSCs; black bars, cultured with MSCs. MSCs were treated with IACS-010759 for 72 hours in single-culture conditions. (B) Adhesion of OCI-AML3 cells to cocultured MSCs. OCI-AML3 cells were cultured on MSCs for 48 hours with or without IACS-010759 (30 nM). Adherent cells were counted as described in the supplemental Materials and Methods. (C) The OCR was measured by extracellular flux assay in OCI-AML3 and MOLM13 cells treated with IACS-010759 (30 nM) with or without MSCs for 2 hours. Cocultured AML cells were separated from the MSC monolayer by careful pipetting before the extracellular flux assay. A total of 5 × 10⁵ cells per well were used. Three technical replicates for each condition were plated. During the assay, oligomycin (Oligo), carbonyl cyanide-p-trifluoromethoxyphenylhydrazone (FCCP), rotenone, and antimycin A were added according to the manufacturer’s instructions as described in the supplemental Materials and Methods. Representative of the results from 3 independent Cell Mito Stress Tests, and calculated values for the baseline OCR (indicated by the arrow) are shown. Comparisons of the reductions in OCR by treatment with IACS-010759 (IACS) between the single-culture condition and MSC coculture condition are shown on the right. (D) OCR was measured by extracellular flux assay in MSCs treated with IACS-010759 (30 nM) for 2 hours. A total of 6 × 10⁴ cells per well were used. Three technical replicates for each condition were plated. During the assay, oligomycin, FCCP, rotenone, and antimycin A were added according to the manufacturer’s instructions. Representative Cell Mito Stress Test results (n = 3), and calculated values for the baseline OCR (indicated by the arrow) are shown. (E-F) OCI-AML3 cells were treated with 20 nM or 30 nM IACS-010759 for 72 hours in the presence or absence of MSCs. Nonadherent OCI-AML3 cells were separated from the MSC monolayer by careful pipetting. OCI-AML3 cells that adhered to MSCs were separated from cocultured MSCs by magnetic-activated cell sorting (MACS) using anti-CD45 microbeads after trypsinization as described in panel E (supplemental Materials and Methods) or (F) separated by the transwell insert into upper and lower compartments. Apoptosis of treated cells was detected by staining with annexin V-fluorescein isothiocyanate (FITC)/propidium iodide (PI) and an anti-CD45 allophycocyanin (APC)-conjugated antibody using flow cytometry. Representative flow cytometry plots showing annexin V (x-axis) and PI (y-axis) staining are shown on the right . Error bars in the graphs show the means ± SDs of the results from 3 independent experiments. *P < .05; **P < .01.
To investigate the molecular mechanisms of resistance to OxPhos inhibition, we performed CAGE transcriptome analyses23 on OCI-AML3 cells that were cultured with or without BM-derived MSCs in the absence or presence of 30 nM IACS-010759 for 15 hours. In OCI-AML3 cells cocultured with MSCs (supplemental Figure 1), inhibition of OxPhos upregulated the gene signatures of adhesion-related extracellular organization and tube morphogenesis (supplemental Table 1). In contrast, inhibition of OxPhos activated the endoplasmic reticulum stress response and intrinsic apoptotic signaling pathways without affecting adhesion-related pathways in OCI-AML3 cells cultured alone. To evaluate whether inhibition of OxPhos enhances the adhesion of AML cells to MSCs, we analyzed the adhesion of OCI-AML3 cells to MSCs using a coculture system. A concentration of 30 nM IACS-010759 significantly stimulated the adherence of OCI-AML3 cells to MSCs (Figure 1B).
We then performed CAGE analysis using peripheral blood samples from 26 patients with primary AML. Table 1 shows the clinical information for the patients from whom samples were obtained, including driver genetic mutations. The sensitivity of primary AML cells from each patient was detected by treatment with 100 nM IACS-010759 for 72 hours. The samples were then classified as sensitive (n = 16) or resistant (n = 10) depending on the fold increase in the percentage of annexin V+ cells, with an arbitrary cutoff value of 3.0 (supplemental Figure 2). To assess differences in baseline promoter gene expression between sensitive and resistant cells, we conducted CAGE analysis on untreated primary AML cells. Analysis using the Bioconductor EdgeR package (log2 fold change, >2.0; false discovery rate [FDR], <0.05) detected 16 gene promoters with higher baseline expression in OxPhosi-resistant AML samples than in sensitive samples. Most of these genes were related to cell adhesion, migration, and the rho GTPase family of genes, which modulates intracellular actin dynamics (Table 2). We observed a modest increase in expression of the promoters of the cell adhesion–related gene C2CD4B24 and of the rho GTPase family genes RET,25 RCBTB2,26 and RASL11A27 in OxPhosi-resistant AML samples compared with sensitive ones (log2 fold change, >2.0; FDR, <0.01 [EdgeR]) (supplemental Figure 3).
Clinical characteristics of patients with AML whose samples were used for CAGE analysis
| Patient No. | IACS-010759 sensitivity | Diagnosis | % Blast | Mutation status |
|---|---|---|---|---|
| 1 | Sensitive | AML | 78 | NRAS |
| 2 | Sensitive | AML | 74 | CEPBA; BCR-ABL1, E1A2 |
| 3 | Sensitive | AML | 93 | FLT3-ITD, IDH1, NPM1 |
| 4 | Sensitive | AMOL | 76 | DNMT3A, IDH1, NPM1, FLT3-D835+V491L |
| 5 | Sensitive | AML | 19 | EZH2, KRAS, NPM1, TET2, RUNX1 |
| 6 | Sensitive | AML | 52 | FLT3-D835, NPM1 |
| 7 | Sensitive | AML | 96 | NRAS, TET2, AML1-ETO |
| 8 | Sensitive | AML | 64 | GATA2, CEPBA |
| 9 | Sensitive | AML | 94 | FLT3-D835, IDH2, RUNX1, WT1 |
| 10 | Sensitive | AML | 22 | ASXL1, GATA1, JAK2 |
| 11 | Sensitive | AML | 87 | CEPBA, FLT3-ITD, WT1 |
| 12 | Sensitive | AMOL | 73 | IDH2, NPM1 |
| 13 | Sensitive | AML | 58 | DNMT3A, NRAS, TET2 |
| 14 | Sensitive | AML | 15 | ASXL1, IDH1, JAK2 |
| 15 | Sensitive | AML | 23 | CEPBA, ASXL1, EZH2, TET2 |
| 16 | Sensitive | AML | 88 | FLT3-ITD, WT1 |
| 17 | Resistant | AMML | 21 | IDH1, DNMT3A, NPM1, NRAS |
| 18 | Resistant | AML | 18 | Negative |
| 19 | Resistant | AML | 90 | NRAS |
| 20 | Resistant | AML | 80 | DNMT3A, JAK2, KIT, NRAS, RUNX1, TET2, WT1 |
| 21 | Resistant | AML | 34 | Negative |
| 22 | Resistant | AML | 74 | RUNX1, TET2, TP53 |
| 23 | Resistant | AML | 26 | FLT3-D835, NRAS |
| 24 | Resistant | AMML | 17 | TP53 |
| 25 | Resistant | AML | 81 | IDH1, NOTCH1, TP53 |
| 26 | Resistant | AMOL | 90 | DNMT3A, NPM1, NRAS, TET2 |
AMML, acute myelomonocytic leukemia; AMOL, acute monoblastic leukemia; ITD, internal tandem duplication.
Differently expressed promoters in OxPhosi-resistant and OxPhosi-sensitive primary AML cells from peripheral blood
| Gene | Fold change (log2 >2.0) | P | FDR <0.05 | Adhesion | Migration | Actin cytoskeleton dynamics |
|---|---|---|---|---|---|---|
| Higher in OxPhosi-resistant than OxPhosi-sensitive cells | ||||||
| C2CD4B | 6.788 | 3.67E-07 | 0.0082 | ● | ||
| VPREB3 | 6.292 | 6.13E-07 | 0.0095 | |||
| PHLDB1 | 6.192 | 2.85E-06 | 0.0213 | ● | ||
| FXYD2 | 5.739 | 3.44E-06 | 0.0231 | ● | ● | |
| CAMP | 5.354 | 9.09E-07 | 0.0131 | ● | ● | |
| TRIO | 5.021 | 2.26E-06 | 0.0196 | ● | ● | ● |
| SASH1 | 4.479 | 1.25E-05 | 0.0467 | ● | ||
| LCN6 | 4.366 | 2.27E-06 | 0.0196 | ● | ● | |
| RET | 4.188 | 1.93E-07 | 0.0080 | ● | ● | |
| TCN1 | 3.773 | 1.22E-05 | 0.0466 | ● | ||
| RCBTB2 | 3.660 | 2.85E-07 | 0.0082 | ● | ● | |
| UBR4 | 3.591 | 3.14E-06 | 0.0218 | |||
| FSTL3 | 3.588 | 7.06E-06 | 0.0353 | ● | ● | |
| CXCR1 | 3.539 | 4.22E-06 | 0.0258 | ● | ● | ● |
| RASL11A | 2.623 | 4.64E-07 | 0.0094 | ● | ● | ● |
| FAM55C | 2.353 | 7.34E-06 | 0.0353 | ● | ● | |
| Lower in OxPhosi-resistant than in OxPhosi-sensitive cells | ||||||
| CXCL5 | −8.746 | 5.87E-06 | 0.0312 | ● | ||
| IGLV5-37 | −6.941 | 1.03E-05 | 0.0438 | |||
| IRX1 | −6.795 | 2.15E-06 | 0.0196 | ● | ||
| PCDH10 | −6.240 | 2.00E-07 | 0.0080 | |||
| HOXB9 | −6.068 | 8.89E-06 | 0.0408 | |||
| COL14A1 | −6.028 | 2.53E-06 | 0.0196 | ● | ||
| GLIS3 | −5.496 | 5.64E-06 | 0.0309 | |||
| ZNF385C | −5.156 | 2.40E-06 | 0.0196 | |||
| PLEKHA5 | −4.512 | 2.38E-07 | 0.0080 | |||
| CMAHP | −3.406 | 2.04E-07 | 0.0080 | |||
| ANKRD36B | −2.598 | 1.19E-06 | 0.0160 | |||
| TPTEP1 | −2.475 | 1.03E-05 | 0.0438 |
Next, we investigated changes in cellular energy metabolism under OxPhos inhibition by using an extracellular flux assay of OCI-AML3, MOLM13, and U937 cells with and without MSC coculture. In cocultured AML cells, the OCR was measured after AML cells were separated from the MSC monolayer by carefully pipetting. The baseline OCR of OxPhosi-resistant MOLM13 cells was higher than that of OxPhosi-sensitive OCI-AML3 cells, and MSC coculture decreased the baseline OCR compared with the single-culture condition in all tested cells (Figure 1C; supplemental Figure 4). As shown in Figure 1C, IACS-010759 decreased the OCR in both cell lines but more potently in OCI-AML3 cells. OCR depletion triggered by IACS-010759 was significantly suppressed in OCI-AML3 cells under MSC coculture conditions but not in MOLM13 cells (percent decrease of OCR [shown hereafter as mean ± SD] in single culture vs MSC coculture: OCI-AML3, 92% ± 2% vs 67% ± 2%; P = .04; MOLM13, 71% ± 4% vs 58% ± 6.6%; P = .24). In U937 cells with intermediate sensitivity to IACS-010759, MSC coculture reduced the cell growth–inhibitory effects of IACS-010759 by an amount similar to that for OCI-AML3 cells (Figure 1A) and similarly suppressed depletion of OCR triggered by IACS-010759 (percent OCR reduction: U937 alone, 81% ± 2% vs U937 + MSC, 47% ± 5%; P = .01, supplemental Figure 4). These results suggest that MSCs support at least partial reversal of the metabolic suppression caused by OxPhos inhibition in AML cells. Considering a 10-fold difference in the numbers of AML cells (5 × 10⁵) and MSCs (6 × 10⁴) for the OCR measurement, the baseline OCR of MSCs was approximately equal to that of AML cells. The OCR inhibitory effect of IACS-010759 in MSCs was modest compared with that in AML cells (percent decrease of OCR, 49% ± 11%; Figure 1D), and no changes were detected in viability or annexin of MSCs (data not shown).
To determine whether the suppression of OxPhosi-induced metabolic blockade by MSCs would translate into rescue of AML cell viability, we investigated IACS-010759-induced apoptotic effects in cocultured AML cells. To examine whether the effect of MSCs is the result of direct cellular contact or of factors secreted by stromal cells, we used annexin V flow cytometry to compare the induction of apoptosis in OCI-AML3 cells cultured in various conditions: with or without an OxPhosi, with or without MSC coculture, and adherence or nonadherence (floating or upper compartment of a transwell insert) to MSCs. As shown in Figure 1E-F, OxPhos inhibition induced apoptotic cell death in AML cells cultured in medium only. In turn, coculture with MSCs rescued OCI-AML3 cells from apoptosis induced by OxPhos inhibition, and cells that adhered to MSCs were more profoundly protected than were nonadherent cells (floating or in the upper transwell insert). Conversely, a statistically significant reduction in the number of annexin+ cells was observed with floating nonadherent cells in upper transwell inserts under MSC coculture conditions compared with cells cultured alone. These findings indicate that soluble factors contribute to protecting AML cells from apoptosis in the presence of BM stromal cells. Thus, BM stromal cells, in particular those in direct contact with leukemia cells and aided by secreted factors, play a key role in the microenvironment-mediated protection of AML cells from metabolic stress caused by OxPhos blockade.
OxPhos inhibition induces mitochondrial transfer from MSCs to AML cells
Previous studies demonstrated that the direct transfer of mitochondria from BM stromal cells may facilitate the production of OxPhos and adenosine triphosphate in leukemia cells.10,11 We therefore hypothesized that the trafficking of mitochondria from BM stromal cells to AML cells could be a mechanism of acquired resistance to OxPhos inhibition. To differentiate mitochondria by their origin, we used OCI-AML3 cells and OxPhosi-resistant MOLM13 cells stably transfected with mitochondria-targeted PDHA1-GFP and MSCs transfected with PDHA1-dsRed (Figure 2A, left upper panel). A representative confocal image of the dual fluorescence (GFP and dsRed)–positive OCI-AML3 cells cocultured with MSCs in the presence of 30 nM IACS-010759 for 72 hours is shown in Figure 2A (left lower panel). The fluorescence ratios of cells with dual fluorescence were measured in nonadherent OCI-AML3 and MOLM13 cells in the absence and presence of OxPhos inhibition. Interestingly, the percentage of dual-positive cells was increased in OCI-AML3 cells, but not in OxPhosi-resistant MOLM13 cells (Figure 2A, right panel). In U937 cells with intermediate sensitivity to IACS-010759, treatment with IACS-010759 modestly increased the fraction of dsRed-positive cells (control, 0.3% ± 0.2% vs MSC coculture, 2.7% ± 1.3%; P = .008 (supplemental Figure 5). These results indicate that metabolic stress in OxPhos-dependent cells can induce the transfer of MSC mitochondria into leukemia cells.
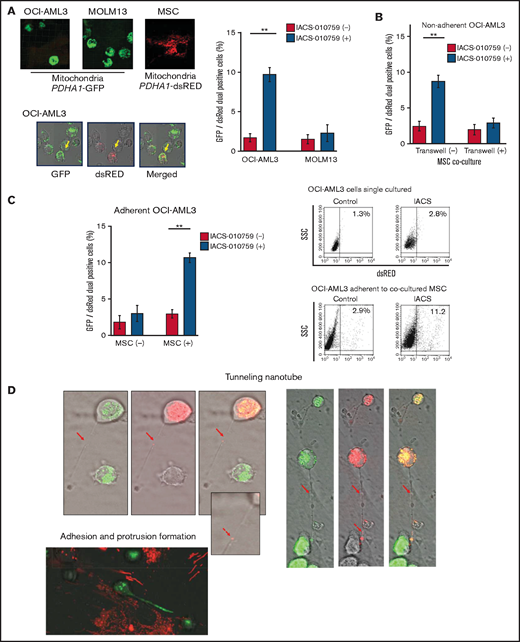
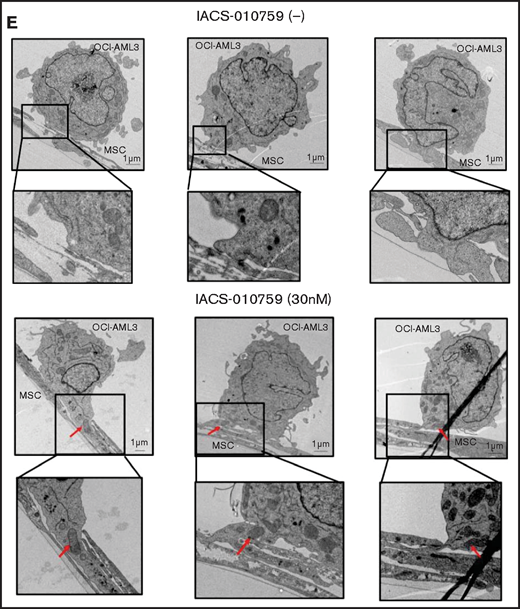
Mitochondrial transfer from MSCs to AML cells is induced by OxPhos inhibition. (A) OCI -AML3 and MOLM13 cells were stably transfected with mitochondria-targeted PDHA1-GFP, and MSCs were transfected with PDHA1-dsRed (upper left panel). Confocal microscopy images at ×40 magnification. Representative confocal images of dual fluorescence (GFP and dsRed)–positive OCI-AML3 cells cocultured with MSCs in the presence of 30 nM IACS-010759 for 72 hours (lower left panel; yellow arrow: GFP and dsRed dual-positive cell). To quantitatively determine the rate of mitochondrial transfer, OCI-AML3 cells cocultured with MSCs were separated from the MSC monolayer by careful pipetting, and the GFP and dsRed dual-positive recipient cells per 100 GFP+ cells (n > 5) were counted at ×40 magnification by live-cell imaging with confocal microscopy (right panel). Laser scanning was used to obtain images under a confocal microscope. (B) To compare direct-contact to noncontact conditions, OCI-AML cells were cocultured with PDHA1-dsRed–transfected MSCs in direct contact or separated by a transwell insert and treated with IACS-010759 (30 nM) for 72 hours. OCI-AML3 cells cultured in direct-contact conditions were separated from the MSC monolayer by careful pipetting. dsRed-positive OCI-AML3 cells per 100 OCI-AML3 cells (n > 5) were counted at ×40 magnification by live-cell imaging with confocal microscopy. (C) PDHA1-GFP–transfected OCI-AML3 cells were treated with the OxPhosi IACS-010759 (30 nM) for 72 hours in the presence or absence of PDHA1-dsRed transfected MSCs. The rate of MSC-derived mitochondrial transfer in OCI-AML3 cells that adhered to MSCs was determined by flow cytometric analysis after depletion of MSCs with MACS as described in supplemental Materials and Methods. Representative flow cytometry plots are shown on the right . (D) Representative confocal microscopy images show the formation of TNTs and protrusion formation in OCI-AML3 cells after treatment with IACS-010759 under MSC coculture conditions. The red arrows indicate the transfer of MSC-derived mitochondria along TNTs. Confocal microscopy images at ×63 magnification. (E) OCI-AML3 cells were treated with the OxPhosi IACS-010759 (30 nM) for 48 hours in the presence of MSCs. Representative electron microscopy images show the IACS-010759–treated OCI-AML3 cells migrating to cocultured MSCs with mitochondrial transport to the leading edge of a protrusion, which was not observed in untreated (control) cells. Red arrows indicate mitochondria. Error bars in the graphs show the means ± SDs of the results from 3 independent experiments. **P < .01. SSC, side scatter.
Mitochondrial transfer from MSCs to AML cells is induced by OxPhos inhibition. (A) OCI -AML3 and MOLM13 cells were stably transfected with mitochondria-targeted PDHA1-GFP, and MSCs were transfected with PDHA1-dsRed (upper left panel). Confocal microscopy images at ×40 magnification. Representative confocal images of dual fluorescence (GFP and dsRed)–positive OCI-AML3 cells cocultured with MSCs in the presence of 30 nM IACS-010759 for 72 hours (lower left panel; yellow arrow: GFP and dsRed dual-positive cell). To quantitatively determine the rate of mitochondrial transfer, OCI-AML3 cells cocultured with MSCs were separated from the MSC monolayer by careful pipetting, and the GFP and dsRed dual-positive recipient cells per 100 GFP+ cells (n > 5) were counted at ×40 magnification by live-cell imaging with confocal microscopy (right panel). Laser scanning was used to obtain images under a confocal microscope. (B) To compare direct-contact to noncontact conditions, OCI-AML cells were cocultured with PDHA1-dsRed–transfected MSCs in direct contact or separated by a transwell insert and treated with IACS-010759 (30 nM) for 72 hours. OCI-AML3 cells cultured in direct-contact conditions were separated from the MSC monolayer by careful pipetting. dsRed-positive OCI-AML3 cells per 100 OCI-AML3 cells (n > 5) were counted at ×40 magnification by live-cell imaging with confocal microscopy. (C) PDHA1-GFP–transfected OCI-AML3 cells were treated with the OxPhosi IACS-010759 (30 nM) for 72 hours in the presence or absence of PDHA1-dsRed transfected MSCs. The rate of MSC-derived mitochondrial transfer in OCI-AML3 cells that adhered to MSCs was determined by flow cytometric analysis after depletion of MSCs with MACS as described in supplemental Materials and Methods. Representative flow cytometry plots are shown on the right . (D) Representative confocal microscopy images show the formation of TNTs and protrusion formation in OCI-AML3 cells after treatment with IACS-010759 under MSC coculture conditions. The red arrows indicate the transfer of MSC-derived mitochondria along TNTs. Confocal microscopy images at ×63 magnification. (E) OCI-AML3 cells were treated with the OxPhosi IACS-010759 (30 nM) for 48 hours in the presence of MSCs. Representative electron microscopy images show the IACS-010759–treated OCI-AML3 cells migrating to cocultured MSCs with mitochondrial transport to the leading edge of a protrusion, which was not observed in untreated (control) cells. Red arrows indicate mitochondria. Error bars in the graphs show the means ± SDs of the results from 3 independent experiments. **P < .01. SSC, side scatter.
To further characterize the direct interactions between OCI-AML3 cells and MSCs, coculture was performed with and without transwell inserts. Figure 2B shows that dual-positive cells were apparent only when the cells were cocultured without separating filters. We then performed flow cytometric analysis to identify dsRed fluorescence derived from MSC mitochondria in OCI-AML3 cells that adhered to MSCs after treatment with IACS-010759. As shown in Figure 2C, the rate of transfer of MSC-derived mitochondria in adherent OCI-AML3 cells was significantly increased by OxPhos inhibition, but this increase was not observed in single-culture conditions.
To investigate how the mitochondria were transferred, we carefully examined the microscopic images at high magnification. The snapshots in Figure 2D (upper panels) show OCI-AML3 cells with green fluorescence and an MSC with red fluorescence connected by very thin tubes that resemble TNTs, which are actin-containing membrane protrusions that play an essential role in long-range intercellular communication. Small red particles were seen inside some of these tubes, which might be the migrating mitochondria. However, in other cases, we observed much thicker tubing and protrusions from AML cells and green, but not red, fluorescence in the tubing (Figure 2D, lower panel). These morphologic changes could be associated with the transcriptional upregulation of genes associated with adhesion and rho GTPase, which are involved in TNT formation through actin polymerization and which were detected by CAGE analyses. Electron microscopy further revealed that treatment with IACS-010759 induced the transport of mitochondria to the leading edge of the protrusions of OCI-AML3 cells adhering to cocultured MSCs; this was not evident in untreated OCI-AML3 cells (Figure 2E).
ICAM-1 mediates the transfer of mitochondria from MSCs to AML cells
Previous studies demonstrated that oxidative stress induced by chemotherapeutic agents can trigger the formation of cell adhesion-induced TNTs. Specifically, ICAM-1 can mediate the transfer of mitochondria between leukemia cells and MSCs.9-11,28 Indeed, we found that inhibition of ICAM-1 with a neutralizing antibody (Figure 3A, left panel) and blockade of actin polymerization with cytochalasin D (Figure 3A, right panel) blocked the transfer of MSC-derived mitochondria to OCI-AML3 cells. We further observed that the blockade of mitochondrial transfer induced by inhibition of ICAM-1 and actin polymerization increased the cytotoxic effects of OxPhos inhibition (Figure 3B). Because CAGE and extracellular flux analyses indicated that the AML cell adhesion to MSCs is critical for acquired resistance to OxPhos inhibition by reversing metabolic suppression, we investigated the changes in energy metabolism in AML cells after blockade of ICAM-1. An extracellular flux assay demonstrated that the ICAM-1 neutralizing antibody did not affect OCR by itself; instead, it significantly enhanced the metabolic suppression induced by IACS-010759 in OCI-AML3 cells cocultured with MSCs (Figure 3C).
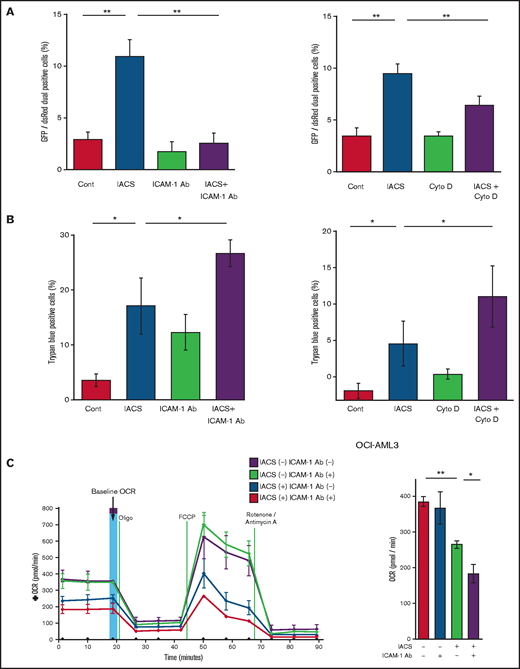
Blockade of ICAM-1 and actin polymerization inhibits mitochondrial transfer and increases cytotoxic effects of OxPhos inhibition. (A-B) PDHA1-GFP–transfected OCI-AML cells were cocultured with PDHA1-dsRed–transfected MSCs with or without IACS-010759 (30 nM) and/or an ICAM-1 neutralizing antibody (Ab) (25 μg/mL) (left) or cytochalasin D (Cyto D) (350 nM) (right). (A) To quantitatively determine the rate of mitochondrial transfer, the number of GFP and dsRed dual-positive recipient cells per 100 GFP+ cells was counted at ×40 magnification by live-cell imaging with confocal microscopy. Laser scanning was used to obtain images under a confocal microscope. To quantitatively determine the rate of mitochondrial transfer, OCI-AML3 cells cocultured with MSCs were separated from the MSC monolayer by careful pipetting, and the GFP and dsRed dual-positive recipient cells per 100 GFP+ cells were counted at ×40 magnification by live-cell imaging with confocal microscopy (right panel). Laser scanning was used to obtain images under a confocal microscope. The means ± SDs of the results from 5 independent experiments. (B) The percentage of dead cells was determined by the trypan blue exclusion method. (C) The OCR was measured by extracellular flux assay in OCI-AML cells cocultured with MSCs with or without IACS-010759 (20 nM) and/or an ICAM-1 neutralizing antibody (25 μg/mL). Cocultured OCI-AML3 cells were separated from the MSC monolayer before the extracellular flux assay. A total of 5 × 10⁵ AML cells were added per well. Three technical replicates for each condition were plated. During the assay, oligomycin, FCCP, rotenone, and antimycin A were added according to the manufacturer’s instructions. Representative of the results from 3 independent Cell Mito Stress Tests, and calculated values for the baseline OCR (indicated by the arrow) are shown. Error bars in the graphs show the means ± SDs of the results from 3 independent experiments. Two-way analysis of variance *P < .05; **P < .01. Cont, control.
Blockade of ICAM-1 and actin polymerization inhibits mitochondrial transfer and increases cytotoxic effects of OxPhos inhibition. (A-B) PDHA1-GFP–transfected OCI-AML cells were cocultured with PDHA1-dsRed–transfected MSCs with or without IACS-010759 (30 nM) and/or an ICAM-1 neutralizing antibody (Ab) (25 μg/mL) (left) or cytochalasin D (Cyto D) (350 nM) (right). (A) To quantitatively determine the rate of mitochondrial transfer, the number of GFP and dsRed dual-positive recipient cells per 100 GFP+ cells was counted at ×40 magnification by live-cell imaging with confocal microscopy. Laser scanning was used to obtain images under a confocal microscope. To quantitatively determine the rate of mitochondrial transfer, OCI-AML3 cells cocultured with MSCs were separated from the MSC monolayer by careful pipetting, and the GFP and dsRed dual-positive recipient cells per 100 GFP+ cells were counted at ×40 magnification by live-cell imaging with confocal microscopy (right panel). Laser scanning was used to obtain images under a confocal microscope. The means ± SDs of the results from 5 independent experiments. (B) The percentage of dead cells was determined by the trypan blue exclusion method. (C) The OCR was measured by extracellular flux assay in OCI-AML cells cocultured with MSCs with or without IACS-010759 (20 nM) and/or an ICAM-1 neutralizing antibody (25 μg/mL). Cocultured OCI-AML3 cells were separated from the MSC monolayer before the extracellular flux assay. A total of 5 × 10⁵ AML cells were added per well. Three technical replicates for each condition were plated. During the assay, oligomycin, FCCP, rotenone, and antimycin A were added according to the manufacturer’s instructions. Representative of the results from 3 independent Cell Mito Stress Tests, and calculated values for the baseline OCR (indicated by the arrow) are shown. Error bars in the graphs show the means ± SDs of the results from 3 independent experiments. Two-way analysis of variance *P < .05; **P < .01. Cont, control.
Although vascular cell adhesion molecule-1 (VCAM-1) plays a role in the binding of leukemia cells through α4β1-integrin,29-31 the anti-α4β1 integrin antibody natalizumab32 did not inhibit mitochondrial transfer induced by OxPhos inhibition (supplemental Figure 6). In addition, it has been reported that mitochondrial uptake can occur through endocytosis.11 However, the endocytosis inhibitor dansylcadaverine, which blocks macrovesicle endocytosis, failed to inhibit the transfer of mitochondria (supplemental Figure 7).
OxPhos inhibition increases the functional mitochondria in OCI-AML3 cells cocultured with MSCs
Under stress conditions induced by chemotherapeutic drugs or OxPhos inhibition, a dynamic increase in mitochondrial fission was reported to segregate damaged mitochondria and maintain functional mitochondria.28-32 Electron microscopy showed that treatment with an OxPhosi indeed induced mitochondrial fission in leukemia cells, as evidenced by increased numbers of mitochondria in OCI-AML3 cells cocultured with MSCs (Figure 4A; supplemental Figure 8). As shown in Figure 4B, the mtDNA copy numbers in OCI-AML3 cells (mtDNA:nuclear DNA ratio) were significantly increased by OxPhos inhibition under MSC coculture conditions but not in monoculture. These results indicate that OxPhos inhibition increases the number of mitochondria in AML cells coexisting with BM stromal cells.
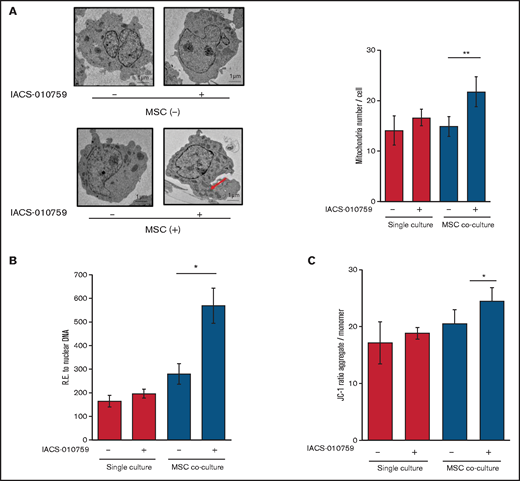
OxPhos inhibition increases the number of functional mitochondria in OCI-AML3 cells cocultured with MSCs. (A) OCI-AML3 cells were treated with the OxPhosi IACS-010759 (30 nM) for 72 hours with or without cocultured MSCs. Representative electron microscopy images showing the increased numbers of small mitochondria in IACS-010759–treated OCI-AML3 cells cocultured with MSCs (left panel). The number of mitochondria inside OCI-AML3 cells was counted in more than 10 image fields at ×40 magnification by live-cell imaging with confocal microscopy. (B) Mitochondrial DNA copy number was assessed by quantitative polymerase chain reaction. Mitochondrial DNA content was normalized to nuclear DNA content. Data are presented as the mean of 3 independent experiments. (C) OCI-AML3 cells were treated with IACS-010759 (30 nM) for 4 hours with or without cocultured MSCs. The JC-1 monomer with green fluorescence reflects mitochondria with collapsed membrane potentials, and aggregated JC-1 with red fluorescence reflects mitochondria with intact membrane potentials. The ratio of the red and green optical density is shown. Data are presented as the means of 3 independent experiments. Error bars in the graphs show the means ± SDs of the results from 3 independent experiments. *P < .05; **P < .01.
OxPhos inhibition increases the number of functional mitochondria in OCI-AML3 cells cocultured with MSCs. (A) OCI-AML3 cells were treated with the OxPhosi IACS-010759 (30 nM) for 72 hours with or without cocultured MSCs. Representative electron microscopy images showing the increased numbers of small mitochondria in IACS-010759–treated OCI-AML3 cells cocultured with MSCs (left panel). The number of mitochondria inside OCI-AML3 cells was counted in more than 10 image fields at ×40 magnification by live-cell imaging with confocal microscopy. (B) Mitochondrial DNA copy number was assessed by quantitative polymerase chain reaction. Mitochondrial DNA content was normalized to nuclear DNA content. Data are presented as the mean of 3 independent experiments. (C) OCI-AML3 cells were treated with IACS-010759 (30 nM) for 4 hours with or without cocultured MSCs. The JC-1 monomer with green fluorescence reflects mitochondria with collapsed membrane potentials, and aggregated JC-1 with red fluorescence reflects mitochondria with intact membrane potentials. The ratio of the red and green optical density is shown. Data are presented as the means of 3 independent experiments. Error bars in the graphs show the means ± SDs of the results from 3 independent experiments. *P < .05; **P < .01.
Next, we measured the mitochondrial membrane potential to assess mitochondrial function using the membrane-permeant JC-1 dye. The JC-1 dye enters the cell and accumulates in the mitochondria. In energized and negatively charged mitochondria, JC-1 spontaneously forms red fluorescent J-aggregates. In damaged mitochondria with collapsed membrane potential, JC-1 retains its original green fluorescence as a monomer. As shown in Figure 4C, coculture of OCI-AML3 cells with MSCs facilitated a moderate increase in the ratio of aggregated JC-1 with red fluorescence to monomer JC-1 with green fluorescence, which reflects an increase in the energized mitochondria with intact membrane potential compared with damaged mitochondria with collapsed membrane potential. OxPhos inhibition further increased levels of aggregated JC-1 under MSC coculture conditions. The fluorescent images of merged aggregated JC-1 (red) and monomer JC-1 (green) are shown in supplemental Figure 9. These findings indicate that in addition to direct mitochondrial transfer, mitochondrial fission in AML cells results in a net increase in the number of total and functional mitochondria that dampen the response of AML cells to inhibition by OxPhos in the BM microenvironment. To identify the role of AML cell adhesion to BM stromal cells in regulating the number of mitochondria, further investigations are warranted, including direct observation and measurement of mitochondria by electron microscopy with or without a transwell inserts.
OxPhos inhibition increases ROS generation and mitophagy in OCI-AML3 cells cocultured with MSCs
Because mitochondrial fission is known to be triggered by generation of ROS, we measured total ROS production. Inhibition of OxPhos induced significant upregulation of ROS production in OCI-AML3 cells cocultured with MSCs (Figure 5A). During ROS production and mitochondrial fission, defective mitochondria are commonly removed by mitophagy (the selective degradation of mitochondria by autophagy33 ), which is important in cellular metabolism and is essential for cell survival.34,35 We observed that OxPhos inhibition induced autophagy, with conversion of LC3-I to LC3-II in both monoculture and MSC coculture, but more prominently in MSC coculture. This effect was enhanced by the lysosome inhibitor bafilomycin (Figure 5B). Indeed, the number of cells that were positive for a dye that detects damaged mitochondria fused to lysosomes (ie, mitophagy) was significantly increased in OCI-AML3 cells treated with an OxPhosi in both monoculture and coculture with MSCs but more prominently in those cocultured with MSCs (Figure 5C). Figure 5D shows representative electron microscopy images of MSC-derived PDHA1-dsRED-positive mitochondria immunolabeled with gold particles and wrapped in an autophagosome in cocultured OCI-AML3 cells.
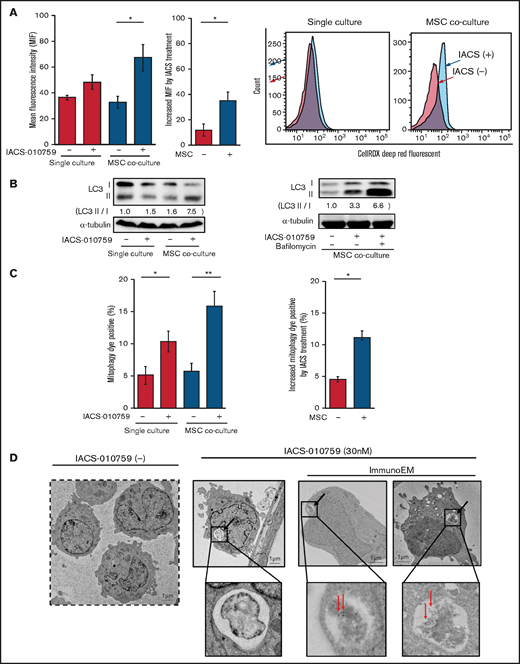
OxPhos inhibition induces ROS and mitophagy in OCI-AML3 cells cocultured with MSCs. (A) Summary data (left) and representative flow cytometry histograms (right) showing ROS production in OCI-AML3 cells treated with the OxPhosi IACS-010759 (30 nM) for 72 hours with or without cocultured MSCs. Comparisons of the increase in ROS by treatment with IACS-010759 (IACS) between the single-culture condition and MSC coculture condition are shown in the middle. An increase in relative fluorescence is reflected by a rightward shift along the x-axis of the histograms. (B) Cells were treated with IACS-010759 (30 nM) for 18 hours in the absence or presence of the lysosomal inhibitor bafilomycin A1 (10 µM), and cell lysates were examined by immunoblotting. LC3-II protein levels were normalized to LC-I levels to determine the differences in protein expression between the cells cultured with and without MSCs. (C) Uptake of mitochondria by lysosomes was evaluated by mitophagy assay. Comparisons of the increase in mitophagy dye positivity by treatment with IACS-010759 between the single-culture condition and MSC coculture condition are shown on the right. (D) Representative immunoelectron microscopy images showing MSC-derived mitochondrial fragments inside autophagosomes in cocultured OCI-AML3 cells. OCI-AML3 cells were cocultured with PDHA1-dsRed–transfected MSCs and treated with 30 nM IACS-010759. Electron microscopy images at ×2000 magnification. Fixed sections were immunolabeled with gold as described in supplemental Materials and Methods. Black arrows indicate mitophagy; red arrows indicate MSC-derived mitochondrial fragments surrounded by autophagosomes. Error bars in the graphs show the means ± SDs of 3 independent experiments. *P < .05; **P < .01.
OxPhos inhibition induces ROS and mitophagy in OCI-AML3 cells cocultured with MSCs. (A) Summary data (left) and representative flow cytometry histograms (right) showing ROS production in OCI-AML3 cells treated with the OxPhosi IACS-010759 (30 nM) for 72 hours with or without cocultured MSCs. Comparisons of the increase in ROS by treatment with IACS-010759 (IACS) between the single-culture condition and MSC coculture condition are shown in the middle. An increase in relative fluorescence is reflected by a rightward shift along the x-axis of the histograms. (B) Cells were treated with IACS-010759 (30 nM) for 18 hours in the absence or presence of the lysosomal inhibitor bafilomycin A1 (10 µM), and cell lysates were examined by immunoblotting. LC3-II protein levels were normalized to LC-I levels to determine the differences in protein expression between the cells cultured with and without MSCs. (C) Uptake of mitochondria by lysosomes was evaluated by mitophagy assay. Comparisons of the increase in mitophagy dye positivity by treatment with IACS-010759 between the single-culture condition and MSC coculture condition are shown on the right. (D) Representative immunoelectron microscopy images showing MSC-derived mitochondrial fragments inside autophagosomes in cocultured OCI-AML3 cells. OCI-AML3 cells were cocultured with PDHA1-dsRed–transfected MSCs and treated with 30 nM IACS-010759. Electron microscopy images at ×2000 magnification. Fixed sections were immunolabeled with gold as described in supplemental Materials and Methods. Black arrows indicate mitophagy; red arrows indicate MSC-derived mitochondrial fragments surrounded by autophagosomes. Error bars in the graphs show the means ± SDs of 3 independent experiments. *P < .05; **P < .01.
OxPhos inhibition combined with cytarabine increases mitochondrial transfer from MSCs and inhibits apoptosis induction in OCI-AML3 cells
We further observed that coculture of OCI-AML3 cells with MSCs inhibited the apoptosis-inducing effect of the combination of low-dose cytarabine and OxPhos inhibition. As shown in Figure 6A, induction of apoptosis by the combination of cytarabine and IACS-010759 was reduced by the MSC coculture, more prominently in MSC-adherent OCI-AML3 cells than in nonadherent cells.
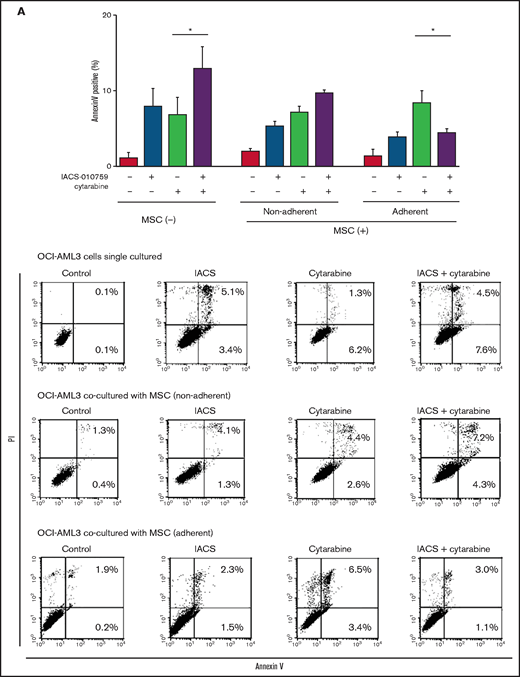
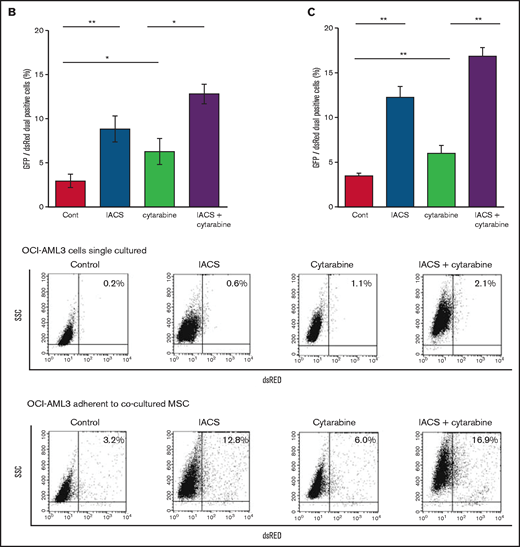
MSC coculture inhibits OxPhos inhibition and cytarabine-induced apoptosis with increasing mitochondrial transfer. OCI-AML3 cells were treated with OxPhosi IACS-010759 (20 nM) and/or cytarabine (500 nM) for 72 hours in the presence or absence of MSCs. In cocultured cells, nonadherent OCI-AML3 cells were separated from the MSC monolayer by careful pipetting. After removing nonadherent cells, the OCI-AML3 cells that adhered to cocultured MSCs were trypsinized with MSCs and then separated from MSCs by magnetic-activated cell sorting using anti-CD45 microbeads. (A) Apoptotic cell death of adherent and nonadherent OCI-AML3 cells in single-culture and MSC-coculture conditions was detected by staining with annexin V-FITC/PI and an anti-CD45 APC-conjugated antibody using flow cytometry. Representative flow cytometry plots (bottom) show annexin V (x-axis) and PI (y-axis) staining. (B) The rate of MSC-derived mitochondrial transfer in cocultured nonadherent OCI-AML3 cells was detected by counting the number of GFP and dsRed dual-positive recipient cells per 100 GFP+ cells (n > 5) at ×40 magnification by live-cell imaging with confocal microscopy using laser scanning to obtain images. (C) The rate of MSC-derived mitochondrial transfer in OCI-AML3 cells that adhered to MSCs was detected by flow cytometric analysis after depletion of MSCs with MACS as described in supplemental Materials and Methods. Representative flow cytometry plots are shown (right). Error bars in the graphs show the means ± SDs of the results from 3 independent experiments. Two-way analysis of variance (ANOVA) *P < .05; **P < .01.
MSC coculture inhibits OxPhos inhibition and cytarabine-induced apoptosis with increasing mitochondrial transfer. OCI-AML3 cells were treated with OxPhosi IACS-010759 (20 nM) and/or cytarabine (500 nM) for 72 hours in the presence or absence of MSCs. In cocultured cells, nonadherent OCI-AML3 cells were separated from the MSC monolayer by careful pipetting. After removing nonadherent cells, the OCI-AML3 cells that adhered to cocultured MSCs were trypsinized with MSCs and then separated from MSCs by magnetic-activated cell sorting using anti-CD45 microbeads. (A) Apoptotic cell death of adherent and nonadherent OCI-AML3 cells in single-culture and MSC-coculture conditions was detected by staining with annexin V-FITC/PI and an anti-CD45 APC-conjugated antibody using flow cytometry. Representative flow cytometry plots (bottom) show annexin V (x-axis) and PI (y-axis) staining. (B) The rate of MSC-derived mitochondrial transfer in cocultured nonadherent OCI-AML3 cells was detected by counting the number of GFP and dsRed dual-positive recipient cells per 100 GFP+ cells (n > 5) at ×40 magnification by live-cell imaging with confocal microscopy using laser scanning to obtain images. (C) The rate of MSC-derived mitochondrial transfer in OCI-AML3 cells that adhered to MSCs was detected by flow cytometric analysis after depletion of MSCs with MACS as described in supplemental Materials and Methods. Representative flow cytometry plots are shown (right). Error bars in the graphs show the means ± SDs of the results from 3 independent experiments. Two-way analysis of variance (ANOVA) *P < .05; **P < .01.
We then investigated whether the mitochondrial transfer from MSCs to OCI-AML3 cells triggered by OxPhos inhibition was further enhanced by co-treatment with low-dose cytarabine. Using OCI-AML3 cells transfected with PDHA1-GFP and MSCs transfected with PDHA1-dsRed, we observed by confocal microscopy, that treatment with cytarabine plus OxPhosi increased the transfer of MSC-derived mitochondria to cocultured OCI-AML3 cells that were not adherent to MSC layers (Figure 6B; supplemental Figure 10). Flow cytometric analysis of dsRed fluorescence in OCI-AML3 cells cocultured with MSCs also demonstrated an increase of dsRed-positive OCI-AML3 cells, indicating mitochondrial transfer from MSCs (Figure 6C). Taken together, these findings indicate that BM stromal cells abrogate the apoptotic effects of cytarabine plus OxPhos inhibition in AML cells and that mitochondrial transfer triggered by OxPhos inhibition might be at least in part responsible for this resistance.
In vivo transcriptome analysis of OxPhosi-resistant AML cells
We examined gene promoter expression of OxPhosi-sensitive and -resistant AML PDXs by CAGE analysis. Primary AML cells from 7 AML PDXs (Table 3) were injected into irradiated NSG mice, which were randomly assigned upon documented engraftment to receive IACS-010759 or vehicle (n = 3 mice per group). The antileukemia efficacy of the treatment was monitored by serial measurements of circulating AML cells as described in the supplemental Materials and Methods. Of the 7 models tested, we defined 3 PDXs as sensitive and 4 as resistant to ongoing therapy with OxPhosi(s) (Figure 7).
Clinical characteristics of patients with AML whose samples were used for in vivo experiments
| Patient No. | OxPhosi sensitivity | Diagnosis | Mutation status |
|---|---|---|---|
| 27 | Sensitive | AML | FLT3-ITD, CEPBA, IDH1, NPM1, NRAS |
| 28 | Sensitive | AML | FLT3-ITD, DNMT3A, IDH1, KIT, NPM1 |
| 29 | Sensitive | AMML | FLT3-ITD, IDH1, NPM1 |
| 30 | Resistant | AML | FLT3-ITD, DNMT3A, NPM1, TP53 |
| 31 | Resistant | AML | FLT3-ITD, DNMT3A, IDH2, NPM1 |
| 32 | Resistant | AML | FLT3-ITD, DNMT3A, IDH1, NPM1 |
| 33 | Resistant | AML | FLT3-ITD, DNMT3A, EGFR, IDH1, NPM1, TET2 |
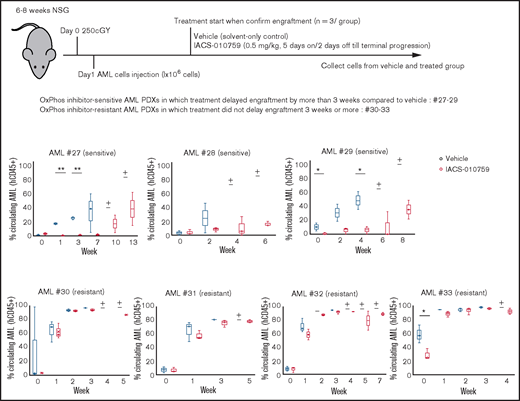
OxPhosi-resistant and OxPhosi-sensitive AML cells in mouse xenograft model. NOD-scid IL2Rγnull (NSG) mice were injected with 1 million AML PDX cells 24 hours after receiving irradiation at 250 cGy. Mice were randomly assigned to receive vehicle or IACS-010759 (5.0 mg/kg; 5 days on/2 days off until terminal progression) (n = 3 mice per group). Engraftment of the leukemic cells in the peripheral blood was determined by flow cytometry with an anti-human CD45 antibody. OxPhosi-sensitive AML PDXs were from patients 27 to 29; OxPhosi-resistant AML PDXs were from patients 31 to 33. (+) Indicates that only 1 mouse survived . The thick horizontal lines in the bars represent median. Error bars in the graphs show means ± SDs. *P < .05; **P < .01.
OxPhosi-resistant and OxPhosi-sensitive AML cells in mouse xenograft model. NOD-scid IL2Rγnull (NSG) mice were injected with 1 million AML PDX cells 24 hours after receiving irradiation at 250 cGy. Mice were randomly assigned to receive vehicle or IACS-010759 (5.0 mg/kg; 5 days on/2 days off until terminal progression) (n = 3 mice per group). Engraftment of the leukemic cells in the peripheral blood was determined by flow cytometry with an anti-human CD45 antibody. OxPhosi-sensitive AML PDXs were from patients 27 to 29; OxPhosi-resistant AML PDXs were from patients 31 to 33. (+) Indicates that only 1 mouse survived . The thick horizontal lines in the bars represent median. Error bars in the graphs show means ± SDs. *P < .05; **P < .01.
In the resistant models, CAGE analysis of OxPhosi-induced changes (comparing pre- and posttreatment) identified upregulation of 100 promoters and downregulation of 218 promoters (FDR, <0.05; log2 fold change, >2.0 by EdgeR), including notably increased promoter expression (log2 fold change, >3.0) of genes associated with adhesion (SORBS2,36 CCR8,37 BAI2,38 LAG3,39 PLXDC1,40 CD200R1,41 and ATN142 ), migration (CCR8,43 PLXDC1,44 COBLL1,45 and SIGIRR46 ), and actin cytoskeleton dynamics (BMF,47 BEST1,48 TNNT3,49 and FGD150 ) (Table 4). We further observed significant upregulation of promoter expression of ASS1, which encodes argininosuccinate synthase 1 and is responsible for the biosynthesis of arginine51,52 ; of LRP1, which encodes low-density lipoprotein receptor–related protein-1 (LRP1), a member of the low-density lipoprotein receptor family involved in lipid homeostasis53 ; MRPS2, encoding mitochondrial ribosomal protein S254 ; and PDE9A, encoding phosphodiesterase 9A, which catalyzes the hydrolysis of cyclic adenosine 3′,5′-monophosphate (cAMP) and cyclic guanosine 3′,5′-monophosphate (cGMP).55 DEGseq detected 247 gene promoters that were upregulated and 925 promoters that were downregulated by treatment with OxPhosi in all 4 OxPhosi-resistant PDX mouse models (supplemental Table 2). Notably, 5 of the adhesion-associated promoters that were consistently upregulated by OxPhos inhibition in the 4 resistant mouse models (CCR8, BAI2, LAG3, PLXDC1, and ATN1) were unchanged or downregulated in the 3 sensitive models (Table 5).
Upregulated promoters by OxPhosi treatment in OxPhosi-resistant AML cells in vivo
| Gene name | Log2 fold change | P | FDR | Adhesion | Migration | Actin cytoskeleton dynamics |
|---|---|---|---|---|---|---|
| Higher in OxPhosi-treated AML cells than in vehicle-treated cells | ||||||
| BMF | 5.518 | 1.39E-06 | 0.0002 | ● | ||
| SORBS2 | 5.348 | 7.92E-05 | 0.0050 | ● | ||
| CCR8 | 4.640 | 2.67E-46 | <0.0001 | ● | ● | |
| BAI2 | 4.565 | 4.54E-04 | 0.0205 | ● | ||
| PTPDC1 | 4.312 | 2.75E-04 | 0.0137 | |||
| GPR162 | 4.189 | 4.26E-07 | 0.0001 | |||
| MRPS2 | 4.158 | 1.02E-03 | 0.0387 | |||
| IGLV7-43 | 4.155 | 7.37E-04 | 0.0300 | |||
| LAG3 | 4.145 | 1.10E-03 | 0.0413 | ● | ||
| TRAV21 | 3.970 | 1.33E-03 | 0.0481 | |||
| ASS1 | 3.904 | 1.11E-19 | 0.0000 | |||
| BEST1 | 3.534 | 7.29E-04 | 0.0298 | ● | ||
| PDE9A | 3.492 | 5.08E-04 | 0.0224 | |||
| TRBV8-2 | 3.412 | 1.18E-25 | <0.0001 | |||
| PPP2R5C | 3.377 | 2.13E-04 | 0.0111 | |||
| PLXDC1 | 3.344 | 7.88E-38 | 0.0000 | ● | ● | |
| TMEM91 | 3.320 | 6.58E-05 | 0.0043 | |||
| COBLL1 | 3.279 | 6.35E-04 | 0.0267 | ● | ||
| CD200R1 | 3.256 | 8.72E-04 | 0.0343 | ● | ||
| ATN1 | 3.171 | 1.80E-04 | 0.0097 | ● | ||
| SIGIRR | 3.166 | 5.92E-04 | 0.0253 | ● | ||
| TNNT3 | 3.164 | 7.21E-04 | 0.0296 | ● | ||
| LRP1 | 3.159 | 8.14E-04 | 0.0326 | |||
| FGD1 | 3.044 | 1.13E-03 | 0.0421 | ● | ||
| Lower in OxPhosi-treated AML cells than in vehicle-treated cells | ||||||
| IGLL5 | −7.753 | 1.25E-06 | 0.0001 | |||
| IGLV1-44 | −6.834 | 3.23E-05 | 0.0023 | |||
| RIBC2 | −6.631 | 1.43E-05 | 0.0012 | |||
| RAB39A | −6.591 | 3.79E-06 | 0.0004 | |||
| GLRA3 | −6.351 | 9.65E-05 | 0.0059 | |||
| PAX5 | −6.235 | 1.83E-04 | 0.0099 | |||
| KLRC2 | −6.222 | 1.19E-04 | 0.0070 | |||
| SYK | −6.093 | 3.04E-05 | 0.0022 | |||
| NPM1P18 | −6.050 | 4.71E-05 | 0.0032 | |||
| HCK | −5.913 | 7.38E-04 | 0.0300 | |||
| BCAR3 | −5.889 | 5.85E-04 | 0.0251 | |||
| CD82 | −5.753 | 2.20E-04 | 0.0115 | |||
| TCL1A | −5.599 | 2.36E-04 | 0.0121 | |||
| TNS3 | −5.582 | 3.13E-05 | 0.0023 | |||
| TLE1 | −5.480 | 6.57E-04 | 0.0274 | |||
| TCEB2P2 | −5.405 | 3.34E-05 | 0.0024 | |||
| H2BFS | −5.352 | 2.27E-05 | 0.0017 | |||
| ABCB4 | −5.242 | 2.19E-04 | 0.0114 | |||
| AP3B1 | −5.154 | 1.47E-05 | 0.0012 | |||
| AK097298 | −5.074 | 1.17E-04 | 0.0069 | |||
| NAPSB | −5.026 | 6.93E-05 | 0.0044 | |||
| TUBB3 | −4.855 | 1.81E-04 | 0.0098 | |||
| SPIN4 | −4.851 | 1.91E-04 | 0.0102 | |||
| HIST3H2A | −4.794 | 5.91E-04 | 0.0253 | |||
| TP63 | −4.766 | 4.31E-04 | 0.0197 | |||
| LILRB4 | −4.748 | 3.38E-04 | 0.0163 | |||
| PLA2G2D | −4.713 | 1.99E-04 | 0.0106 | |||
| SPTY2D1 | −4.711 | 2.16E-04 | 0.0113 | |||
| RNF2 | −4.689 | 6.34E-05 | 0.0041 | |||
| PLXNA4 | −4.667 | 2.22E-04 | 0.0115 | |||
| LINC00152 | −4.622 | 1.10E-03 | 0.0411 | |||
| RNU5A-8P | −4.584 | 9.07E-05 | 0.0056 | |||
| GFPT1 | −4.583 | 9.14E-05 | 0.0056 | |||
| THAP2 | −4.580 | 1.03E-04 | 0.0062 | |||
| FADS2 | −4.578 | 2.10E-04 | 0.0110 | |||
| FCRLA | −4.576 | 6.86E-04 | 0.0284 | |||
| AIM2 | −4.528 | 1.05E-03 | 0.0395 | |||
| CDK14 | −4.519 | 4.90E-04 | 0.0217 | |||
| CCND1 | −4.514 | 5.39E-04 | 0.0235 | |||
| CHL1 | −4.442 | 6.22E-04 | 0.0263 | |||
| HIST3H2BB | −4.412 | 9.05E-05 | 0.0056 | |||
| GCN1L1 | −4.344 | 8.47E-04 | 0.0335 | |||
| RERE | −4.332 | 3.72E-04 | 0.0176 | |||
| TIAM1 | −4.329 | 3.54E-04 | 0.0169 | |||
| CEND1 | −4.264 | 1.17E-03 | 0.0433 | |||
| SYVN1 | −4.253 | 1.05E-03 | 0.0396 | |||
| KYNU | −4.235 | 1.76E-04 | 0.0095 | |||
| RPL17P20 | −4.223 | 1.59E-04 | 0.0088 | |||
| uc001tcg.1 | −4.217 | 3.88E-04 | 0.0182 | |||
| ARHGEF7 | −4.196 | 1.27E-03 | 0.0461 | |||
| IL10 | −4.188 | 6.53E-04 | 0.0273 | |||
| SMS | −4.183 | 8.23E-04 | 0.0328 | |||
| PI16 | −4.137 | 2.82E-19 | 0.0000 | |||
| TP53I11 | −4.102 | 7.22E-04 | 0.0296 | |||
| CD24 | −4.075 | 8.40E-05 | 0.0052 | |||
| RPL35P2 | −4.029 | 1.56E-05 | 0.0013 | |||
| MPEG1 | −3.923 | 3.46E-04 | 0.0165 | |||
| ZNF804A | −3.919 | 1.07E-04 | 0.0064 | |||
| IL28RA | −3.882 | 8.71E-04 | 0.0343 | |||
| FCHSD2 | −3.879 | 5.96E-04 | 0.0254 | |||
| SPIB | −3.875 | 3.25E-04 | 0.0158 | |||
| RPL34P23 | −3.873 | 2.81E-05 | 0.0021 | |||
| ALOX5 | −3.695 | 3.73E-04 | 0.0176 | |||
| VPREB3 | −3.683 | 1.36E-03 | 0.0488 | |||
| NXT2 | −3.621 | 1.35E-04 | 0.0077 | |||
| PPIAP29 | −3.607 | 1.63E-04 | 0.0089 | |||
| DPP3 | −3.594 | 2.08E-05 | 0.0016 | |||
| SNX9 | −3.505 | 1.49E-04 | 0.0083 | |||
| ENPP2 | −3.496 | 3.45E-04 | 0.0165 | |||
| FA2H | −3.486 | 6.14E-04 | 0.0260 | |||
| PLD4 | −3.484 | 3.35E-04 | 0.0162 | |||
| TPD52 | −3.470 | 3.98E-04 | 0.0185 | |||
| IGKV1D-33 | −3.435 | 8.34E-04 | 0.0331 | |||
| SFN | −3.420 | 3.09E-09 | <0.0001 | |||
| MS4A1 | −3.368 | 1.60E-04 | 0.0089 | |||
| PHACTR1 | −3.357 | 3.98E-05 | 0.0028 | |||
| PHLDB2 | −3.263 | 3.59E-04 | 0.0170 | |||
| PLAC8 | −3.258 | 2.05E-04 | 0.0108 | |||
| DARS | −3.224 | 2.10E-05 | 0.0016 | |||
| IL18R1 | −3.198 | 4.21E-12 | <0.0001 | |||
| TNFRSF13B | −3.179 | 8.15E-04 | 0.0326 | |||
| SLC20A2 | −3.164 | 7.41E-04 | 0.0302 | |||
| HIST2H3A, HIST2H3C, HIST2H3D | −3.153 | 1.08E-04 | 0.0064 | |||
| TPPP3 | −3.148 | 1.07E-16 | <0.0001 | |||
| PELO | −3.111 | 2.95E-09 | <0.0001 | |||
| RPL14P1 | −3.102 | 1.72E-05 | 0.0014 | |||
| RASSF6 | −3.100 | 9.19E-04 | 0.0358 | |||
| HMGA1P3 | −3.071 | 3.51E-04 | 0.0167 | |||
| MSL1 | −3.067 | 1.13E-03 | 0.0421 | |||
| PDE4D | −3.064 | 8.73E-04 | 0.0343 | |||
| HBEGF | −3.047 | 4.75E-04 | 0.0213 | |||
| RIC8B | −3.027 | 7.72E-04 | 0.0311 | |||
| PDE4B | −3.027 | 1.21E-06 | 0.0001 | |||
Significantly altered promoter expression in OxPhosi-sensitive and OxPhosi-resistant AML cells after OxPhosi treatment in vivo
| OxPhosi-sensitive | OxPhosi-resistant | ||||||
|---|---|---|---|---|---|---|---|
| Patient No. | 27 | 28 | 29 | 30 | 31 | 32 | 33 |
| CCR8 | NC | NC | NC | Up | Up | Up | Up |
| BAI2 | NC | NC | NC | Up | Up | Up | Up |
| LAG3 | NC | NC | NC | Up | Up | NC | Up |
| ATN1 | Down | Down | NC | Up | Up | Up | NC |
| PLXDC1 | NC | NC | NC | Up | Up | Up | Up |
Down, downregulated by OxPhosi treatment; NC, no significant change with OxPhosi treatment; Up, upregulated by OxPhosi treatment.
We further investigated the uptake of murine mtDNA into the human AML PDX cells in vivo using the Mouse Feeder Cell Quantification Kit (Takara Bio; supplemental Materials and Methods). Although murine nuclear DNA measurements were negative in AML cells, we detected murine mtDNA in both AML PDXs treated with IACS-010759. In OxPhosi-resistant AML PDX #31 treated with IACS-010759, the ratio of murine mtDNA to human nuclear DNA was higher than in OxPhosi-sensitive PDX #28 (3.0 vs 0.1) (Figure 7; supplemental Table 3).
Discussion
In this study, we discovered a novel role of BM stromal cells: that of promoting the resistance of AML cells to the metabolic stress of OxPhos inhibition. Our findings indicate that the OxPhos-dependent AML cells become less responsive to OxPhos inhibition while receiving mitochondria from MSCs, and in parallel, they stimulate endogenous mitochondrial fission as an anaplerotic reaction and eliminate damaged mitochondria by mitophagy, all contributing to AML survival.35
Tumor cells have been shown to obtain new DNA from surrounding stromal cells via the formation of TNTs,56,57 gap junctions,58 and endocytosis.11 The horizontal transfer of mtDNA from host cells in the tumor microenvironment to tumor cells is known to re-establish respiration and increase tumor-initiating efficacy in in vivo models.59
We observed that the additive apoptosis-inducing efficacy of the OxPhosi(s) IACS-010759 and cytarabine in AML cells was abrogated under MSC coculture conditions in parallel with reduced OxPhos inhibition and increased mitochondrial transfer from MSCs to AML cells. These findings are supported by the recent study of Farge et al,60 which indicates the key role of high OxPhos in cytarabine resistance. Cytarabine has been shown to inhibit DNA polymerase gamma, which is involved in mtDNA synthesis, leading to the production of ROS and the damage of oxidative mtDNA.61 In turn, it has been reported that cytarabine-induced ROS induces mitochondrial migration from MSCs to leukemic cells via cell adhesion and/or TNTs.10,28 These results indicate that MSCs provide a direct compensatory effect by supplying mitochondria to OxPhosi-sensitive AML cells with low endogenous OxPhos.
Regarding the mechanisms of TNT formation, an active process based on the extension of a filopodium-like protrusion from one cell to another has been proposed.62 Contact-dependent intercellular transfer requires activation of motor proteins such as rho GTPases that positively regulate formation of TNTs through actin polymerization63,64 and formation of filopodia through focal adhesion.65 Recently, a transmembrane complex gap junction channel, connexin 43, was shown to open up under conditions of ROS-induced oxidative stress via activation of PI3K-Akt, which enables mitochondrial transfer from BM stromal cells to hematopoietic stem cells.66 Further investigations are required to identify the role of gap junctions in the regulation of TNT formation, mitochondrial trafficking and the protective effects of the leukemic niche.
This study also demonstrated that OxPhos inhibition under MSC coculture conditions stimulates mitochondrial fission and increases functional mitochondria in AML cells. Mitochondrial fission in which damaged mitochondria are segregated67-71 is commonly associated with mitophagy, the selective removal of mitochondria by autophagy.33 Efficient mitophagy is important in cellular metabolism and is essential for cell survival.34,35 Of note, we observed that the MSC-derived mitochondria transferred to AML cells were degraded inside autophagosomes in AML cells. This finding is consistent with a recent study reporting that the mitochondria transferred from MSCs to corneal endothelial cells via TNTs were degraded by lysosomes in recipient cells.72 These observations indicate the possibility of another important mechanism for maintaining mitochondrial function, but its causal relationship with treatment resistance is left to further study.
One limitation of our coculture experiments is that the cocultured MSCs were exposed to IACS-010759 together with AML cells, and this treatment affects both cell types. However, MSCs undergo less pronounced inhibition of OCRs with IACS-010759 than AML cells, which indicates that the mitochondrial damage to MSCs is less than that in AML cells. Leukemia stem cells (LSCs) are characterized by a low rate of energy metabolism5 and an inability to upregulate glycolysis after OxPhos inhibition, which increases their sensitivity to OxPhos blockade.73 At the same time, LSCs undergo more mitochondrial fission and mitophagy than do bulk AML cells, and they must balance mitochondrial functions such as bioenergetics, ROS generation, and apoptosis to maintain their stemness.71 Because the mitochondrial network is known to be fragile in LSCs, combination therapies with blockade of other metabolic pathways might be a strategy to overcome the BM microenvironment–induced resistance to OxPhos inhibition.
We also observed an increase in promoter expression of the amino acid and lipid metabolism–related genes ASS1 and LRP1 in OxPhosi-treated AML cells in vivo. ASS1 is a key enzyme in the biosynthesis of arginine,52 and LRP1 plays a major role in lipid metabolism and is responsible for hemin-induced autophagy in leukemia cells.53,74 Additional experiments are required to address the role of these enzymes in the responses of AML cells to the metabolic and energetic consequences of OxPhos inhibition.
In conclusion, this study demonstrates that exogenous mitochondrial transfer and endogenous mitochondrial fission in AML cells serve as compensatory adaptations to OxPhos inhibition in the BM microenvironment. The BM microenvironment thereby facilitates secondary resistance to OxPhos inhibition by modulating mitochondrial functions; interference with these processes is required to boost the antitumor potency of OxPhos inhibition.
Acknowledgments
The authors are grateful to Kaoru Mogushi, Masaki Hosoya, Takashi Ueno, and Masaaki Komatsu for useful discussions and to Akemi Kawasaki for technical assistance. The authors thank the Laboratories of Molecular and Biochemical Research and Cell Biology Research and the Division of Proteomics and BioMolecular Science, Juntendo University Graduate School of Medicine for use of their facilities, and Amy Ninetto, Research Medical Library at MD Anderson Cancer Center for manuscript review.
This work was supported in part by grants from the Japan Society for the Promotion of Science Grants-in Aid for Scientific Research (18K07424) (Y.T.), from International Joint Research Programs (19KK0221) (Y.T.), from Platform Project for Supporting Drug Discovery and Life Science Research (Basis for Supporting Innovative Drug Discovery and Life Science Research) from the Japan Agency for Medical Research and Development (JP17am0101102) (Y.T.), National Cancer Institute, National Institutes of Health Specialized Programs of Research Excellence in Leukemia Project 5 (P50 CA100632-16) (M.K.), from the Cancer Prevention & Research Institute of Texas (RP180309 and RP160693) (M.K.), and the MD Anderson Cancer Center Sister Institution Network Fund (M.K.).
Authorship
Contribution: M.K. and Y.T. designed the study; H.Y., Q.Z., K. Saito, and K.Y. performed experiments and analyzed data; T.A. designed experiments and wrote the paper; V.R., N.B., T.C., H.M., R.J., V.K., K.M., and K. Suzuki performed experiments; T.M. and Y.-M.K. discussed experiments; J.I., S.K., and K.I. were involved in statistical analysis; C.P.V., M.A., and J.R.M. discussed experiments and helped interpret data; and all authors critically reviewed and revised the manuscript for content and approved the manuscript for publication.
Conflicts-of-interest disclosure: The authors declare no competing financial interests.
Correspondence: Marina Konopleva, Department of Leukemia, The University of Texas MD Anderson Cancer Center, 1400 Holcombe Blvd, FC3.3048, Houston, TX 77030; e-mail: mkonople@mdanderson.org; and Yoko Tabe, Department of Clinical Laboratory Medicine, Juntendo University Graduate School of Medicine, 2-1-1 Hongo, Bunkyo City, Tokyo 113-8421, Japan; e-mail: tabe@juntendo.ac.jp.

