

Key Points
Two-year survivors of allogeneic BMT have a higher risk of late-occurring VTE compared with siblings without cancer.
A clinical risk-prediction model is able to discriminate BMT survivors at low or high risk of late-occurring VTE.

Abstract
Allogeneic blood or marrow transplant (BMT) recipients are at risk for venous thromboembolism (VTE) because of high-intensity therapeutic exposures, comorbidities, and a proinflammatory state due to chronic graft-versus-host disease (GVHD). The long-term risk of VTE in allogeneic BMT survivors remains unstudied. Participants were drawn from the Blood or Marrow Transplant Survivor Study (BMTSS), a retrospective cohort study that included patients who underwent transplantation between 1974 and 2014 and survived ≥2 years after BMT. We analyzed the risk of VTE in 1554 2-year survivors of allogeneic BMT compared with 907 siblings. Using backward variable selection guided by minimizing Akaike information criterion, we created a prediction model for risk of late-occurring VTE. Allogeneic BMT survivors had a 7.3-fold higher risk of VTE compared with siblings (95% CI, 4.69-11.46; P < .0001). After a median follow-up of 11 years, conditional on surviving the first 2 years after BMT, the cumulative incidence of late-occurring VTE was 2.4% at 5 years, 4.9% at 10 years, and 7.1% at 20 years after BMT. The final model for VTE risk at 2 years post-BMT included History of stroke, chronic GVHD, Hypertension, Sex (male vs female) and Stem cell source (peripheral blood stem cells vs other) (“HiGHS2”) (corrected C-statistics: 0.73; 95% CI = 0.67-0.79). This model was able to classify patients at high and low VTE risk (10-year cumulative incidence, 9.3% vs 2.4% respectively; P < .0001). The BMTSS HiGHS2 risk model when applied at 2 years post-BMT can be used to inform targeted prevention strategies for patients at high risk for late-occurring VTE.
Introduction
Venous thromboembolism (VTE) is a serious event in the general population, and is associated with a high risk of subsequent mortality.1 Cancer is a well-recognized risk factor for VTE, likely due to the altered inflammation and coagulation profile in cancer patients when compared with individuals without a history of cancer.2 The risk depends on both cancer-related factors (type and stage of cancer, therapeutic exposures) and patient-related factors (age and comorbidities).3-6 Patients undergoing blood or marrow transplant (BMT) are uniquely vulnerable to VTE due to the higher intensity of therapeutic exposures, prolonged hospitalizations and attendant immobility, the higher burden of preexisting as well as new-onset comorbidities, and the proinflammatory state induced by graft-versus-host disease (GVHD) in allogeneic BMT recipients.7-9 We have previously shown an increased risk of mortality in BMT survivors with a history of VTE.10
Advances in transplantation strategies have resulted in a growing number of BMT survivors, expected to exceed 500000 by 2030 in the United States.11 Previous reports of VTE in BMT recipients have focused on the early posttransplant period (first 100 days), with a widely varying incidence (0.5% to 23.5%) due to small samples and the methods used for diagnosing VTE.12 A comprehensive assessment of the incidence and risk factors for VTE in long-term allogeneic BMT survivors remains unstudied. Furthermore, there are no risk-prediction models for VTE in BMT survivors, given that the widely used Khorana VTE risk score excluded BMT patients.13,14
We addressed these gaps by using the resources offered by the Blood or Marrow Transplant Survivor Study (BMTSS) to determine the risk of late-occurring VTE and developed a clinical risk-prediction model for VTE in long-term survivors of allogeneic BMT. We hypothesized that the risk of VTE would be elevated several years after allogeneic BMT, likely due to continued inflammatory state from chronic GVHD, endothelial damage from prior chemotherapy and radiation, and comorbidities, and that key sociodemographic characteristics, comorbidities, and prior therapeutic exposures would be associated with VTE risk.
Materials and methods
Methods
BMTSS is a collaborative effort between City of Hope (COH), University of Minnesota (UMN), and University of Alabama at Birmingham (UAB). BMTSS is a retrospective cohort study that aims to examine the long-term outcomes in individuals who have survived ≥2 years after undergoing BMT between 1 January 1974 and 31 December 2014 at 1 of the 3 institutions. Siblings of BMTSS participants serve as a noncancer comparison group. The human subjects committees at participating institutions approved the study; informed consent was provided according to the Declaration of Helsinki. For the current study, patients who were alive and 18 years or older at study were included. The underlying hematologic conditions included acute myeloid leukemia (AML)/myelodysplastic syndrome (MDS), chronic myelogenous leukemia (CML), non-Hodgkin lymphoma (NHL), acute lymphoblastic leukemia (ALL), and severe aplastic anemia (SAA).
Information regarding primary cancer diagnosis, transplant preparative regimens, stem cell source, and graft type (bone marrow, cord blood, or peripheral blood stem cells [PBSCs]) was obtained from institutional databases and medical records. A BMTSS survey administered to the eligible study participants covered the following content: diagnosis by a health care provider of specific chronic health conditions (including VTE), along with age at diagnosis; relapse of primary cancer and development of subsequent neoplasms; history of acute and chronic GVHD; and medication use. Study participants were queried about VTE by asking whether they were diagnosed with a blood clot in their lung, arm, leg, head, or pelvis. If they indicated yes, then they were asked about the age of diagnosis. The survey also asked for a self-report of height and weight at study participation, and sociodemographic characteristics (sex, race/ethnicity, education, employment, household income, and health insurance), history of smoking (age when they started smoking, number of cigarettes per day, years of smoking), alcohol use, and physical activity.15 Siblings completed an identical survey, but without BMT-specific questions. The reliability and validity of the BMTSS questionnaire has been tested, showing that BMT survivors are able to report their outcomes with a high degree of accuracy.16
Statistical analysis
Descriptive statistics including mean, standard deviation (SD), median, range, and frequencies were used to characterize the study population. The 2-sample t test or Wilcoxon rank-sum test (for continuous variables) and the χ2 test (for categorical variables) were used to compare BMT survivors and siblings. We calculated cumulative incidence of VTE in BMT survivors and siblings as a function of attained age. Cox regression analysis was used to examine the risk of late-occurring VTE in allogeneic BMT survivors compared with VTE occurring in siblings. Backward variable selection was used to adjust for relevant confounders; the following variables were examined: sex, race/ethnicity, education, annual household income, smoking and alcohol history, physical activity, body mass index (BMI), comorbidities (hypertension, diabetes, dyslipidemia, chronic kidney disease, congestive heart failure, arrhythmias, and stroke) and medications (oral contraceptives and hormone replacement therapy).
In the analysis restricted to the BMT survivors, we calculated the cumulative incidence of late-occurring VTE (occurring ≥2 years after BMT) as a function of time from BMT for the entire cohort as well as by transplant era (arbitrarily set at before and after 1990). Multivariable Cox regression analysis was used for identifying predictors of VTE risk among BMT survivors.17 Risk factors evaluated included age at BMT, sociodemographics, primary hematologic malignancy, pre-BMT chemotherapy and radiation, stem cell source, conditioning regimen, history of chronic GVHD, dyslipidemia, BMI, hypertension, diabetes, chronic kidney disease, congestive heart failure, coronary heart disease, stroke, arrhythmia, health behaviors, and medications such as oral contraceptives, hormone replacement therapy, and immunosuppressants. Relapse of primary hematologic malignancy and development of subsequent neoplasms, medications, chronic health conditions, and chronic GVHD were treated as time-varying variables. Given the relatively low rates of VTE, parsimonious models were created using backward variable selection, keeping variables with P < .1 from the multivariable analysis in the model. Two-sided tests with a P value < .05 were considered statistically significant. All analyses were performed with SAS software version 9.4 (SAS Institute Inc, Cary, NC).
A risk-prediction model for VTE was developed including potential predictor variables including age at BMT, sex, race/ethnicity, health behaviors, medications, primary hematologic malignancy, stem cell source, conditioning regimen, BMI, chronic health conditions, and history of chronic GVHD at the 2-year timepoint from BMT. The overall calibration of the prediction model was measured by a model-based goodness-of-fit test for time-to-event data.18 A calibration plot was used to visually describe the agreement between observed vs predicted rates at 5 years and 10 years after BMT; a slope of 1 indicated perfect calibration. The discrimination of the model was assessed by the index of concordance, or C-statistic, which takes censoring into account in time-to-event models. The bias/optimism-corrected C-statistic was obtained using 1000 bootstrap iterations to adjust for optimism in a measure of predictive ability. In each bootstrap iteration, based on the model coefficient fitted within bootstrap data, C-statistics were estimated for bootstrap data, denoted as Cb, boot., as well as original data, denoted as Cb, orig. The bias/optimism was calculated using the averaged difference between the Cb, boot. and Cb, orig, denoted as Oc. The corrected C-statistics were thus calculated as original C-statistics minus OC. By doing so, the optimism of C-statistics in the training set is corrected, which returns more robust estimation of true C-statistics than splitting data into training and testing sets (for validation), which might involve a huge sampling variability. Low- and high-risk groups were identified based on the risk scores obtained from the hazard ratios (HRs) from the prediction model.
Results
Overall, 3315 eligible BMT survivors were identified. Of these, 288 (8.7%) were lost to follow-up. Of the 3027 patients approached, 1751 (57.8%) participated by completing the survey (Figure 1). Participants were older at BMT (mean age, 38 years vs 30 years; P < .0001), were more likely to be female (46.6% vs 42.8%; P = .04) and non-Hispanic Whites (78.1% vs 62.9%; P < .0001) compared with nonparticipants. Patients with a history of VTE prior to BMT (n = 106) or those who developed VTE within 2 years after BMT (n = 91) were excluded from the analysis because we were interested in studying the risk of new-onset and late-occurring VTE in BMT survivors. For those with missing age at diagnosis of VTE (n = 10), mean imputation was used to impute the age of onset based on values from patients with same age, primary diagnosis, and era of BMT. The final analysis included 1554 allogeneic BMT survivors. Nine hundred seven siblings without a history of cancer were included as a comparison group.
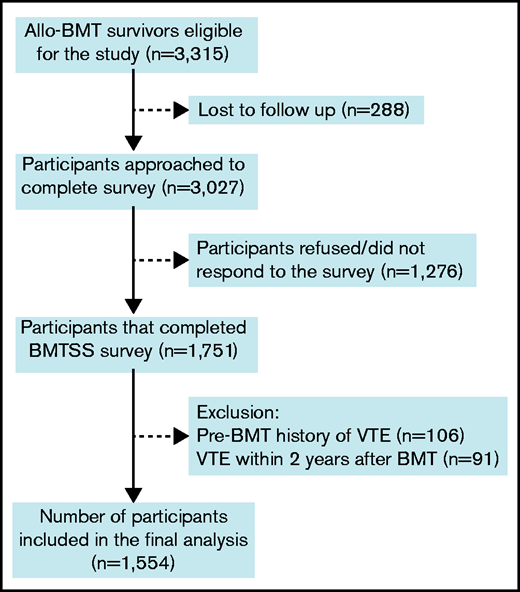
Consort diagram for participants included in the study. Allo-BMT, allogeneic BMT.
Consort diagram for participants included in the study. Allo-BMT, allogeneic BMT.
Patient characteristics
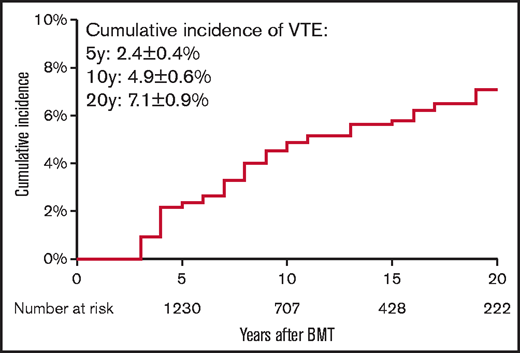
Demographic and clinical characteristics of the 1554 allogeneic BMT survivors and the 907 siblings are summarized in Table 1. Mean age at BMT was 37.4 years ± 18.4 years. BMT survivors were younger at study participation (50.5 years ± 15.4 years) as compared with the siblings (54.2 years ± 14.7 years; P < .0001). Median duration of follow-up from BMT to study participation was 11 years (interquartile range [IQR], 6-18 years). The BMT survivor cohort included 830 male participants (53.4%) and 1137 non-Hispanic Whites (73.2%). Primary diagnoses included AML/MDS in 617 patients (39.7%), CML in 260 patients (16.7%), ALL in 224 patients (14.4%), NHL in 207 patients (13.3%), and SAA in 87 patients (5.6%). PBSCs were the source of stem cells for 744 patients (47.9%), bone marrow for 642 patients (41.3%), and cord blood for 168 patients (10.8%). Fludarabine/melphalan-based conditioning was the most commonly used conditioning regimen and was used in 662 participants (42.6%). Anthracyclines were used as part of pretransplant chemotherapy in 896 patients (57.7%), cytarabine was used in 764 patients (49.2%), corticosteroids were used in 558 patients (35.9%), Vinca alkaloids were used in 475 patients (30.6%), and alkylators were used in 422 patients (27.2%). Radiation was used in 109 patients (7.0%). Overall, 80 patients (5.2%) developed VTE 2 years after BMT. The cumulative incidence of late-occurring VTE was 2.4% ± 0.4% at 5 years, 4.9% ± 0.6% at 10 years, and 7.1% ± 0.9% at 20 years post-BMT (Figure 2). The majority of our study participants underwent BMT after 1990 (91%). The cumulative incidence of VTE was significantly higher among those transplanted after 1990 compared with those who had BMT prior to 1990 (0.69% vs 5.39% at 10 years; P = .001).
Demographic and clinical characteristics of allogeneic BMT survivors and siblings
| Variable | BMT survivors, n = 1554 | Siblings, n = 907 | P |
|---|---|---|---|
| VTE, n (%) | |||
| Yes | 80 (5.15) | 29 (3.20) | .023 |
| Age at survey, y | |||
| Mean (SD) | 50.51 (15.38) | 54.17 (14.65) | <.0001 |
| Sex, n (%) | |||
| Male | 830 (53.41) | 361 (39.80) | <.0001 |
| Race/Ethnicity, n (%) | <.0001 | ||
| White | 1137 (73.17) | 783 (86.33) | |
| Hispanic | 236 (15.19) | 66 (7.28) | |
| Asian | 30 (1.93) | 19 (2.09) | |
| Black | 104 (6.69) | 29 (3.20) | |
| Other | 47 (3.02) | 10 (1.10) | |
| Education, n (%) | .0005 | ||
| ≤High school | 264 (16.99) | 117 (12.90) | |
| Some college | 565 (36.36) | 310 (34.18) | |
| College graduate | 679 (43.69) | 473 (52.15) | |
| Missing | 46 (2.96) | 7 (0.77) | |
| Household income, n (%) | <.0001 | ||
| ≤$50000 | 458 (29.47) | 198 (21.83) | |
| $50000-$100000 | 435 (27.99) | 268 (29.55) | |
| >$100000 | 633 (40.73) | 347 (38.26) | |
| Missing | 28 (1.80) | 94 (10.36) | |
| History of smoking, n (%) | |||
| Ever | 478 (30.76) | 353 (38.92) | <.0001 |
| Alcohol intake, n (%) | |||
| Yes | 768 (48.42) | 540 (59.54) | <.0001 |
| Exercise, n (%) | |||
| Yes | 1106 (71.17) | 725 (79.93) | <.0001 |
| Comorbidities, n (%) | |||
| Diabetes | 228 (15.33) | 38 (4.33) | <.0001 |
| Hypertension | 448 (33.09) | 187 (22.48) | <.0001 |
| Dyslipidemia | 411 (30.22) | 155 (18.59) | <.0001 |
| Chronic kidney disease | 58 (3.77) | 33 (3.65) | .877 |
| Congestive heart failure | 65 (4.20) | 13 (1.44) | .0002 |
| Coronary heart disease | 52 (3.35) | 26 (2.87) | .507 |
| Arrhythmia | 143 (9.43) | 59 (6.58) | .014 |
| Stroke | 50 (3.22) | 14 (1.55) | .012 |
| Chronic GVHD | 506 (34.47) | Not applicable | Not applicable |
| Medications, n (%) | |||
| Oral contraceptive use | 446 (28.70) | 407 (44.87) | <.0001 |
| Female hormone replacement | 532 (34.23) | 105 (11.58) | <.0001 |
| Testosterone replacement | 235 (15.12) | 40 (4.41) | <.0001 |
| Immunosuppressants | 959 (61.71) | 44 (4.85) | <.0001 |
Risk of VTE in BMT survivors vs siblings
Adjusting for sociodemographics, medications, health behaviors, and chronic health conditions, the risk of developing a VTE was 7.3-fold higher in allogeneic BMT survivors (HR = 7.3; 95% confidence interval [CI] = 4.69-11.46; P < .0001) as compared with siblings (Table 2).
Risk of VTE in allogeneic BMT survivors compared with a sibling cohort
| Variable | Univariable | Multivariable | ||||
|---|---|---|---|---|---|---|
| HR | 95% CI | P | HR | 95% CI | P | |
| Cohort | ||||||
| Siblings | 1.00 | |||||
| BMT cohort | 8.21 | (5.29-12.73) | <.0001 | 7.33 | (4.69-11.46) | <.0001 |
| Sex | ||||||
| Female | 1.00 | |||||
| Male | 1.53 | (1.04-2.24) | .029 | |||
| Race/Ethnicity | ||||||
| Non-Hispanic Whites | 1.00 | |||||
| Hispanic | 0.75 | (0.39-1.45) | .394 | |||
| Black | 0.45 | (0.06-3.25) | .431 | |||
| Asian | 1.10 | (0.48-2.53) | .815 | |||
| Other | 0.85 | (0.21-3.45) | .819 | |||
| Education | ||||||
| ≤High school | 1.00 | |||||
| Some college | 1.16 | (0.64-2.08) | .632 | |||
| College graduate | 1.06 | (0.59-1.89) | .848 | |||
| Household income | ||||||
| ≤$50000 | 1.00 | |||||
| $50000-$100000 | 0.78 | (0.47-1.30) | .333 | |||
| >$100000 | 0.96 | (0.61-1.51) | .853 | |||
| Missing | 0.73 | (0.28-1.89) | .519 | |||
| Exercise, yes vs no | ||||||
| Any exercise | 0.89 | (0.59-1.34) | .581 | |||
| Vigorous exercise | 1.14 | (0.78-1.67) | .508 | |||
| Moderate exercise | 0.82 | (0.55-1.22) | .321 | |||
| History of smoking | ||||||
| Yes | 0.28 | (0.07-1.12) | .072 | |||
| Alcohol intake | ||||||
| Yes | 0.85 | (0.58-1.25) | .406 | |||
| Diabetes | ||||||
| Yes | 2.90 | (1.70-4.94) | <.0001 | 1.57 | (0.92-2.66) | .096 |
| Hypertension | ||||||
| Yes | 2.44 | (1.57-3.80) | <.0001 | |||
| BMI | 1.02 | (0.99-1.04) | .267 | |||
| Dyslipidemia | ||||||
| Yes | 2.55 | (1.60-4.06) | <.0001 | |||
| Chronic kidney disease | ||||||
| Yes | 3.28 | (1.51-7.10) | .003 | 2.24 | (1.03-4.87) | .043 |
| Congestive heart failure | ||||||
| Yes | 1.05 | (0.25-4.38) | .946 | |||
| Arrhythmia | ||||||
| Yes | 2.21 | (1.20-4.08) | .011 | |||
| Stroke | ||||||
| Yes | 6.28 | (2.82-13.96) | <.0001 | 4.07 | (1.84-9.01) | .0005 |
| Use of oral contraceptive pills | ||||||
| Yes | 0.76 | (0.31-1.87) | .550 | |||
| Female hormone replacement | ||||||
| Yes | 1.15 | (0.72-1.86) | .559 | |||
| Testosterone replacement | ||||||
| Yes | 1.70 | (0.79-3.67) | .175 | |||
Bold values in the table body represent statistical significance.
Risk factors for VTE among allogeneic BMT survivors
Risk factors associated with late-occurring VTE included older age at BMT (HR = 1.02 per year; 95% CI = 1.01-1.04; P = .002), use of immunosuppressive medications (HR = 2.28; 95% CI = 1.41-3.38; P = .0008), obesity (HR = 1.06 per unit increase in BMI; 95% CI = 1.02-1.10; P = .002), history of stroke (HR = 3.71; 95% CI = 1.66-8.27; P = .001), chronic GVHD (HR = 1.62; 95% CI = 1.00-2.60; P = .049), and use of PBSCs (HR = 2.73; 95% CI = 1.65-4.50; P < .0001) as source of stem cells compared with bone marrow (Table 3). Use of cord blood as the source of stem cells compared with bone marrow (HR = 1.87; 95% CI, 0.99-3.55; P = .055) and history of chronic kidney disease (HR = 2.23; 95% CI, 0.95-5.19; P = .064) were also associated with increased VTE risk and approached statistical significance. Diagnosis of CML was associated with lower VTE risk (HR = 0.27; 95% CI, 0.11-0.69; P = .006). Of note, relapse of primary disease or development of new cancer were not associated with increased risk of VTE.
Risk factors for VTE in allogeneic BMT survivors
| Category | Univariable | Multivariable (P < .2 in univariate) | Parsimonious model* | ||||||
|---|---|---|---|---|---|---|---|---|---|
| HR | 95% CI | P | HR | 95% CI | P | HR | 95% CI | P | |
| Age at BMT | |||||||||
| Per year increase in age | 1.03 | 1.02-1.05 | <.0001 | 1.01 | 0.99-1.03 | .30 | 1.02 | 1.01-1.04 | .002 |
| Sex (reference: female) | |||||||||
| Male | 1.57 | (0.99-2.49) | .055 | 1.56 | (0.97-2.49) | .064 | 1.52 | (0.95-2.42) | .080 |
| Race (reference: non-Hispanic Whites) | |||||||||
| Hispanic | 0.79 | (0.39-1.60) | .518 | ||||||
| Black | 0.57 | (0.08-4.09) | .574 | ||||||
| Asian | 1.09 | (0.44-2.72) | .850 | ||||||
| Other | 0.82 | (0.20-3.36) | .785 | ||||||
| Education (reference: ≤high school) | |||||||||
| Some college | 1.17 | (0.59-2.30) | .661 | ||||||
| College graduate | 1.38 | (0.72-2.64) | .332 | ||||||
| Income (reference: <$50000) | |||||||||
| $50000-$100000 | 0.96 | (0.53-1.73) | .892 | ||||||
| >$100000 | 1.09 | (0.64-1.85) | .751 | ||||||
| Missing | 1.23 | (0.29-5.19) | .782 | ||||||
| Health behaviors/Medications | |||||||||
| Oral contraceptives | 0.55 | (0.22-1.36) | .196 | ||||||
| Female hormone replacement | 0.94 | (0.57-1.56) | .811 | ||||||
| Testosterone replacement | 1.28 | (0.59-2.79) | .534 | ||||||
| Immunosuppression | 2.74 | (1.74-4.31) | <.0001 | 2.05 | (1.25-3.35) | .004 | 2.28 | (1.41-3.68) | .0008 |
| Alcohol | 1.18 | (0.75-1.85) | .484 | ||||||
| Smoking | 0.35 | (0.09-1.41) | .140 | 0.55 | (0.20-1.52) | .250 | |||
| Comorbidities | |||||||||
| Diabetes | 2.18 | (1.25-3.80) | .006 | 1.15 | (0.62-2.10) | .662 | |||
| Hypertension | 2.24 | (1.43-3.50) | .0004 | 1.17 | (0.70-1.95) | .549 | |||
| Dyslipidemia | 2.25 | (1.42-3.57) | .0006 | 1.12 | (0.66-1.90) | .676 | |||
| Obesity, BMI | 1.05 | 1.01-1.08 | .014 | 1.06 | 1.02-1.10 | .006 | 1.06 | 1.02-1.10 | .002 |
| Chronic kidney disease | 2.73 | (1.19-6.3) | .018 | 2.11 | (0.88-5.06) | .094 | 2.23 | (0.95-5.19) | .064 |
| Congestive heart failure | 0.91 | (0.22-3.73) | .901 | ||||||
| Arrhythmia | 1.75 | (0.90-3.40) | .099 | ||||||
| Stroke | 4.59 | (2.10-9.99) | .0001 | 3.12 | (1.37-7.11) | .007 | 3.71 | (1.66-8.27) | .001 |
| Chronic GVHD | 1.99 | (1.27-3.10) | .003 | 1.42 | (0.87-2.33) | .162 | 1.62 | (1.00-2.60) | .049 |
| Relapse/secondary malignant neoplasm | NA | NA | NA | ||||||
| Primary diagnosis (reference: NHL) | |||||||||
| ALL | 0.70 | (0.33-1.50) | .361 | 1.41 | (0.48-4.13) | .534 | 1.12 | (0.51-2.46) | .773 |
| AML/MDS | 0.70 | (0.37-1.32) | .272 | 1.31 | (0.42-4.04) | .641 | 0.84 | (0.44-1.6) | .601 |
| CML | 0.25 | (0.10-0.62) | .003 | 0.62 | (0.14-2.66) | .519 | 0.27 | (0.11-0.69) | .006 |
| SAA | 0.09 | (0.01-0.71) | .022 | 0.33 | (0.04-3.07) | .330 | 0.16 | (0.02-1.23) | .078 |
| Other | 0.97 | (0.46-2.04) | .936 | 2.52 | (1.01-6.29) | .048 | 1.915 | (0.88-4.18) | .103 |
| Stem cell source (reference: bone marrow) | |||||||||
| PBSCs | 0.39 | (0.17-0.89) | .025 | 1.67 | (0.79-3.52) | .176 | 2.73 | (1.65-4.50) | <.0001 |
| Cord Blood | 1.65 | (0.77-3.50) | .195 | 1.02 | (0.38-2.75) | .964 | 1.87 | (0.99-3.55) | .055 |
| Conditioning regimen (reference: others) | |||||||||
| Fludarabine + melphalan based | 3.34 | (2.05- 5.44) | <.0001 | 1.46 | (0.78-2.75) | .237 | |||
| Pre-BMT chemotherapy | |||||||||
| Cytarabine | 1.34 | (0.85-2.10) | .209 | ||||||
| Cyclophosphamide/Ifosfamide | 2.13 | (1.33-3.43) | .002 | 0.77 | (0.30-2.00) | .594 | |||
| Platinum | 2.45 | (1.28-4.69) | .007 | 1.11 | (0.45-2.69) | .826 | |||
| Etoposide | 1.33 | (0.74-2.38) | .345 | ||||||
| Rituximab | 3.14 | (1.76-5.62) | .0001 | 1.34 | (0.53-3.35) | .533 | |||
| Steroid | 1.68 | (1.07-2.64) | .025 | 0.95 | (0.39-2.35) | .913 | |||
| Anthracycline | 2.13 | (1.31-3.47) | .002 | 1.18 | (0.60-2.34) | .629 | |||
| Vinca alkaloids | 2.15 | (1.36-3.38) | .001 | 1.59 | (0.46-5.51) | .461 | |||
| Hydroxyurea | 0.45 | (0.23-0.91) | .026 | 0.98 | (0.33-0.93) | .025 | |||
| Methotrexate | 1.36 | (0.82-2.24) | .237 | ||||||
| Asparaginase | 1.46 | (0.79-2.71) | .229 | ||||||
| Other | 1.53 | (0.97-2.42) | .068 | ||||||
| Radiation (reference: no radiation)† | |||||||||
| Any radiation | 1.24 | (0.60-2.59) | .564 | ||||||
| Chest | NA | NA | NA | ||||||
| Neck | 1.75 | (0.24-12.62) | .577 | ||||||
| Head | 1.33 | (0.53-3.31) | .543 | ||||||
| Abdomen | 1.82 | (0.25-13.12) | .553 | ||||||
| Extremity | 1.82 | (0.25-13.07) | .554 | ||||||
| Radiation dose, cGy (reference: no radiation) | |||||||||
| <2000 | 2.22 | (0.55-9.09) | .265 | ||||||
| 2000-3000 | 1.11 | (0.27-4.61) | .881 | ||||||
| 3000-4000 | 2.18 | (0.53-8.91) | .277 | ||||||
| >4000 | 1.58 | (0.39-6.46) | .524 | ||||||
Bold values in the table body represent statistical significance.
The parsimonious model was obtained using backward variable selection, keeping variables with P < .1 in the model.
Radiation includes pre-BMT radiation and/or total-body irradiation.
Risk-prediction model for late-occurring VTE among allogeneic BMT survivors
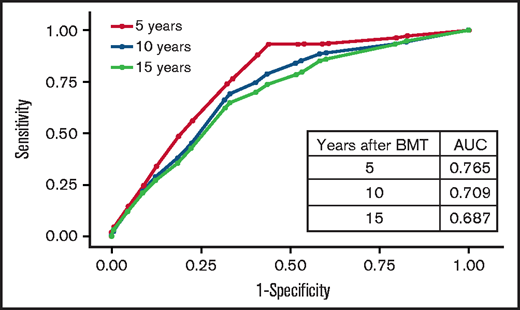
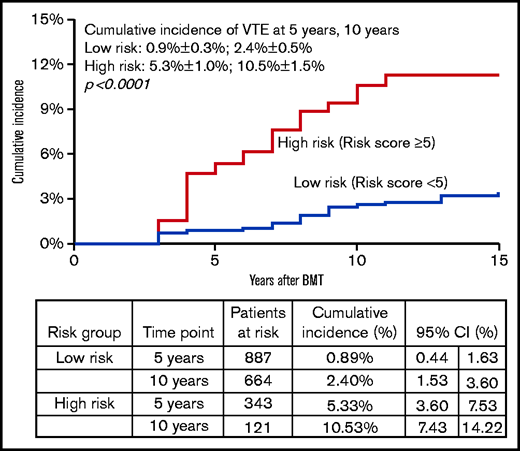
Backward variable selection guided by minimizing the Akaike information criterion was used to create the risk-prediction model; we included chronic health conditions and health behaviors as risk factors only if they were present at the 2-year timepoint. The final model for VTE risk applied at 2 years post-BMT, “HiGHS2,” included History of stroke, chronic GVHD, Hypertension, Sex (male vs female), and Stem cell source (PBSCs vs other) (Table 4). The corrected C-statistics using the bootstrap method were 0.73 (95% CI, 0.67-0.79). The goodness-of-fit statistics had a P value of .35, indicating overall agreement between observed and predicted value. Receiver operated characteristic curves for VTE risk by time after BMT are shown in Figure 3. The calibration plots showed similar conclusion to the goodness-of-fit test in a graphical way. We stratified patients into 2 risk groups using the risk scores from the risk-prediction model: the high-risk group included BMT survivors with a risk score ≥5. The cumulative incidence of VTE at 5 years and 10 years after BMT was 5.3% ± 1.0% and 9.3% ± 1.5% in the high-risk group compared with 0.9% ± 0.3% and 2.4% ± 0.5% in the low-risk group (P < .0001), respectively, among BMT survivors who entered the cohort at 2 years post-BMT (Figure 4).
HiGHS2 risk prediction model for VTE in long-term allogeneic BMT survivors
| Variable | β estimation | SE | HR | 95% CI | P | Risk score |
|---|---|---|---|---|---|---|
| History of stroke | 1.0755 | 0.5189 | 2.93 | (1.06-8.10) | .038 | 3 |
| Chronic GVHD | 0.3517 | 0.2527 | 1.42 | (0.87-2.33) | .164 | 1 |
| Hypertension | 0.6845 | 0.2579 | 1.98 | (1.20-3.29) | .008 | 2 |
| Sex, male | 0.6138 | 0.2578 | 1.85 | (1.11-3.06) | .017 | 2 |
| Stem cell source, PBSC | 1.0394 | 0.2739 | 2.83 | (1.65-4.84) | .0001 | 3 |
Hypertension, stroke, and chronic GVHD were evaluated at 2 years after BMT.
SE, standard error.
Discussion
We found the risk of VTE to be 7.3-fold higher among allogeneic BMT survivors when compared with a sibling cohort without cancer. Conditional on surviving ≥2 years after allogeneic BMT and excluding the participants who had VTE within 2 years of BMT, the 10-year cumulative incidence of VTE was 4.9%. Older age at BMT, transplantation with PBSCs, obesity, a history of stroke, chronic GVHD, and use of immunosuppression were associated with an increased risk of VTE. We derived a HiGHS2 VTE risk-prediction model for 2-year allogeneic BMT survivors including 5 sociodemographic and clinical factors: sex, use of PBSCs, history of hypertension, stroke, and chronic GVHD.
Previous studies examining the risk of VTE in allogeneic BMT patients have focused on the peritransplant period with a short follow-up. The cumulative incidence of VTE in these studies has ranged from 4.6% at 6 months7 to 7.1% at 2 years.19 The elevated risk of VTE around the transplant period is likely due to indwelling central venous catheters, transplant preparative regimens, prolonged hospitalization/immobilization, and acute GVHD.7,19 Endothelial damage due to chemotherapy and/or radiation used for conditioning, and acute-phase reaction due to infection causes a procoagulant state in the early transplant period, increasing the risk of VTE.8 Serum levels of tumor necrosis factor α increase prior to adverse events such as severe acute GVHD, leading to endothelial leak syndrome and veno-occlusive disease.20 Presence of thrombocytopenia and bleeding complications in the immediate posttransplant period preclude the use of anticoagulation, which may also increase the risk of VTE.21,22
Cardiovascular risk factors (CVRFs) such as diabetes, hypertension, and dyslipidemia are common in long-term survivors of allogeneic BMT, and manifest at an earlier age.23 In addition, BMT survivors are at increased risk of developing atherosclerosis and arterial vascular events, especially in the presence of CVRFs.24 There has been a paucity of information regarding the long-term risk of VTE among allogeneic BMT survivors. We found that conditional on surviving the first 2 years after allogeneic BMT, the cumulative incidence of VTE was 4.9% at 10 years and 7.1% at 20 years post-BMT. We also showed a 7.3-fold higher risk of VTE in allogeneic BMT survivors when compared with a noncancer sibling population. These findings provide evidence for ongoing vigilance regarding this complication.
We confirmed the association between chronic GVHD and use of immunosuppression with risk of VTE in BMT recipients.7,12,19,25 In a previous study by Kekre et al, both acute and chronic GVHD were associated with increased risk of VTE; the majority of the VTE events occurred within the first year after BMT.19 This association may be due to the increased inflammation seen in patients with GVHD, or from treatment with immunosuppressive medications and steroids.26,27 VTE is predominantly a disease of the elderly28 ; we found that the risk of VTE increased with age at BMT. We also found that the use of PBSCs and cord blood for transplantation were associated with a higher risk of VTE compared with bone marrow. PBSC use is associated with increased risk of GVHD,29,30 and the immune dysregulation and use of immunosuppressive medications for treatment may lead to increased VTE risk. However, the association with PBSCs and cord blood transplantation was independent of a history of chronic GVHD and use of immunosuppression, suggesting that the pathophysiology of this association needs further investigation. Comorbidities such as obesity, chronic kidney disease, and stroke were also associated with increased risk of VTE as seen in the general population,31-34 and may be due to shared predisposing risk factors. Our previous study in NHL patients surviving BMT also showed increased risk of VTE in patients with obesity and chronic GVHD.35 Although the use of oral contraception and hormonal therapy increases the risk of VTE in women in the general population, our study did not identify this association in BMT survivors.
Previous risk models for cancer-associated VTE have excluded patients who underwent BMT. Studies assessing the risk of VTE in BMT patients were limited by small sample sizes and short follow-up. After a comprehensive evaluation of sociodemographics, comorbidities, health behaviors, and pre-BMT, and BMT-related therapeutic exposures, we developed a risk model for late-occurring VTE in allogeneic BMT survivors that included sex, stem cell source (PBSCs vs other), history of stroke, hypertension, and chronic GVHD. Immunosuppression was not included in the model due to collinearity with GVHD. The model showed good discrimination between those at high and low risk of late-occurring VTE.
Our study needs to be placed in the context of its limitations. The study relied on self-report for identifying patients with VTE. However, the validity of the BMTSS questionnaire examined previously showed that BMT survivors were able to report the occurrence of adverse medical conditions with accuracy.16 Because our study was based on patient surveys, we could not capture complete details regarding clinical presentation and laboratory abnormalities at the time of VTE development. Furthermore, the BMTSS survey did not ask for the history of recurrent VTEs. Future studies aimed at identifying biomarkers associated with VTE risk in BMT recipients are warranted. Information regarding site of VTE was missing in several patients, and peripheral arterial disease might have been classified as VTE in some participants as imaging studies were not used to confirm the diagnosis. Recall bias is also a limitation because the survey was administered only once. The survey included information regarding surgical history, level of physical activity, use of corticosteroids, and immunosuppressants at the time of survey completion, but we did not have this information at the time of VTE development. Central venous catheters are known risk factors for VTE in cancer patients.36 We do not have this information in our cohort, although it is unlikely for the majority of these patients to have a central line >2 years after BMT. The risk of VTE in BMT recipients was conditional on surviving the first 2 years after BMT. BMT recipients who died within the first 2 years were not included in the analysis, likely resulting in an underestimation of VTE risk after BMT. Our intention was to determine the risk of VTE in long-term BMT survivors. Although the risk-prediction model was not replicated in an independent population, the corrected C-statistics returned a more robust estimate of the true C-statistics that would be generated by creating training and test sets. These limitations notwithstanding, the current study used a large population of allogeneic BMT survivors with long-term follow-up. We were able to assess the impact of pre-BMT and BMT-related therapeutic exposures, in addition to sociodemographics and chronic health conditions as risk factors for VTE, which is a major strength of the study. We found that the risk of VTE remains high several years after transplant, necessitating continued risk assessment and thromboprophylaxis in high-risk patients.
In conclusion, allogeneic BMT survivors have a 7.3-fold higher risk of VTE when compared with siblings without a history of cancer. The risk continues to increase for at least 10 years post-BMT. Although thromboprophylaxis is effective in preventing VTE in cancer patients, it is associated with substantial bleeding complications especially when patients are actively receiving chemotherapy and have thrombocytopenia.37,38 Ongoing risk assessment to identify high-risk populations is important to inform decisions regarding thromboprophylaxis. We developed a clinical risk-prediction model for VTE in allogeneic BMT survivors that was able to discriminate BMT survivors with low and high risk of VTE. The high incidence of VTE several years after BMT merits a discussion about thromboprophylaxis in high-risk patients in the absence of bleeding complications and thrombocytopenia. BMT survivors should be followed closely for timely diagnosis and treatment of cardiovascular risk factors. Our risk-prediction model will help in future prospective interventional studies and in proposing risk-based recommendations for thromboprophylaxis.
Acknowledgments
This work was supported in part by National Institutes of Health National Cancer Institute grants R01 CA078938 and U01 CA213140, and Leukemia & Lymphoma Society grant R6502-16 (S.B.).
Authorship
Contribution: R.G., L.H., J.W., L.F., D.J.W., S.J.F., M.A., S.H.A., and S.B. contributed to the study design; L.H., J.W., L.F., M.K., S.H.A., M.A., and S.B. contributed to data collection; R.G., Y.C., L.H., J.W., S.H.A., and S.B. contributed to analyses and interpretation of results; R.G and S.B. wrote the manuscript; and all authors critically revised the manuscript for important intellectual content and approved the final manuscript.
Conflict-of-interest disclosure: R.G. serves as a consultant for Sanofi Genzyme and Alexion. D.J.W. received research funding from Fate Therapeutics and Incyte. M.A. received research funding from Pharmacyclics, Kadmon, and Sundax, and serves as a consultant for Fate Therapeutics. The remaining authors declare no competing financial interests.
Correspondence: Radhika Gangaraju, Institute for Cancer Outcomes and Survivorship, University of Alabama at Birmingham, 1600 7th Ave S, Lowder 500, Birmingham, AL 35233; e-mail: rgangaraju@uabmc.edu.

