

Key Points
Chromosomal defects in 2q and 5q were related to poor prognoses for patients with ATL after allo-HSCT.
In patients with ATL, a complex karyotype and several chromosomal defects were associated with ATL-related death after allo-HSCT.

Abstract
Adult T-cell leukemia/lymphoma (ATL) cells frequently exhibit chromosomal abnormalities, including numerical aberrations and structural defects. However, no studies have examined the correlation between these abnormalities and survival in patients with ATL after allogeneic HSCT (allo-HSCT). In this study, 300 patients with ATL (median age, 55 years; range, 24-74) who were registered in a Japanese nationwide registry database were analyzed. The majority (n = 183) had acute ATL. Specimens for chromosomal analysis were collected from bone marrow (n = 166), lymph nodes (n = 86), peripheral blood (n = 41), and other locations (n = 7). In survival analyses, breakpoints at 2q (hazard ratio [HR], 1.63; 95% confidence interval [CI], 1.12-2.38; P = .012) and 5q (HR, 2.18; 95% CI, 1.25-3.80; P = .006) were significantly poor prognostic factors for overall survival (OS). In terms of ATL-related death, loss of chromosome 14 and breakpoints at 3p, 1q, 5q, and 6q were extracted as significantly poor prognostic factors. Moreover, complex karyotypes were associated with ATL-related death. This study of the survival impact of chromosomal abnormalities in patients with ATL after allo-HSCT demonstrated that several structural breakpoints were independent risk factors for OS and ATL-related death.
Introduction
Adult T-cell leukemia/lymphoma (ATL) is a peripheral T-cell neoplasm with poor prognosis that is caused by human T-cell leukemia virus type 1 (HTLV-1).1-3 Clinically, ATL is classified according to the Shimoyama classification, which groups ATL into 4 subtypes: smoldering, chronic, lymphoma, and acute.4 Acute and lymphoma-type ATL and chronic ATL with unfavorable prognostic factors are considered to be aggressive forms of the disease. Allogeneic hematopoietic stem cell transplantation (allo-HSCT) is the standard curative treatment option for aggressive-type ATL,5-9 and the 3-year overall survival (OS) rate is 36% in the largest retrospective study conducted to date.7 Several prognostic indices have been developed for patients with ATL.3,10-12 Recently, Yoshimitsu et al reported a prognostic index specifically in patients with ATL who underwent allo-HSCT.11
It has been reported that ATL cells normally exhibit chromosomal abnormalities, such as numerical aberrations and structural defects.13 However, only 1 small study has assessed the relationship between these chromosomal abnormalities and survival outcomes in patients with ATL,14 and no study has investigated the relationship in allo-HSCT recipients. It is presumed that patients who receive only chemotherapy will demonstrate a significant difference, in terms of abnormal chromosome profiles related to survival outcomes, from those who undergo allo-HSCT. Thus, it is important to clarify the survival impact of chromosomal abnormalities in patients with ATL who undergo allo-HSCT. Moreover, this chromosome information may be a significant factor when added to existing prognostic models.
HTLV-1 is endemic in Japan, and the prevalence of HTLV-1 in the Japanese population was reported to be ∼1%.15 More than 1500 patients with ATL who underwent allo-HSCT were registered before December 2012 in the Japanese Transplant Registry Unified Management Program (TRUMP), which is the nationwide survey database of the Japanese Data Center for Hematopoietic Cell Transplantation. On behalf of the ATL working group of the Japan Society for Hematopoietic Cell Transplantation (JSHCT), we analyzed the TRUMP database and herein report the impact of chromosomal abnormalities on survival in patients receiving allo-HSCT.
Methods
Data collection
A total of 756 patients with ATL were enrolled in the TRUMP database from January 2000 through December 2012. To collect detailed information regarding chromosomal analysis and clinical background that was not listed in the TRUMP database, we conducted a nationwide secondary survey of these 756 patients. The response rate to the case report form was 69.8% (n = 528). The exclusion criteria were as follows: lack of chromosomal analysis (n = 37), insufficient information on G-banding (n = 56) or information on posttransplantation chromosome testing (n = 4), the presence of multiploidy (n = 30), lack of mitosis or clonality (n = 12), and lack of chromosomal information on the bone marrow (BM) in the absence of ATL invasion of the BM (n = 89). As a result, 300 patients (170 male, 130 female) were analyzed (supplemental Figure 1A). There was no significant difference in OS between the 228 excluded patients and the 300 analyzed patients (P = .79; supplemental Figure 1B).
The study was approved by the data management committees of the JSHCT and the Institutional Ethics Committee of Imamura General Hospital.
Karyotype analyses
Karyotype analysis was conducted using G-banding. The analysis was conducted in all cases before stem cell transplantation. Two hundred fifty-seven patients were analyzed before initial chemotherapy, and 43 were analyzed after initial treatment. Abnormal karyotypes were analyzed in terms of numerical and structural abnormalities. Clones were defined by the International System for Human Cytogenetic Nomenclature, 1995 version.16 To identify specific abnormalities and exclude secondary changes, the stemline karyotype, which indicates the simplest abnormal clone, was used as the representative karyotype for analyses. A karyotype with 3 or more abnormalities was defined as complex. We selected chromosomal abnormalities that occurred in at least 15 individuals as variables for subsequent survival analysis.
Statistical analyses
Analyzed variables were calculated with Fisher’s exact test in patients with normal and abnormal karyotypes. OS was analyzed with a Cox model, and transplant-related mortality (TRM) and ATL-related mortality were calculated with a competing-risk regression model. OS was defined as duration of survival between transplantation and death or date last verified. Because all of the causes of death other than ATL progression after transplantation were complications related to transplantation, TRM was defined as death of any cause other than ATL. ATL-related mortality was defined as death caused by disease progression of ATL. Multivariate analysis with the backward stepwise method was used to examine the association of OS and ATL-related death with each of the chromosomal abnormalities and other clinical variables, such as age (≥55 or <55 years), sex, type of ATL (acute or other), disease status (complete response [CR] or non-CR), and level of soluble IL-2 receptor (sIL2R; ≥20 000 U/mL or <20 000 U/mL). The results of univariate analyses of the association between each factor and OS, ATL-related death, and TRM are shown in supplemental Table 2. Furthermore, we identified significant abnormalities with Holm’s method and evaluated their correlations with the χ2 test. When a correlation existed between extracted abnormalities and ATL-related death, we used Gray’s test to perform a cumulative-incidence analysis of ATL-related death in patients with or without these abnormalities. Moreover, we conducted a survival analysis of complex karyotypes. Eventually, we performed a Kaplan-Meier analysis of OS and used Gray’s test to assess ATL-related death in terms of significant abnormalities, complex karyotypes, normal karyotypes, and several clonal evolutions from stemline karyotypes. Gray’s test for ATL-related death was used to calculate TRM as the competing risk. Regarding clonal evolutions, patients who had stemline karyotypes with 3 or more syngeneic clones were categorized as the high clonal evolution group. Statistical analysis was performed with the EZR software program.17 Statistical significance was defined as P < .05.
Results
Patient characteristics
Patient characteristics, including the variables that were used in the analysis model, are presented in Table 1. The median age of all the analyzed patients was 55 years (range, 24-74). At the time of chromosomal analysis, the ATL type was acute in 183 patients, lymphoma in 70, chronic in 33, and smoldering in 14. In terms of conditioning intensity, myeloablative conditioning (MAC) regimens and reduced-intensity conditioning (RIC) regimens were used in 118 and 182 patients, respectively. Regarding stem cell source, bone marrow transplantation and peripheral blood transplantation from a sibling donor were performed in 31 and 67 patients, respectively, whereas unrelated bone marrow and cord blood transplantations were performed in 137 and 65 patients, respectively. The median concentration of sIL-2R at diagnosis was 17 969 U/mL (range, 443-1 130 505). In this study, 204 patients demonstrated karyotypic abnormalities (supplemental Table 1). Specimens for chromosomal analysis were collected from BM (n = 166), lymph nodes (n = 86), peripheral blood (PB; n = 41), and other locations (n = 7). ATL cells in indolent cases tended to exhibit normal karyotypes. Although we excluded BM samples that showed no invasion, most of these samples showed normal karyotypes (Table 1).
Patient characteristics
| Variable | Total(n = 300) | Abnormal karyotype(n = 204) | Normal karyotype(n = 96) | P |
|---|---|---|---|---|
| Age | .316 | |||
| Median (range) | 55 (24-70) | 56 (25-70) | 54 (24-69) | |
| Sex | .314 | |||
| Male | 170 | 119 | 51 | |
| Female | 130 | 85 | 45 | |
| Disease type at diagnosis | <.001 | |||
| Acute | 183 | 129 | 56 | |
| Lymphoma | 70 | 55 | 15 | |
| Chronic | 33 | 16 | 15 | |
| Smoldering | 14 | 4 | 10 | |
| Conditioning regimens | .99 | |||
| MAC | 118 | 81 | 37 | |
| RIC | 182 | 123 | 59 | |
| Stem cell source | .887 | |||
| sib-BM | 31 | 21 | 10 | |
| sib-PB | 67 | 43 | 24 | |
| uBM | 137 | 96 | 41 | |
| uCB | 65 | 44 | 21 | |
| Samples | <.001 | |||
| PB | 41 | 34 | 7 | |
| BM | 166 | 84 | 82 | |
| Lymph node | 86 | 79 | 7 | |
| Others | 7 | 7 | 0 | |
| LDH level at diagnosis | .025 | |||
| Median, U/mL (range) | 487 (135-7 144) | 517.5 (169-7 144) | 424 (135-2 851) | |
| Level of sIL2R at diagnosis | .505 | |||
| Median, U/mL (range) | 17 969 (443.8-1 130 505) | 20 100 (443.8-254 000) | 14 798 (976-1 130 505) |
Data are the number of patients, unless stated otherwise. Statistically significant P values are in bold.
LDH, lactase dehydrogenase; sib-BM, bone marrow from sibling donor; sib-PB, peripheral blood from sibling donor; uBM, bone marrow from unrelated donor; uCB, cord blood from unrelated donor.
Frequency distributions of numerical and structural abnormalities
Frequency distributions of numerical and structural abnormalities are presented in Figure 1. Common numerical aberrations were losses of chromosome 14 (n = 44), 13 (n = 25), and Y (n = 23) and gains of chromosome 3 (n = 31). The median number of numerical abnormalities was 0 (range, 0-17; Figure 1A).
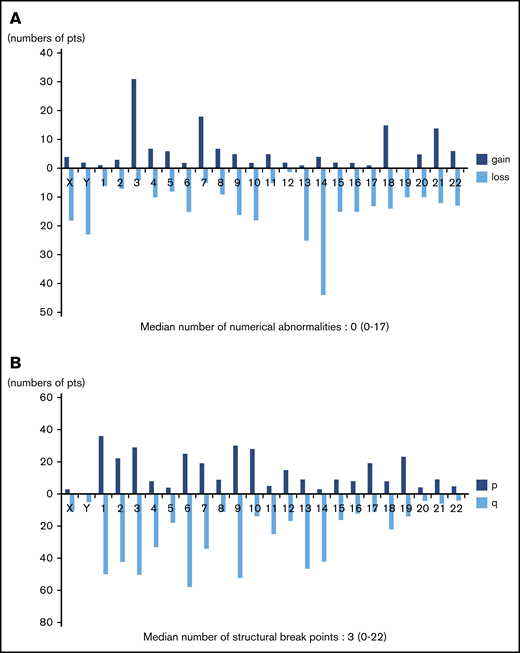
Distributions of numerical abnormalities and structural breakpoints. (A) Loss of chromosomes 14 (n = 44), 13 (n = 25), and Y (n = 23), and gain of chromosome 3 (n = 31), are common; the median number of these abnormalities is 0 (range, 0-17). (B) Structural breakpoints at 6q (n = 58), 9q (n = 52), 1q (n = 50), 3q (n = 50), 2q (n = 42), and 14q (n = 42) are common; the median number of structural breakpoints is 3 (range, 0-22).
Distributions of numerical abnormalities and structural breakpoints. (A) Loss of chromosomes 14 (n = 44), 13 (n = 25), and Y (n = 23), and gain of chromosome 3 (n = 31), are common; the median number of these abnormalities is 0 (range, 0-17). (B) Structural breakpoints at 6q (n = 58), 9q (n = 52), 1q (n = 50), 3q (n = 50), 2q (n = 42), and 14q (n = 42) are common; the median number of structural breakpoints is 3 (range, 0-22).
Meanwhile, structural abnormalities were frequently located at 6q (n = 58), 9q (n = 52), 1q (n = 50), 3q (n = 50), 2q (n = 42), and 14q (n = 42), and the median number of such abnormalities was 3 (range, 0-22; Figure 1B).
Survival analyses for each chromosomal abnormality
The median follow-up period after allo-HSCT was 345 days (range, 3-5479). In survival analyses, breakpoints at 2q (hazard ratio [HR], 1.63; 95% confidence interval [CI], 1.12-2.38; P = .012) and 5q (HR, 2.18; 95% CI, 1.25-3.80; P = .006) negatively and significantly contributed to OS according to multivariate analyses (Table 2). Because these 2 abnormalities did not correlate with each other, as shown by the χ2 test (P = .726), they were determined to be independent negative predictors of OS (Table 2; Figure 2). The details of the structural breakpoints at 2q in all 42 patients are as follows: 5 patients with del(2)(q?), 3 with del(2)(q31-33), 7 with add(2)(q11-13), 8 with add(2)(q21), 14 with add(2)(q31-37), 2 with ins(2;?)(q31;?), and 1 each with ins(2;?)(q33;?), inv(2)(p13q33), and der(2)add(2)(p13)add(2)(q33). Moreover, the 18 patients with structural breakpoints at 5q comprised 7 with del(5)(q?), 1 with del(5)(q31q32), 1 with del(5)(q13q33), 3 with add(5)(q13-15), 2 with add(5)(q31-33), 1 with add(5)(q22), 1 with t(5;14)(q31;q32), and 1 with t(5;14)(q13;q32) (supplemental Table 1; see Figure 5). All patients with structural breakpoints at 2q and 5q had a complex karyotype.
Multivariate analysis on OS, ATL-related death, and TRM in each chromosomal abnormality
| OS | ATL-related death | TRM | ||||||||
|---|---|---|---|---|---|---|---|---|---|---|
| Chromosomal abnormalities | n | HR | 95% CI | P | HR | 95% CI | P | HR | 95% CI | P |
| Numerical abnormalities | ||||||||||
| Loss | ||||||||||
| Chromosome 14 | 44 | — | — | NS | 2.01 | 1.229-3.303 | .006 | — | — | NS |
| Structural breakpoints | ||||||||||
| p-Arm | ||||||||||
| 3 | 29 | — | — | NS | 2.09 | 1.207-3.630 | .009 | — | — | NS |
| q-Arm | NS | |||||||||
| 1 | 50 | — | — | NS | 1.9 | 1.103-3.280 | .021 | — | — | NS |
| 2 | 42 | 1.63 | 1.115-2.375 | .012 | 1.72 | 1.046-2.816 | .033 | — | — | NS |
| 3 | 50 | — | — | NS | 1.73 | 1.057-2.842 | .029 | — | — | NS |
| 5 | 18 | 2.18 | 1.253-3.796 | .006 | 2.98 | 1.685-5.265 | <.001 | — | — | NS |
| 6 | 58 | — | — | NS | 1.88 | 1.148-3.063 | .012 | — | — | NS |
| 15 | 16 | — | — | NS | 2.33 | 1.139-4.762 | .021 | — | — | NS |
Clinical variables using multivariate analysis of each of the chromosomal abnormalities were age, sex, ATL disease type, disease status, and level of soluble IL2 receptor. P values of significant factors extracted by the Holm method are in bold.
p-arm, short arm of the chromosome; q-arm, long arm of the chromosome; NS, no statistically significant difference.
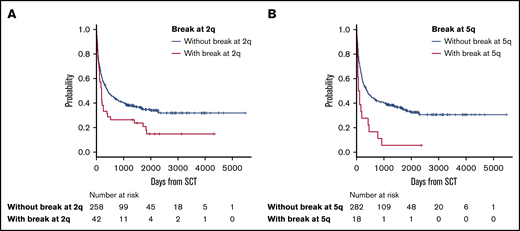
OS in patients with ATL with or without structural breakpoints at 2q and 5q. (A) OS in patients with ATL with structural breakpoints at 2q. Patients with a structural breakpoint at 2q had a significantly worse outcome than those without it (P = .014). (B) OS in patients with ATL with a structural breakpoint at 5q. Patients with a structural breakpoint at 5q had a significantly worse outcome than those without it (P < .001).
OS in patients with ATL with or without structural breakpoints at 2q and 5q. (A) OS in patients with ATL with structural breakpoints at 2q. Patients with a structural breakpoint at 2q had a significantly worse outcome than those without it (P = .014). (B) OS in patients with ATL with a structural breakpoint at 5q. Patients with a structural breakpoint at 5q had a significantly worse outcome than those without it (P < .001).
Multivariate analysis showed negative predictive factors for ATL-related death to be loss of chromosome 14 (HR, 2.01; 95% CI, 1.23-3.30; P = .006) and breakpoints at 3p (HR, 2.09; 95% CI, 1.21-3.63; P = .009), 1q (HR, 1.90; 95% CI, 1.10-3.28; P = .021), 2q (HR, 1.72; 95% CI, 1.05-2.82; P = .033), 3q (HR, 1.73; 95% CI, 1.06-2.84; P = .029), 5q (HR, 2.98; 95% CI, 1.690-5.27; P < .001), 6q (HR. 1.88; 95% CI, 1.15-3.06; P = .012), and 15q (HR, 2.33, 95% CI, 1.14-4.76; P = .021) (Table 2; Figure 3). Chromosomal abnormalities with loss of chromosome 14 and structural breakpoints at 3p, 1q, 5q, and 6q were extracted by Holm’s method. After using the χ2 test to determine the presence or absence of correlations between the 3p and 6q breakpoints, the 3p breakpoint and monosomy 14, the 1q and 6q breakpoints, and the 1q breakpoint and monosomy 14 (supplemental Table 2), we performed a cumulative-incidence analysis of ATL-related death. The incidence of ATL-related death in patients with each abnormality was similarly higher than in patients without the abnormality, except in patients who had monosomy 14 with or without a breakpoint at 1q, but even those patients did not show a statistically significant difference in ATL-related death (supplemental Figure 2). Therefore, we extracted these 4 abnormalities as independent predictive factors for ATL-related death. Eventually, we extracted the following abnormalities as significant negative predictive factors: monosomy 14, and structural breakpoints at 3p, 1q, 5q, and 6q (Table 2).
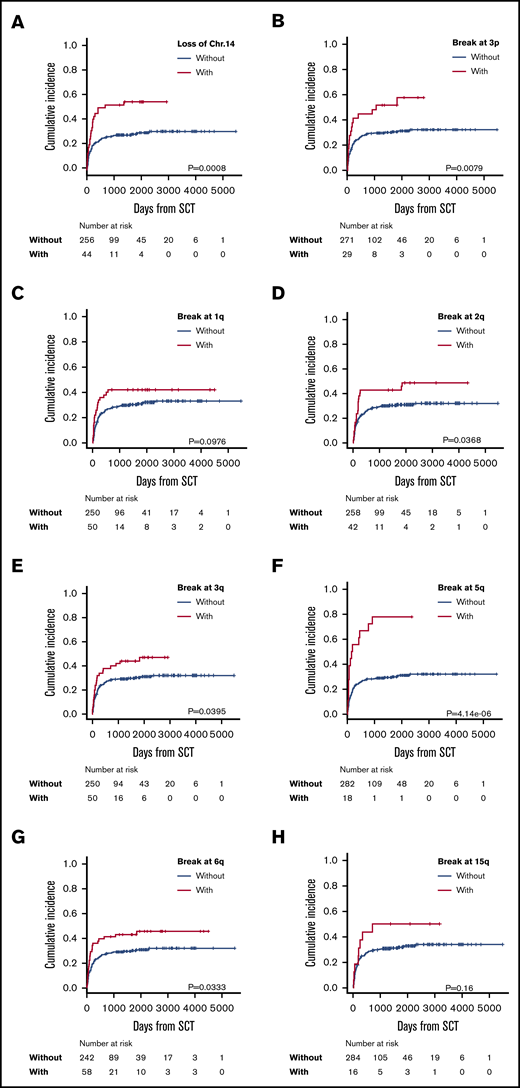
Incidence of ATL-related death in patients with each significantly adverse karyotype. Incidence of ATL-related death in patients with or without loss of chromosome 14 (A) and with or without breakpoints at 3p3p (B); 1q (C); 2q (D); 3q (E); 5q (F); 6q (G); and 15q (H).
Incidence of ATL-related death in patients with each significantly adverse karyotype. Incidence of ATL-related death in patients with or without loss of chromosome 14 (A) and with or without breakpoints at 3p3p (B); 1q (C); 2q (D); 3q (E); 5q (F); 6q (G); and 15q (H).
Survival analysis in patients with complex or normal karyotypes and number of clonal evolutions from stemline karyotypes
Complex karyotypes were analyzed separately from each chromosomal abnormality. Kaplan-Meier survival analysis of OS revealed that complex karyotypes had a negative impact, but the difference was not statistically significant. Complex karyotypes did not demonstrate any negative impact on OS in multivariate analysis (Figure 4A; Table 3; supplemental Table 4). In terms of ATL-related death, complex karyotypes had a negative impact according to both Gray’s test and multivariate analysis (Figure 4B; Table 3; supplemental Table 4). Normal karyotypes did not have any significant impact on survival (Figure 4C-D). Among 204 patients who had abnormal karyotypes, the OS of the 50 patients categorized as having a high number of clonal evolutions from stemline karyotypes was significantly higher than that of the 154 patients with a low number of clonal evolutions. Moreover, ATL-related death was significantly higher in patients with a high number of clonal evolutions (Figure 4E-F).
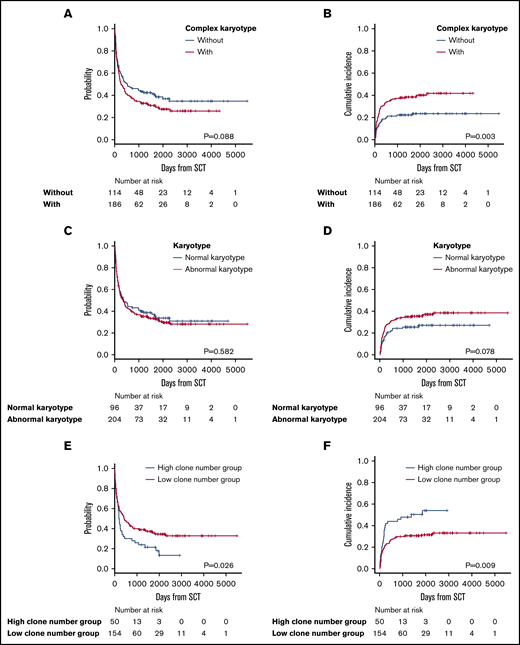
Survival outcomes in patients with complex karyotypes, normal karyotypes, and a high or low number of clonal evolutions. (A) OS in patients with or without complex karyotypes. (B) Incidence of ATL-related death in patients with or without complex karyotypes. (C) OS in patients with normal vs abnormal karyotypes. (D) Incidence of ATL-related death in patients with normal vs abnormal karyotypes. (E) OS in patients with a high vs low number of clonal evolutions. (F) Incidence of ATL-related death in patients with a high vs low number of clonal evolutions.
Survival outcomes in patients with complex karyotypes, normal karyotypes, and a high or low number of clonal evolutions. (A) OS in patients with or without complex karyotypes. (B) Incidence of ATL-related death in patients with or without complex karyotypes. (C) OS in patients with normal vs abnormal karyotypes. (D) Incidence of ATL-related death in patients with normal vs abnormal karyotypes. (E) OS in patients with a high vs low number of clonal evolutions. (F) Incidence of ATL-related death in patients with a high vs low number of clonal evolutions.
Regression analysis of survival outcomes in patients with or without complex karyotype
| Univariate analysis | Multivariate analysis | ||||||
|---|---|---|---|---|---|---|---|
| Variable | n | HR | 95% CI | P | HR | 95% CI | P |
| OS | |||||||
| Complex karyotype | |||||||
| Without | 114 | 1 | .089 | — | — | ||
| With | 186 | 1.29 | 0.9626-1.718 | — | — | ||
| Age | |||||||
| ≥55 y | 162 | 1 | .226 | 1 | .025 | ||
| <55 y | 138 | 0.84 | 0.639-1.112 | 0.65 | 0.441-0.948 | ||
| Sex | |||||||
| Female | 130 | 1 | .98 | — | — | ||
| Male | 170 | 1 | 0.760-1.325 | — | — | ||
| Disease type | |||||||
| Acute | 183 | 1 | .017 | 1 | .004 | ||
| Nonacute | 117 | 1.4 | 1.062-1.853 | 1.57 | 1.158-2.119 | ||
| Conditioning regimen | |||||||
| MAC | 118 | 1 | .359 | 1 | .049 | ||
| RIC | 182 | 0.88 | 0.663-1.16 | .681 | 0.464-0.999 | ||
| Disease status at HSCT | |||||||
| CR | 110 | 1 | <.001 | 1 | <.001 | ||
| Non-CR | 190 | 1.82 | 1.347-2.452 | 1.93 | 1.405-2.662 | ||
| sIL2R level at diagnosis | |||||||
| sIL2R ≥20 000 | 144 | 1 | .963 | — | — | ||
| sIL2R <20 000 | 121 | 0.99 | 0.740-1.333 | — | — | ||
| ATL-related death | |||||||
| Complex karyotype | |||||||
| Without | 114 | 1 | .004 | 1 | <.001 | ||
| With | 186 | 1.93 | 1.237-3.017 | 2.38 | 1.440-3.915 | ||
| Age | |||||||
| ≥55 y | 162 | 1 | .13 | — | — | ||
| <55 y | 138 | 0.74 | 0.494-1.095 | — | — | ||
| Sex | |||||||
| Female | 130 | 1 | .38 | — | — | ||
| Male | 170 | 1.2 | 0.803-1.778 | — | — | ||
| Disease type | |||||||
| Acute | 183 | 1 | .64 | — | — | ||
| Nonacute | 117 | 0.91 | 0.606-1.363 | — | — | ||
| Conditioning regimen | |||||||
| MAC | 118 | 1 | .12 | — | — | ||
| RIC | 182 | 1.39 | 0.92-2.11 | — | — | ||
| Disease status at HSCT | |||||||
| CR | 110 | 1 | <.001 | 1 | <.001 | ||
| Non-CR | 190 | 2.35 | 1.499-3.678 | 2.52 | 1.589-3.997 | ||
| sIL2R level at diagnosis | |||||||
| sIL2R ≥20 000 | 144 | 1 | .22 | — | — | ||
| sIL2R <20 000 | 121 | 1.29 | 0.858-1.952 | — | — | ||
| TRM | |||||||
| Complex karyotype | |||||||
| Without | 114 | 1 | .22 | — | — | ||
| With | 186 | 0.78 | 0.531-1.154 | — | — | ||
| Age | |||||||
| ≥55 y | 162 | 1 | .78 | — | — | ||
| <55 y | 138 | 1.06 | .719-1.553 | — | — | ||
| Sex | |||||||
| Female | 130 | 1 | .3 | — | — | ||
| Male | 170 | .82 | .557-1.200 | — | — | ||
| Disease type | |||||||
| Acute | 183 | 1 | .006 | 1 | .003 | ||
| Nonacute | 117 | 1.72 | 1.169-2.522 | 1.88 | 1.241-2.843 | ||
| Conditioning regimen | |||||||
| MAC | 118 | 1 | .01 | 1 | .017 | ||
| RIC | 182 | 0.6 | 0.410-0.885 | 0.6 | 0.395-0.912 | ||
| Disease status at HSCT | |||||||
| CR | 110 | 1 | .89 | — | — | ||
| Non-CR | 190 | 0.97 | 0.657-1.438 | — | — | ||
| sIL2R level at diagnosis | |||||||
| sIL2R ≥20 000 | 144 | 1 | .31 | — | — | ||
| sIL2R <20 000 | 121 | 0.8 | 0.529-1.222 | — | — | ||
Significant P values are in bold.
CR, complete response.
Discussion
Because ATL cells generally present with various complex karyotypes, we separately analyzed numerical and structural abnormalities, with a particular emphasis on structural breakpoints, as they are common in ATL cells. Regarding the specific types of structural abnormalities, patients with ATL in our series demonstrated a variety of common patterns, such as additional chromosome materials of unknown origin, chromosome deletions, and derivative chromosomes (supplemental Table 1).
The results of our study showed that chromosomal breakpoints at 2q and 5q had a significantly negative impact on OS in allo-HSCT recipients with ATL. Only 1 small study has reported the impact of chromosomal abnormalities on the survival of patients with ATL with chemotherapy.14 That study showed that shorter survival correlated with the following: multiple breakpoints (≥6); abnormalities in chromosome 1p, 1p22, 1q, 1q10-21, 2q, 3q, 3q10-12, 3q21, 14q, 14q32, and 17q; and partial loss of chromosomes 2q, 9q, 14p, 14q, and 17q. These poor prognostic factors differed from those identified in our series, except for the breakpoints at 2q. We speculate that this discrepancy was attributable to different sample sizes and patient characteristics. Because allo-HSCT itself has an impact on OS, the survival time of patients in our series was much longer than that in the previous study. Moreover, the results of our study could be related to graft-versus-ATL after allo-HSCT.
CD28, CTLA4, and PDCD1 on chromosome 2q and CSNK1A1 on chromosome 5q were recognized as candidate oncogenes or suppressor oncogenes in ATL (Figure 5). Kataoka et al showed that CTLA4-CD28 and ICOS-CD28 fusions were frequently detected in patients with ATL.18 Moreover, another study showed that loss of CD28 was related to escape from alloimmunity.19 Rapid progression of ATL after the use of the PD-1 inhibitor was recently reported; therefore, care should be taken when administering these immune checkpoint inhibitors.20
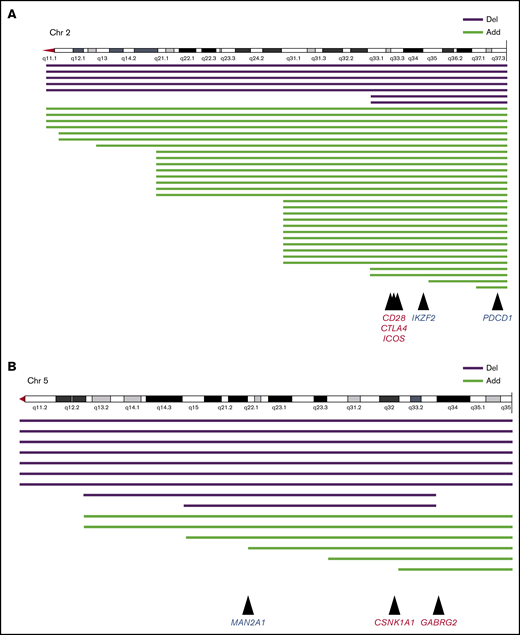
Structural breakpoints at 2q and 5q, and candidate genomes in ATL. Structural breakpoints with chromosome deletions and additional chromosome material of unknown origin. (A) Chromosome 2. Mutations in CD28, CTLA4, and ICOS frequently caused fusion, and mutations in PDCD1 frequently caused deletion. (B) Chromosome 5. Mutations in CSNK1A1 and GABRG2 frequently caused fusion, and mutations in MAN2A1 frequently caused deletion.
Structural breakpoints at 2q and 5q, and candidate genomes in ATL. Structural breakpoints with chromosome deletions and additional chromosome material of unknown origin. (A) Chromosome 2. Mutations in CD28, CTLA4, and ICOS frequently caused fusion, and mutations in PDCD1 frequently caused deletion. (B) Chromosome 5. Mutations in CSNK1A1 and GABRG2 frequently caused fusion, and mutations in MAN2A1 frequently caused deletion.
Structural abnormalities in 5q were another significant risk factor for poor prognosis in patients with ATL who received allo-HSCT. It was shown that cerebron and ubiquitinated casein kinase 1A1 (CSNK1A1), which maps to 5q32, promoted apoptosis of 5q− cells in patients with myelodysplastic syndrome.21 Kataoka et al discovered frequent mutations of CSNK1A1 in ATL cells.19 In our series, chromosomal deletion and chromosomal material of unknown origin in 5q seemed to have monoallelic variation (Figure 5B; supplemental Table 1). However, there are no reports about the survival impact of CSNK1A1 mutations in patients with ATL. Recently, an immunomodulatory drug, lenalidomide, was approved for ATL in Japan and other countries.22 Preemptive or preventive therapy with lenalidomide after allo-HSCT should improve the survival of patients with del(5)(q), although no studies have examined this possibility thus far. A recent report indicated that other genes frequently observed in 5q were MAN2A1 and GABRG2.18 Nevertheless, it remains unclear how these genes relate to survival outcomes in patients with ATL.
Loss of chromosome 14 and breakpoints at 3p, 1q, 5q, and 6q were extracted as significant factors associated with ATL-related death after allo-HSCT, but the mechanisms remain unclear. Future research on the relationship between genomic mutations and allogeneic immunity should provide clarification.
Multivariate analysis showed that, although complex karyotypes did not affect OS, they negatively contributed to ATL-related death. Furthermore, the finding that all patients who had structural breakpoints at 2q and 5q had a complex karyotype suggests that these karyotypes negatively contribute to survival results after allo-HSCT in patients with ATL.
A previous report showed that ATL cells normally had abnormal karyotypes.13 In our study, however, there were 96 patients with ATL whose ATL cells did not have detectable chromosomal abnormalities. We assessed the correlation between normal karyotypes and clinical outcome in patients with ATL who received allo-HSCT. In our series, there was no statistically significant association between OS and ATL-related death. This study included BM samples but strictly excluded those in which the secondary survey demonstrated no BM invasion. Nevertheless, we cannot completely rule out the possibility that we included abnormal karyotypes from other diseases such as myelodysplastic syndrome. This possibility is one limitation of our study.
In terms of survival outcomes associated with the number of clonal evolutions from stemline karyotypes, a high number of clonal evolutions negatively contributed to OS and ATL-related death. As 1 band represents 5 × 10⁶ to 10 × 106 base pairs of DNA, and could thus potentially contain numerous genes, cytogenetic analysis is not considered to be a high-resolution technique.
In this study, because we focused on the timing of the chromosome test, we assessed the type of ATL disease at the time of diagnosis. Accordingly, 41 of the 47 patients with smoldering and chronic ATL, which are considered indolent types, had transitioned to the aggressive type at the time of transplantation, and most of those patients had transitioned to the acute type. It is certainly possible that patients who transition from the nonacute to the acute form of the disease have a poor prognosis.
This study had several limitations unrelated to the issue of normal karyotypes in BM samples discussed herein. We could not clearly identify genetic mutations in this series, and thus it was not possible to identify potential relationships between candidate genes and chromosomes. In addition, we did not determine why the chromosomal risk factors for OS and ATL-related death differed in this cohort. Because this retrospective study was based on nationwide registry data, it is possible that we did not strictly exclude nonrelapse mortality from ATL-related death in patients who relapsed after HSCT. Moreover, there were 43 patients whose cytogenetic information was derived from testing performed after the start of chemotherapy. The majority of these patients (39 of 43) were tested for chromosomes that were not evaluated at the time of diagnosis, but rather at the time of disease transition after diagnosis. The significance of chromosome aberrations in ATL is not yet clear, which may partly be because chromosome testing at the time of diagnosis was uncommon in Japan, especially in indolent types of ATL.
In summary, to our knowledge, this is the first large-scale study to reveal the survival impact of chromosomal abnormalities in patients with ATL receiving allo-HSCT. The results demonstrate that structural breakpoints at 2q and 5q are independent risk factors for poor OS, and loss of chromosome 14 and structural breakpoints at 3p, 1q, 5q, and 6q are significant factors associated with ATL-related death.
Original data are available by e-mail request to the corresponding author (Nobuaki Nakano; nobunobuprince@yahoo.co.jp).
Acknowledgments
The authors thank all the physicians and data managers at the 92 Japanese institutions that provided valuable data on transplantation for adult T-cell leukemia/lymphoma (ATL) at the Japan Society for Hematopoietic Cell Transplantation (JSHCT), all the members of the JSHCT ATL working group, and the data management committees of the JSHCT.
This work was supported, in part, by Practical Research Programs of the Japan Agency for Medical Research and Development (AMED) (grants JP19ck0106342h0003 [T.F., A.U., S.F., A.I.] and JP19ek0510023h0002 [Y.A., T.I.]).
Authorship
Contribution: N.N., A.U., H.F., S.F., T.F., T.I., Y.T., N.Y., M.S., K.O., and K.K. designed the research, organized the project, and wrote the manuscript; N.N., K. Matsuo, and Y.A. performed the statistical analyses; A.I., K.I., H.N., N.N., T.F., T.M., K. Miyashita, S.O., Y.M., Y.S., and M.Y. collected the data; N.N., A.U., H.F., S.F., Y.T., N.Y., M.S., K.O., and K.K. wrote the draft of the manuscript; and all the authors contributed to the final version.
Conflict of interest statement: The authors declare no competing financial interests.
Correspondence: Nobuaki Nakano, 11-23 Kamoikeshinmachi, Kagoshima 890-0064, Japan; e-mail: nobunobuprince@yahoo.co.jp.

