

Key Points
Increasing fibrinogen γ′ in patient plasmas accelerates clot formation and increases fibrin clot size at arterial and venous shear rates.
Flow rate–specific modulation of clot formation by fibrinogen γ' provides a new mechanism to explain its association with thrombosis.

Abstract
Fibrinogen γ' accounts for 3% to 40% of plasma fibrinogen. Earlier studies indicated that fibrinogen γ' forms altered fibrin clots under static conditions, whereas clinically, altered plasma γ' levels are associated with arterial and venous thrombosis. However, the effects of static vs flow conditions on the role of γ′ throughout the pathophysiological range is unknown. This study explores the effects of γ' levels on clot formation and structure in static and flow conditions. Coagulation of plasma samples with low (n = 41; 3%), normal (n = 45; 10%), or high (n = 33; 30%) γ′ levels were compared with that of purified fibrinogen mixtures with increasing ratios of γ′ (3%, 10%, 30%). Clots were analyzed by confocal microscopy, permeation, turbidity, and lysis techniques. In a novel 2-step flow-perfusion model, fibrinogen-deficient plasma repleted with increasing ratios of γ′ (3%, 10%, 30%) or plasmas with low (n = 5, 3%) or high (n = 5, 30%) γ′ were flowed over preformed platelet aggregates at arterial (500 s−1) and venous (150 s−1) shear rates. Increasing γ′ percentages within the pathophysiological range (3%-30%) did not result in any change in clot-formation rates; however, it led to significantly higher clot density, thinner fibers, and slower lysis in static conditions. Under flow at arterial shear, high γ′ (30%) led to faster (+44.1%-75.3%) and increased (+104%-123%) fibrin deposition, with clots exhibiting a larger volume (+253%-655%) and height (+130%-146%). These trends were magnified at venous shear. Overall, our findings demonstrate the significant impact of pathophysiological fibrinogen γ′ levels on clot structure and provide new flow-dependent mechanisms to explain how γ′ increases thrombosis risk.
Introduction
Fibrinogen γ′ is a common splice variant in which 4 C-terminal residues of the fibrinogen γA-chain are replaced with a unique 20 amino acid sequence resulting in a bulky negatively charged extension in the D-region of fibrinogen.1 Because of the homodimeric structure of fibrinogen, splice variation results in 3 fibrinogen isoforms, γA/γA, γA/γ′, and γ′/γ′, with γA/γ′ making up, on average, 10% to 12% of total fibrinogen and γ′/γ′ contributing only 1%.2 Clinically, there is strong consensus that increased fibrinogen γ′ levels are associated with arterial thrombosis.3-5 However, the relationship between fibrinogen γ′ levels and venous thrombosis is less clear. Decreased γ′ levels have been found to associate with deep vein thrombosis and portal vein thrombosis,6,7 but increased levels were associated with pulmonary embolism.4 A large recent prospective longitudinal study that followed 16 234 participants over 20 years did not find any association between γ′ and venous thromboembolism.8 Although these studies do not always agree, they indicate a role for γ′, particularly in the pathophysiology of arterial thrombosis, that occurs in part through the modulation of coagulation and/or fibrin clot structure and function. Fibrinogen γ′ has been shown to modulate thrombin via high-affinity exosite II binding9 and was originally associated with thrombin inhibition.10 However, binding of thrombin to γ′ has also been shown to protect it against inhibition,11 with the activity of bound thrombin toward several substrates, including factor XIII (FXIII) and fibrinogen, remaining normal, thereby localizing thrombin activity to the growing fibrin clot.11-13
In purified systems, fibrinogen γ′ has been shown to influence clot architecture and breakdown, through increased clotting times, increased clot density,12,14 and slower fibrinolysis rates.15,16 However, the majority of these studies compared 100% γ′ with γA fibrinogen in clotting under static conditions. Few studies have been performed with γ′ and γA mixtures. Kim et al demonstrated that γ' levels > 20% delayed lysis in a static purified system.16 Three studies have explored the effects of γ' in plasma or whole blood. Walton et al demonstrated a greater increase in fibrin formation rates when γA/γA was spiked into normal pool plasma compared with γA/γ'.17 Using static turbidimetric assays, Pieters et al showed that increasing γ' reduced maximal absorbance and prolonged lysis times without altering clotting rates in a population of black South Africans.18 A recent study by Farrell et al demonstrated that increasing γ' to between 35.8 μg/mL and 204.6 μg/mL resulted in a lower international normalized ratio and increased clotting rates in whole-blood thromboelastography.19
With so many studies carried out in static systems, the effects of γ' under flow are still poorly understood. Only 1 study has addressed this by exploring the effects of complete inhibition of γ' under flow using an antibody20 ; however, a complete lack of γ' does not occur physiologically, and an antibody binding to the D-domain of fibrinogen is likely to interfere with normal fibrin polymerization.
In the present study, the role of γ′ in clot formation and breakdown was investigated through an extended range of pathophysiological levels. We demonstrate that γ′ results in prothrombotic changes in clot formation in static and flow conditions, with as little as 10% of total fibrinogen, and it imparts FXIII-dependent changes on clot structure. We also demonstrate that increasing γ′ under flow conditions results in faster-forming clots that have greater fibrin volume and height at different shear rates.
Methods
Blood and plasma collection
Plasma samples were taken from 1168 subjects (608 abdominal aortic aneurysm patients and 558 age- and sex-matched controls) as part of the Leeds Aneurysm Development Study (LEADS).21 Whole blood for flow experiments was obtained from 9 healthy volunteers as previously described.22 Further information on this study population and blood collection is available in supplemental Methods and supplemental Figure 1. Ethical approval for blood sampling was obtained from the University of Leeds Medical School (Ref: 03/142) and University of Maastricht Faculty of Medicine review board (Ref. NL31480.068.10). Written informed consent was received from each subject prior to inclusion in the study in accordance with the Declaration of Helsinki.
Fibrinogen levels and γA/γ′ and γA/γA purification
Fibrinogen and fibrinogen γ′ levels were measured using the Clauss method and enzyme-linked immunosorbent assay, respectively, in 1168 LEADS plasma samples. γA/γ′ and γA/γA fibrinogen were further purified from commercially available plasma-purified human fibrinogen (Enzyme Research Laboratory), as previously described.12,23,24 For full details see supplemental Methods and supplemental Figure 2.
Confocal microscopy and permeation
For laser scanning confocal microscopy, purified γA/γA and γA/γ′ fibrinogens were fluorescently labeled with Alexa Fluor 488 using protein-labeling kits (Thermo Fisher Scientific). For purified samples, γA/γA and γA/γ′ fibrinogens were combined to form 3%, 10%, or 30% γ′, with or without FXIII (3.7 μg/mL; prepared as previously described25 ). Final total fibrinogen concentration was 1 mg/mL. LEADS plasma samples were diluted 1:3 with Tris-buffered saline (50 mM Tris-base, 150 mM NaCl, pH 7.4). For repleted plasma samples, fibrinogen-deficient plasma was diluted 1:3 with Tris-buffered saline and repleted with increasing fibrinogen γ′ fractions of 3%, 10%, or 30% (total fibrinogen concentration = 1 mg/mL), with or without 1,3,4,5-tetramethyl-2-[(2-oxopropyl)thio]imidazolium chloride (1 mM). All samples were spiked with fluorescently labeled γA/γA and γA/γ′ at the correct ratio (final concentration 25 μg/mL). Clotting was initiated with 10 mM CaCl2 and 0.5 U/mL thrombin (final concentrations; Merck Millipore). For confocal microscopy, 30 μL of sample was immediately transferred to uncoated Ibidi slide channels (Thistle Scientific). Samples were clotted in a dark humidity chamber for 2 hours. Slides were imaged using an inverted Zeiss LSM880 microscope (Carl Zeiss) with a 40× oil-immersion objective. Fibrin clots were prepared in duplicate with 6 Z-stack images (20 μm, 30 slices) taken per clot to generate 3-dimensional projections (ZEN 2.1 black; Carl Zeiss). The number of fibers per 100 μm was calculated using ImageJ and an in-house macro.
Role of fibrinogen γ′ in clot formation and breakdown
Clot formation and breakdown were analyzed by turbidity and lysis assays, as previously described.21 For full details see supplemental Methods.
Effects of fibrinogen γ′ under flow
The effects of fibrinogen γ′ under flow were explored using a novel 2-step flow perfusion model based around the well-established Maastricht flow chamber.28,29 Fibrinogen-deficient plasma repleted with increasing ratios of γ′ (3%, 10%, 30%) or LEADS plasma with low (n = 5, 3%) and high (n = 5, 30%) γ′ were flowed over preformed platelet aggregates at arterial (500 s−1) and venous (150 s−1) shear rates. Complete details about this model are available in supplemental Methods.
Data analysis
Statistical tests were preformed and graphical representations were prepared using GraphPad Prism v8. Statistical significance was taken as P < .05. Data normality was tested using D’Agostino-Pearson tests. Parametric data are presented as mean ± standard deviation (SD), nonparametric data are shown as median and interquartile ranges, and categorical data are number of subjects (percentage of total). Differences between parametric data were analyzed using an unpaired Student t test or 1-way analysis of variance (ANOVA), followed by Tukey’s multiple-comparisons test. Differences between nonparametric data were assessed using a Mann-Whitney U test or Kruskal-Wallis test, followed by Dunn’s multiple-comparisons test. For categorical data, Pearson’s χ2 was used.
Results
Rising plasma γ' levels increase clot density and slow fibrinolysis in static conditions
Fibrinogen γ′ levels were measured in plasma samples from 1168 subjects from the LEADS study (median, 334.4 mg/L; range, 35.7-1262.0). Fibrinogen levels were measured in the same subjects (median, 3.57 g/L; range, 1.79-9.28), allowing for γ′ percentage to be calculated. Median γ′ percentage was 9.35% for the whole group, with individual values ranging from 0.81% to 39.5%, in agreement with previous reports.4,30-33 From this large cohort 3 groups of LEADS plasmas that represented low (1%-7%; ∼3%; n = 41), normal (9%-11%; ∼10%, n = 45), and high (22%-40%; ∼30%; n = 33) γ′ levels, all with fibrinogen levels of 3.3 g/L ± 0.6, were selected (supplemental Figure 3). The demographic characteristics of these groups are presented in supplemental Table 1. No significant differences (other than γ′ level and γ′ percentage) were found among the 3 groups.
Clot structures of the LEADS plasma groups were compared with clots produced with purified fibrinogens with the same γ′ ratios in the presence or absence of FXIII. Differences in clot structure were analyzed by confocal microscopy and permeation assays. As the percentage of γ′ increased, significant stepwise increases in clot density and decreases in clot porosity in purified experiments with FXIII and plasma experiments were seen (Figure 1; supplemental Table 2). Interestingly, no difference in clot density or porosity was found as the percentage of γ′ increased in purified experiments without FXIII or in fibrinogen-deficient plasma reconstituted with increasing concentrations (3%, 10%, 30%) of purified γ′ when FXIII was inhibited with 1,3,4,5-tetramethyl-2-[(2-oxopropyl)thio]imidazolium chloride (supplemental Figure 4; supplemental Table 2).
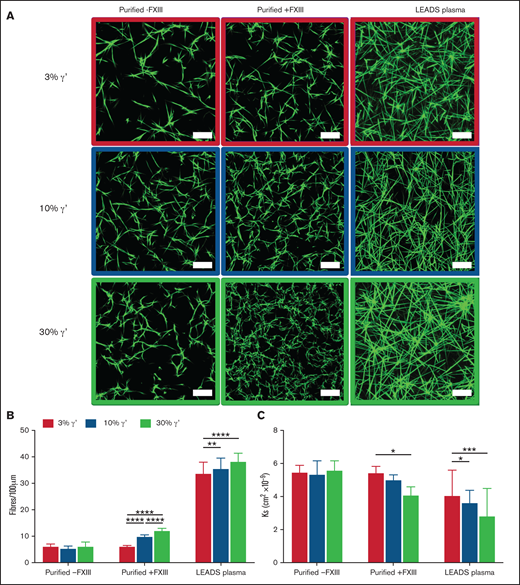
In static conditions, increasing fibrinogen γ′ levels within the (patho)physiological range increase clot density and reduce clot porosity. (A) Clots were formed under static conditions for purified experiments with 3%, 10%, and 30% fibrinogen γ′ in the presence (n = 3) or absence (n = 3) of FXIII. In parallel, clots were formed in patient samples (low γ′, n = 41; normal γ′, n = 45; high γ′, n = 33) with similar percentages of fibrinogen γ′. Clots were spiked with fluorescently labeled fibrinogen and viewed with a laser-scanning confocal microscope. Scale bar, 25 μm. (B) Clot density was quantified by calculating the number of fibers per 100 μm. (C) Permeation assays were carried out to calculate the porosity of clots. Data are mean ± SD. *P < .05, **P < .01, ***P < .001, ****P < .0001; 1-way ANOVA followed by Tukey’s multiple-comparisons test.
In static conditions, increasing fibrinogen γ′ levels within the (patho)physiological range increase clot density and reduce clot porosity. (A) Clots were formed under static conditions for purified experiments with 3%, 10%, and 30% fibrinogen γ′ in the presence (n = 3) or absence (n = 3) of FXIII. In parallel, clots were formed in patient samples (low γ′, n = 41; normal γ′, n = 45; high γ′, n = 33) with similar percentages of fibrinogen γ′. Clots were spiked with fluorescently labeled fibrinogen and viewed with a laser-scanning confocal microscope. Scale bar, 25 μm. (B) Clot density was quantified by calculating the number of fibers per 100 μm. (C) Permeation assays were carried out to calculate the porosity of clots. Data are mean ± SD. *P < .05, **P < .01, ***P < .001, ****P < .0001; 1-way ANOVA followed by Tukey’s multiple-comparisons test.
The effects of the extended pathophysiological γ′ range on clot formation and breakdown were investigated using turbidity and lysis assays. Maximum absorbance decreased in a stepwise manner with increasing percentages of γ′ in purified experiments, with or without FXIII, and in LEADS plasma samples, indicating the presence of thinner more highly branched fibers with higher γ′ (Figure 2A; supplemental Table 3) and extending findings from previous studies.12,15,18 Stepwise increases in lag time and decreases in maximum clotting rate and average clotting rate were also seen as the percentage of γ′ increased in purified experiments, with or without FXIII (Figure 2B). However, there was no decrease in clotting rates in LEADS plasma samples (Figure 2B), indicating that γ′ does not slow fibrin polymerization in a plasma system. Time to 50% lysis increased and the maximum and average lysis rates decreased (Figure 2C-D; supplemental Table 4) in purified experiments with FXIII and LEADS plasma experiments with as little as a 10% increase in γ′, adding to previous findings.15,16,18,34
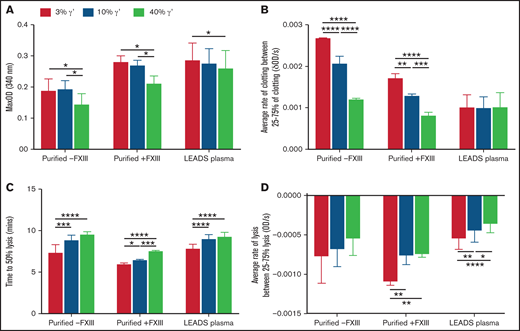
Increasing fibrinogen γ′ levels within the (patho)physiological range decrease fiber thickness and prolong lysis in static conditions. The effects of the percentage of fibrinogen γ′ on clot formation and breakdown were assessed in purified experiments in the presence (n = 3) or absence of FXIII (n = 3), as well as in patient plasma samples (low γ′, n = 41; normal γ′, n = 45; high γ′, n = 33) using turbidity and lysis assays. (A) Maximum optical density. (B) Average rate of clot formation. (C) Time to 50% lysis. (D) Average rate of clot lysis. Data are mean ± SD. *P < .05, **P < 01, ***P < .001, ****P < .0001, 1-way ANOVA followed by Tukey’s multiple-comparisons test.
Increasing fibrinogen γ′ levels within the (patho)physiological range decrease fiber thickness and prolong lysis in static conditions. The effects of the percentage of fibrinogen γ′ on clot formation and breakdown were assessed in purified experiments in the presence (n = 3) or absence of FXIII (n = 3), as well as in patient plasma samples (low γ′, n = 41; normal γ′, n = 45; high γ′, n = 33) using turbidity and lysis assays. (A) Maximum optical density. (B) Average rate of clot formation. (C) Time to 50% lysis. (D) Average rate of clot lysis. Data are mean ± SD. *P < .05, **P < 01, ***P < .001, ****P < .0001, 1-way ANOVA followed by Tukey’s multiple-comparisons test.
Together, these results show that increases in the percentage of γ′ throughout the pathophysiological range change clot structure, forming clots with thinner highly branched fibers that break down more slowly. However, in plasma, changes in the percentage of γ′ did not have any effect on clot formation rates, and effects of γ′ on clot structure were FXIII dependent.
Fibrinogen γ′ accelerates clot formation and increases fibrin clot size under flow
Most research into the effects of γ′ on clot structure has been done in static conditions. Only 1 in vitro study has explored inhibition of γ′ with an antibody under flow conditions,20 and there have been 3 in vivo studies: 1 primate model and 2 murine models.17,35 Because of links between γ′ levels and venous and arterial thrombosis, detailed investigations of its effects on clotting under flow conditions could help to explain these links.
The effect of shear on clot formation with γA/γA and γA/γ′ fibrinogen was investigated using a 2-step microfluidic model. Initially, platelet thrombi were formed on a tissue factor and collagen microspot. Recalcified fibrinogen-deficient plasma repleted with increasing concentrations (3%, 10%, 30%) of purified γ′ was spiked with fluorescent fibrinogen and perfused over the preformed thrombi at arterial (500 s−1) or venous (150 s−1) shear rates. In parallel, 5 LEADS plasma samples with high γ′ and 5 with low γ′ (Demographics: supplemental Table 5) were perfused over preformed thrombi using the same conditions. Fibrin formation originating from the platelet thrombi was followed by time series confocal imaging and quantified by fluorescence (Figure 3A,E,I,M; supplemental Video).
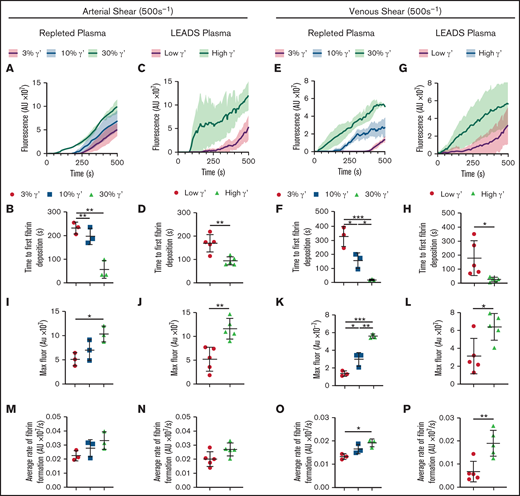
Under flow, increasing fibrinogen γ′ levels within the (patho)physiological range increase platelet-dependent fibrin deposition at arterial and venous shear. Fibrinogen-deficient plasma repleted with increasing fibrinogen γ′ (3%, 10%, 30%) or selected LEADS plasma samples with high (n = 5, 30%) or low (n = 5, 3%) γ′ were flowed over preformed platelet aggregates at arterial (500 s−1) and venous (150 s−1) shear rates, and fibrin accumulation was quantified by fluorescence over time. (A-D,I-J,M-N) Arterial shear. (E-H,K-L,O-P) Venous shear. (A-B,E-F,I,K,M,O) Repleted plasma. (C-D,G-H,J,L,N,P) LEADS plasma. (A,C,E,G) Fibrin formation originating from platelet thrombi over time, measured by the accumulation of fluorescent fibrinogen. (B,D,F,H) Time to first fibrin deposition around platelet thrombi. (I-L) Maximum fibrin formation measured by maximum fluorescence. (M-P) Average rate of fibrin formation. Data are mean ± SD. *P < .05, **P < .01, ***P < .001, 1-way ANOVA followed by Tukey’s multiple-comparisons test (B,F,I,K,M,O); unpaired Student t test (D,H,J,L,N,P). AU, arbitrary unit; Fluor, fluorescence.
Under flow, increasing fibrinogen γ′ levels within the (patho)physiological range increase platelet-dependent fibrin deposition at arterial and venous shear. Fibrinogen-deficient plasma repleted with increasing fibrinogen γ′ (3%, 10%, 30%) or selected LEADS plasma samples with high (n = 5, 30%) or low (n = 5, 3%) γ′ were flowed over preformed platelet aggregates at arterial (500 s−1) and venous (150 s−1) shear rates, and fibrin accumulation was quantified by fluorescence over time. (A-D,I-J,M-N) Arterial shear. (E-H,K-L,O-P) Venous shear. (A-B,E-F,I,K,M,O) Repleted plasma. (C-D,G-H,J,L,N,P) LEADS plasma. (A,C,E,G) Fibrin formation originating from platelet thrombi over time, measured by the accumulation of fluorescent fibrinogen. (B,D,F,H) Time to first fibrin deposition around platelet thrombi. (I-L) Maximum fibrin formation measured by maximum fluorescence. (M-P) Average rate of fibrin formation. Data are mean ± SD. *P < .05, **P < .01, ***P < .001, 1-way ANOVA followed by Tukey’s multiple-comparisons test (B,F,I,K,M,O); unpaired Student t test (D,H,J,L,N,P). AU, arbitrary unit; Fluor, fluorescence.
At arterial shear in repleted plasma, time to first fibrin deposition was found to decrease with increasing concentrations of γ′ (Figure 3A-B; supplemental Table 6). A similar trend was seen in LEADS plasma samples, with shorter times to first fibrin deposition in samples with high γ′ levels (Figure 3C-D). The same pattern was seen at venous shear with higher γ′ resulting in decreased times to first fibrin deposition in repleted and LEADS plasma samples (Figure 3E-H; supplemental Table 6). Maximum fibrin deposition at arterial shear was greater with increased percentages of γ′ in repleted and LEADS plasma samples (Figure 3I-J; supplemental Table 6). This tendency was also seen at venous shear in repleted and LEADS plasma samples (Figure 3K-L). The average rate of fibrin deposition at arterial shear was faster with increased γ′ in repleted and LEADS plasma samples (Figure 3M-N; supplemental Table 6), but these differences failed to reach significance. At venous shear, the average rate of fibrin deposition increased significantly as the percentage of γ′ increased in repleted and LEADS plasma samples (Figure 3O-P). Jointly, these data indicate that, at arterial and venous shear rates, γ′ fibrinogen leads to faster and greater platelet thrombus-driven fibrin formation.
End point Z-stack images were taken at 5 locations around each microspot to assess differences in clot structure. Depth-coded images revealed clear differences between clots as the percentage of γ′ increased. With repleted plasma at arterial shear, as γ′ levels increased, clots appeared taller with a more cloudlike appearance (Figure 4A-B). Quantitative analysis of these images revealed additional morphologic differences, with volume and height changing as a function of the percentage of γ′. As the percentage of γ′ increased, the fibrin clot volume and height increased in a stepwise manner (Figure 4C-D; supplemental Table 7). When the volume of fibrin in each optical slice was plotted against the distance from the slide surface, differences in height and volume between γ′ levels were clear. In addition, clots were compact with a large area of fibrin in contact with the slide surface, which increased as the percentage of γ′ rose (Figure 4E; supplemental Table 8).
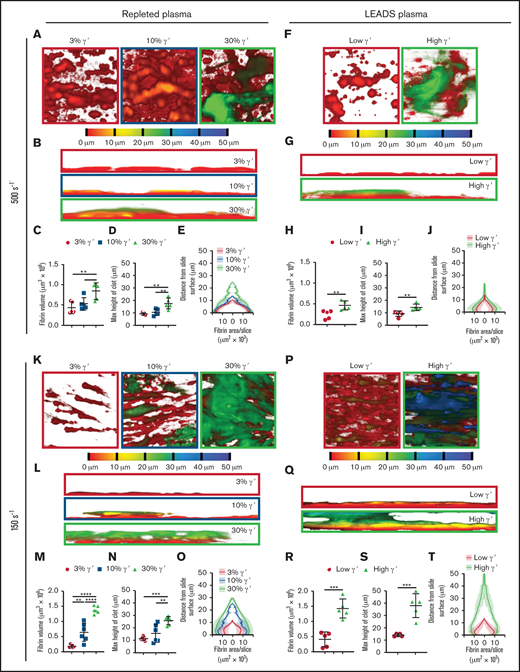
At arterial and venous shear, platelet-dependent fibrin clot size increases as fibrinogen γ′ levels increase within the (patho)physiological range. Following kinetics experiments assessing fibrin deposition, 5 end point images were taken at different locations around the microspot. (A-J) Clots formed under arterial shear (500s−1) and K-T venous shear (150s−1). (A-E,K-O) Experiments carried out using repleted plasma. (F-J,P-T) Experiments carried out using LEADS plasma samples.(A,F,K,P) Representative images of depth-coded z-stack images from above. Images are 213 × 213 μm. (B,G,L,Q) Representative images of depth-coded z-stack images from the side. Images 50 × 213 μm. (C,H,M,R) Total fibrin volume of end point clots. (D,I,N,S) Maximum height of end point clots. (E,J,O,T) Distribution of fibrin represented by area of fibrin per slice vs distance from the clotting surface. Data are mean ± SD. *P < .05, **P < .01, ***P < .001, ****P < .0001, 1-way ANOVA, followed by Tukey’s multiple-comparisons test (C-D,M-N); unpaired Student t test (H-I,R-S).
At arterial and venous shear, platelet-dependent fibrin clot size increases as fibrinogen γ′ levels increase within the (patho)physiological range. Following kinetics experiments assessing fibrin deposition, 5 end point images were taken at different locations around the microspot. (A-J) Clots formed under arterial shear (500s−1) and K-T venous shear (150s−1). (A-E,K-O) Experiments carried out using repleted plasma. (F-J,P-T) Experiments carried out using LEADS plasma samples.(A,F,K,P) Representative images of depth-coded z-stack images from above. Images are 213 × 213 μm. (B,G,L,Q) Representative images of depth-coded z-stack images from the side. Images 50 × 213 μm. (C,H,M,R) Total fibrin volume of end point clots. (D,I,N,S) Maximum height of end point clots. (E,J,O,T) Distribution of fibrin represented by area of fibrin per slice vs distance from the clotting surface. Data are mean ± SD. *P < .05, **P < .01, ***P < .001, ****P < .0001, 1-way ANOVA, followed by Tukey’s multiple-comparisons test (C-D,M-N); unpaired Student t test (H-I,R-S).
Similar findings with regard to clot formation, volume, height, and distribution were made when comparing low and high γ′ LEADS plasma groups (Figure 4F-J; supplemental Table 8). Furthermore, and interestingly, under venous shear rates, we again observed similar findings with regard to the effects of γ′ on clot formation, volume, height, and distribution for repleted and LEADS plasma samples (Figure 4K-T; supplemental Table 8). If anything, these differences were slightly more accentuated than under arterial shear rate conditions. Altogether, these data clearly point to a prothrombotic role for fibrinogen γ′ under flow conditions, regardless of shear.
Discussion
A plethora of studies have investigated the role of purified fibrinogen γ′ variants in static clotting, with the majority comparing 100% γA/γ′ or recombinant γ′/γ′ with 100% γA/γA fibrin. However, the effects of γ′ throughout the extended pathophysiological range and under flow were poorly understood. This study provides new insight into the effects of pathophysiological levels of fibrinogen γ′ on clot formation and structure under stasis and flow. In static conditions, increased γ′ levels increased clot density and slowed fibrinolysis but had no effect on clotting rates at physiological levels in plasma. Under flow conditions, increasing γ′ shortened lag times and increased the rate of platelet-driven fibrin deposition, especially at venous shear rate. Furthermore, higher γ′ led to clots with greater height and volume at both shear rates.
In static conditions, increasing the percentage of γ′ through the pathophysiological range led to concentration-dependent increases in clot density in purified and plasma systems. A similar trend was seen in permeation assays, in which higher γ′ led to decreased clot permeability. This expands on previous studies that demonstrated increased clot density with 100% γ′ in purified systems12,15 by highlighting the potency of γ′; it can induce concentration-dependent effects on clot structure in plasma while only making up a minor fraction of total fibrinogen. In addition, the present work shows that the changes in clot density and porosity are FXIII dependent in purified and plasma systems. In this study, elimination of FXIII from fibrinogen preparations was ensured through IF-1 fibrinogen purification, which was not the case in previous studies.12,14,15 Therefore, it is almost certain that previous studies were carried out in the presence of FXIII, because it is known to copurify with fibrinogen γ′ on anion-exchange chromatography.36 In agreement with this, Collet et al studied recombinant versions of fibrinogen γA/γA and γA/γ′ and did not find any changes in clot density.37 The FXIII-dependent changes may be explained by the ability of uncrosslinked fibrin clots to remodel without proteolytic digestion.38 Without FXIII, the extra negative charge of the fibrinogen γ′ extension may make D-E-D interactions involving 1 or 2 fibrinogen γ′ D-domains less favorable. Remodeling would allow modification of this D-E-D interaction to a more favorable γA-γA D-E-D interface. However, in the presence of activated FXIII, any γ′ D-E-D interface would be crosslinked in place. A previous study demonstrated that γ′ interferes with protofibril growth and has downstream effects on clot structure. The same study also showed that crosslinking by activated FXIII occurs to the same degree at γ′ and γA interfaces.14 The FXIII dependency of γ′-induced clot structure changes suggests a possible modulatory role for FXIII levels that may influence the prothrombotic nature of γ′, but further research is required test this hypothesis.
Maximum optical density decreased as the percentage of γ′ increased in purified and plasma experiments, which was indicative of the formation of thinner fibers, in agreement with previous data.12,15,18 However, we found previously described reductions in clotting rates12,14,16,39 with increasing γ′ in purified experiments but not in plasma. This suggests that, in static conditions, γ′ does not exhibit the antithrombotic effect of slowing clot formation in plasma; a possible explanation is that other plasma components mask or interfere with this effect of γ′ seen in purified systems. Increasing γ′ levels also led to a concentration-dependent prolongation of lysis times and a decrease in lysis rates. We showed that the previously described lysis resistance in γ′15,16,34 was potent enough to prolong lysis with as little as 10% of total fibrinogen in a plasma system. Interestingly, these γ′ effects on clot breakdown were not FXIII dependent, suggesting that prolongation of lysis was not due to changes in fibrin clot structure but more likely was due to the previously reported effects of γ′ on plasminogen activation.16
Our findings on the effects of fibrinogen γ′ levels on clot formation under flow provide new information on fibrin formation starting from preformed platelet aggregates, which reflects the physiological clotting response to injury and pathological response to plaque rupture. The speed and quantity of fibrin deposition increased with the percentage of γ′ at venous and arterial shear rates. This may be explained in part by evidence that thrombin binds to the γ′ extension via thrombin exosite II.9,11 It has been demonstrated that γ′-bound thrombin retains normal activity toward its substrates fibrinogen and FXIII11-13 and is protected against degradation primarily by α2-macroglobulin.40 Therefore, increasing levels of γ′ may localize greater thrombin activity to the site of fibrin formation, thus accelerating thrombus formation.
When end point clots were analyzed, clear differences in clot morphology between shear rates and the percentage of fibrinogen were revealed. Clots formed at arterial shear were shorter, with the largest cross-sectional area of fibrin close to the channel surface around the platelet thrombi. In comparison, clots formed at venous shear were much taller, with the largest cross-sectional area of fibrin found further away from the channel surface. This was expected because higher shear would reduce the growth of clots away from the surface. At both shear rates, increasing γ′ levels led to concentration-dependent increases in clot height and volume, with the greatest differences seen at venous shear in repleted and LEADS plasmas. Our data indicate that, under flow, increasing γ′ levels result in faster and greater fibrin formation. In contrast, under stasis we showed that γ′ had no effect on clotting rates in plasma, and previous studies have linked it to slower rates of clot formation.12,16,39 This suggests a flow rate–dependent role for fibrinogen γ′, whereby it has more procoagulant properties under flow.
Previous studies have linked arterial thrombosis with increased γ′ levels,3,30,41 but the relationship between fibrinogen γ′ levels and venous thrombosis is less clear, with venous thrombosis having been associated with decreased,6,7,42 increased,4 and no change in γ′ levels.8 This discrepancy raises interesting questions; it suggests that γ′ may have different effects on clotting in different conditions. In our study at arterial shear, clots formed at all percentages of γ′ were short, dense, and had a wider base, suggesting the formation of more stable clots. Furthermore, clots with a greater percentage of γ′ were significantly larger in volume and height. This suggests that previous associations between high γ′ levels and arterial thrombosis3,30,41 may be due, in part, to increasing γ′ levels resulting in faster-forming clots with increased size that are more likely to result in vessel occlusion and thrombosis. At venous shear, in a trend that was similar to arterial shear, clots with a higher percentage of γ′ formed more rapidly and had greater volume and height. Furthermore, these larger clots were made up of voluminous clouds of very thin fibrin fibers compared with the densely packed fibrous clots associated with smaller percentages of γ′. This appears to oppose studies that demonstrate a protective effect of γ′ in venous thrombosis.6,7 Instead, our findings suggest that, under venous shear rates, increased levels of γ′ present an increased risk for venous thromboembolism in a similar manner to arterial thrombosis. However, areas of stasis within the vasculature, which were most likely absent in our flow model, are believed to be a major contributor to venous thrombosis formation, especially deep vein thrombosis.43 Because a number of studies have demonstrated the antithrombotic effects of γ′ fibrinogen in static conditions,10,12,14 the opposing effects of γ′ in arterial vs venous thrombosis may not be due to differences in vascular flow rates; instead, they may result from differences in γ′ clot formation in static vs flow conditions.
Our study has some limitations that should be noted. First, our flow model may not reflect the full complexity of the vasculature (this includes endothelium, atherosclerosis, and denudation, as well as vessel shapes and sizes, pulsatile or irregular flow). Nevertheless, this helps to eliminate many sources of variability in the data. Second, our flow model consists of 2 separate stages, platelet aggregation followed by fibrin formation, whereas, in vivo, these stages happen in very quick succession with some overlap. However, this 2-step approach was needed to test and compare the small-volume plasma samples from patients; it also helped us to identify γ′-specific effects on secondary hemostasis. Finally, the average age of our study population from LEADS was high; however, thrombosis largely affects older segments of the population, and our results were reflected in purified and repleted plasma systems.
Further insight into the relationship between γ′ and thrombosis could be achieved with the use of arterial and venous thrombosis animal models; however, as with our flow model, they have limitations. Mice are the preferred animals for in vivo thrombosis models, but they do not possess the fibrinogen γ′ variant found in humans. Therefore, Walton et al infused mice with human γ′ fibrinogen17 and Mosesson et al developed a human γ′ transgenic mouse model35 to examine γ′ in arterial thrombosis. However, neither study found any link between γ′ and arterial thrombosis. This may have been due to all other proteins interacting with γ′ being murine and not human; from an evolutionary point of view, this may have prevented normal protein interactions that underpin functional effects. Furthermore, differences in shear rates in murine vessels may return different results compared with human pathophysiology.44 A third in vivo study by Lovely et al used an arteriovenous shunt baboon thrombosis model to explore the effects of γ′408-427 peptide infusion; they reported a reduction in fibrin-rich thrombus formation.45 However, this model did not recapitulate the process of endothelial denudation and subendothelial exposure associated with arterial thrombus formation, and it used a linear peptide, which is not always representative of the whole molecule of interest. Furthermore, that study included only 2 baboons, limiting the ability to make strong conclusions. New in vivo thrombosis models involving other species may help to fully uncover the mechanistic roles of γ′ in thrombosis.
Our data highlight the clinical relevance of fibrinogen γ′ on clot structure. For the first time, we show that fibrinogen γ' exerts different effects on fibrin clot structure in static vs flow conditions. In static conditions, increases in γ' levels from 3% to 30% in plasma do not result in any change in clot formation rates, but they do lead to the formation of significantly denser clots that are harder to break down. Under flow, as fibrinogen γ′ levels increase within the pathophysiological range, clotting rate and clot size also increase. Finally, in static and flow conditions, fibrinogen γ′ significantly influences fibrin clot structure with as little as 10% of total fibrinogen. Our findings of γ′-dependent escalation of fibrin deposition on platelet aggregates under different shear rates point to important prothrombotic effects of this ubiquitous fibrinogen splice variant under blood flow conditions.
Acknowledgments
R.A.S.A.’s laboratory is supported by grants from the British Heart Foundation (RG/18/11/34036) and the Wellcome Trust (204951/B/16/Z). F.L.M. is supported by a Sir Henry Wellcome Postdoctoral Fellowship (215861/Z/19/Z).
Authorship
Contribution: J.W.M.H. and R.A.S.A. conceived the project; F.L.M. and F.S. performed research; F.L.M. analyzed data; and F.L.M., F.S., J.W.M.H., and R.A.S.A. wrote the manuscript.
Conflict-of-interest disclosure: The authors declare no competing financial interests.
Correspondence: Robert A.S. Ariëns, LIGHT Laboratories, University of Leeds, Clarendon Way, Leeds LS2 9JT, United Kingdom; e-mail: r.a.s.ariens@leeds.ac.uk, Phone: +44 113 3437734.

