

Key Points
We report an important, nonredundant role for the chemokine CCL21 in controlling emigration of αβT cells from the neonatal thymus.
Medullary epithelium and mesenchyme function together to produce and capture CCL21 and focus its accumulation at sites of thymic exit.

Abstract
The release of newly selected αβT cells from the thymus is key in establishing a functional adaptive immune system. Emigration of the first cohorts of αβT cells produced during the neonatal period is of particular importance, because it initiates formation of the peripheral αβT-cell pool and provides immune protection early in life. Despite this, the cellular and molecular mechanisms of thymus emigration are poorly understood. We examined the involvement of diverse stromal subsets and individual chemokine ligands in this process. First, we demonstrated functional dichotomy in the requirement for CCR7 ligands and identified CCL21, but not CCL19, as an important regulator of neonatal thymus emigration. To explain this ligand-specific requirement, we examined sites of CCL21 production and action and found Ccl21 gene expression and CCL21 protein distribution occurred within anatomically distinct thymic areas. Although Ccl21 transcription was limited to subsets of medullary epithelium, CCL21 protein was captured by mesenchymal stroma consisting of integrin α7+ pericytes and CD34+ adventitial cells at sites of thymic exit. This chemokine compartmentalization involved the heparan sulfate–dependent presentation of CCL21 via its C-terminal extension, explaining the absence of a requirement for CCL19, which lacks this domain and failed to be captured by thymic stroma. Collectively, we identified an important role for CCL21 in neonatal thymus emigration, revealing the importance of this chemokine in initial formation of the peripheral immune system. Moreover, we identified an intrathymic mechanism involving cell-specific production and presentation of CCL21, which demonstrated a functional synergy between thymic epithelial and mesenchymal cells for αβT-cell emigration.
Introduction
Intrathymic development of conventional single-positive (SP) CD4+ and CD8+ αβT-cell receptor (αβTCR)–expressing αβT cells involves maturation events that occur within cortical and medullary microenvironments. Although this program ensures the generation of functionally competent self-tolerant thymocytes, additional postselection maturation events are required to establish T cell–mediated immunity.1-3 Of particular importance is thymus emigration, where mature T cells are released into peripheral tissues.4-7 The importance of this process is perhaps most evident during the neonatal period, where emigration of conventional SP thymocytes establishes the peripheral T-cell pool.8,9 Indeed, the essential requirement for neonatal thymus emigration is clear from long-standing observations in which disrupted formation of the peripheral T-cell pool via neonatal thymectomy results in systemic autoimmunity, caused by the early emigration of effector T cells and the delayed emigration of Foxp3+ regulatory T cells.10-12
Medulla-resident CD62L+CD69− SP thymocytes represent egress-competent cells,13,14 and evidence suggests the presence of a conveyor-belt process, which biases export toward the most mature cells.15 Also, SP thymocytes within perivascular spaces at the corticomedullary junction (CMJ) have identified potential sites of thymic exit.16 In terms of molecular regulation, the sphingosine-1-phosphate (S1P) receptor S1P1 controls late stages of thymus emigration, allowing mature SP thymocytes near thymic blood vessels to undergo reverse transendothelial migration and enter the circulation.17,18 Despite this, mechanisms controlling the trafficking of mature thymocytes through the medulla and toward sites associated with S1P-dependent emigration are poorly understood. This may be due to difficulties in directly attributing alterations in thymocyte populations to defects in thymus emigration. For example, increased SP thymocytes in neonatal Ccr7−/− and CCR7 ligand (CCR7L)–deficient plt/plt mice9,19 could be due to defective emigration, enhanced thymocyte proliferation,20 and/or failures in negative selection.21,22 As such, other than S1P1, the importance of thymocyte-expressed regulators of neonatal thymus emigration are unclear.
Here, we studied the requirement for CCR7Ls CCL19 and CCL21 in neonatal thymus emigration. From analysis of plt/pltRag2GFP mice, where green fluorescent protein (GFP) indicated cellular age and medullary dwell time,13,23,24 we showed CCR7/CCR7L controlled neonatal thymic exit. Furthermore, comparative analysis of Ccl19−/− and Ccl21a−/− neonates demonstrated an important requirement for CCL21, but not CCL19, in this process. Finally, we showed CCL21 production by medullary thymic epithelial cells (mTECs) was coupled with heparan sulfate–dependent presentation by mesenchymal adventitial cells and pericytes, enabling CCL21 to accumulate at sites of thymic exit. Collectively, we identified the importance of CCL21 in the control of neonatal thymus emigration and revealed a mechanism where mTEC/mesenchyme synergy ensured its production and presentation at sites of thymic exit.
Materials and methods
Mice
Neonatal mice were used at age 10 days: wild-type (WT) C57BL/6, plt/plt,25 Ccl19−/−,26 and Ccl21tdTom knock-in.27 Heterozygous Ccl21tdTom reporter mice were used to analyze CCl21a expression, and homozygous mice were used as Ccl21a-deficient mice alongside heterozygous littermates. CD45.1+BoyJ mice were used at age 8 weeks as hosts for thymus grafting. plt/plt mice were crossed with Rag2GFP28 mice to generate plt/pltRag2GFP mice. Mice were housed at the Biomedical Services Unit, University of Birmingham. All experiments were approved by the Birmingham Animal Welfare and Ethical Review Board and UK Home Office.
Flow cytometry
For T-cell analysis, tissues were enzymatically digested using collagenase D (2.5 mg/mL; Roche) and DNase I (40 mg/mL; Roche). Spleens were treated with Red Cell Lysis Buffer (Sigma). Suspensions were stained with the following antibodies: anti-CD25 (eBio3C7), anti-TCRβ (H57.597), anti-FoxP3 (FJK-16s), anti-CD69 (H1.2F3), anti-CD62L (MEL-14,), anti-CD45.1 (A20), and anti-CD45.2 (104; eBioscience), as well as anti-CD4 (RM4-5) and anti-CD8 (53-6-7; BioLegend). For stromal analysis, thymus was digested using collagenase dispase (2.5 mg/mL; Roche) and DNase I (40 mg/mL; Roche). CD45+ cells were depleted using anti-CD45 microbeads and LS columns (Miltenyi Biotec). Suspensions were stained with the following: anti-EpCAM1 (G8.8), anti-CD45 (30-F11), anti-CD31 (eBio 390/390), anti-Ly51 (6C3), and anti-IA/IE (M5/114.15.2; eBioscience); LIVE/DEAD Fixable Dead Cell Stain Kit (Invitrogen); anti-CD80 (16-10A1) and anti-TER119 (TER119; BioLegend); UEA1 biotin (Vector Labs) detected using streptavidin phycoerythrin-Cy7 (eBioscience); anti-CD34 biotin (RAM34; eBioscience) detected using streptavidin BV786 (BioLegend); and anti–integrin α7 (334908; R&D Systems). Heparan sulfate was detected using anti–heparan sulfate (10E4; AMSbio) and anti-mouse immunoglobulin M (IgM) fluorescein isothiocyanate (FITC; eB121-15F9; eBioscience). Anti–Δ heparan sulfate (3G10; AMSbio) antibody was used to reveal the neoepitope (unsaturated uronic acid) exposed on the core protein upon digestion using heparinase III and detected with anti-mouse IgG FITC (eBioscience). Acquisition was performed using an LSR Fortessa (Becton Dickinson), and data were processed using FlowJo (BD Life Sciences).
Confocal microscopy
Sections (7 μm) were cut from snap-frozen thymus tissue and then fixed in acetone. For Ccl21tdTom reporter sections, tissues were paraformaldehyde fixed in 2% paraformaldehyde and 30% sucrose. Antibodies/reagents used were as follows: 4′,6-diamidino-2-phenylindole, anti-CD205 (ab51817; Abcam), UEA1 biotin (Vector Labs) detected using streptavidin 555 (Invitrogen), anti-CD31 (WM-59; eBioscience), ERTR529 detected using anti-rat IgM 647 (Invitrogen), anti-CCL21 (Lifespan Bioscience) detected using anti-rabbit 647 (Life Technologies), anti–heparan sulfate (10E4; AMSbio) detected using anti-mouse IgM FITC (eB121-15F9; eBioscience), and anti–Δ-heparan sulfate (3G10; AMS Biotechnology) antibody detected with anti-mouse IgG FITC (eBioscience).
Thymus transplantation
Embryonic day–17 thymic lobes were transplanted under the kidney capsule of congenic CD45.1+ C57BL/6 mice.24 After 7 days, spleen and inguinal lymph nodes were harvested, and graft-derived CD45.2+TCRβ+ T-cells were quantitated.
Stromal presentation of fluorescently tagged chemokines
Cloning and production of CCL19–monomeric red fluorescent protein (mRFP) and CCL21-mRFP have been described.30 To generate a truncated version of CCL21-mRFP lacking the charged C-terminal extension known to account for heparan sulfate binding, we replaced the complementary DNA encoding for the full-length mature CCL21 (amino acids 24-134) with its truncated form (tCCL21; amino acids 24-101) by polymerase chain reaction using the primers CCL21_truncF: 5′-CCA GCC CAG GAA TTC AGG AAG GAC AGG and CCL21_truncR: 5′-CCT GTC CTT CCT GAA TTC CTG GGC TGG TTT C. HEK293 cells were transiently transfected with pHis6-SUMO-tCCL21-mRFP, and the supernatants containing the secreted fluorescently labeled chemokine were collected. His6-SUMO-tCCL21-mRFP proteins were purified over an Ni2+ column and digested with SUMOstar protease (LifeSensors), liberating tCCL21-mRFP with its natural mature N-terminus, which was repurified again over an Ni2+ column as described for CCL19-mRFP and CCL21-mRFP.30 Thymic stromal cells were incubated for 30 minutes at room temperature with 5 nM of fluorescently tagged CCL21, CCL19, or tCCL21, washed, and then stained with cell surface markers to identify individual stromal subsets.
Heparinase III enzyme treatment
Thymus stromal suspensions or sections were incubated for 60 minutes at 37°C with 2 μg/mL of heparinase III (R&D Systems) in 0.1% bovine serum albumin (or 0.1% bovine serum albumin alone for controls), with an additional 100 μL added after 30 minutes. Suspensions were washed and stained with indicated antibodies, and sections were stained with anti-CD31 and anti–heparan sulfate/Δ-heparan sulfate.
Statistical analysis
Graphpad Prism 8 software was used for all analyses. Unpaired 2-tailed Student t tests were used unless otherwise stated. Significance is stated in figure legends; nonsignificant differences were not specified.
Results
CCR7L deficiency increases intrathymic dwell time of mature SP thymocytes
To examine how CCR7Ls influence neonatal thymus emigration, we examined thymocytes in CCR7L-deficient plt/plt mice,25 using +/plt littermate controls to limit interlitter variation. In line with earlier studies,9 we examined mice at postnatal day 10 to study the first cohorts of αβT cells in both thymus and periphery. Initial analysis showed increased numbers of conventional CD25−Foxp3−TCRβhiCD4+CD8− SP4 (cSP4) and TCRβhiCD4−CD8+ SP8 (SP8) thymocytes in plt/plt mice (Figure 1A; supplemental Figure 1). Although this agrees with earlier studies,9 it has not yet been assessed whether this specifically relates to perturbations in thymus emigration and/or other intrathymic events. To address this, we subdivided bulk cSP4 and SP8 thymocytes into immature egress-incompetent (CD69+CD62L−) and mature egress-competent (CD69−CD62L+) cells. Strikingly, mature CD69−CD62L+ subsets of both cSP4 and SP8, but not immature CD69+CD62L− subsets, were increased in plt/plt mice (Figure 1B-C). Thus, plt/plt mice showed a selective increase in mature thymocytes. Importantly, percentages of Ki67+ mature cSP4 (Figure 1B) or SP8 (Figure 1C) thymocytes in plt/plt mice were not increased. Rather, Ki67+ mature cSP4 were decreased in plt/plt mice (Figure 1B). The reasons for this are unknown; however, this argues that increased mature SP thymocytes in plt/plt mice are not due to increased proliferation. Rather, our findings are consistent with the idea that intrathymic accumulation in the absence of CCR7L is caused by defective emigration.
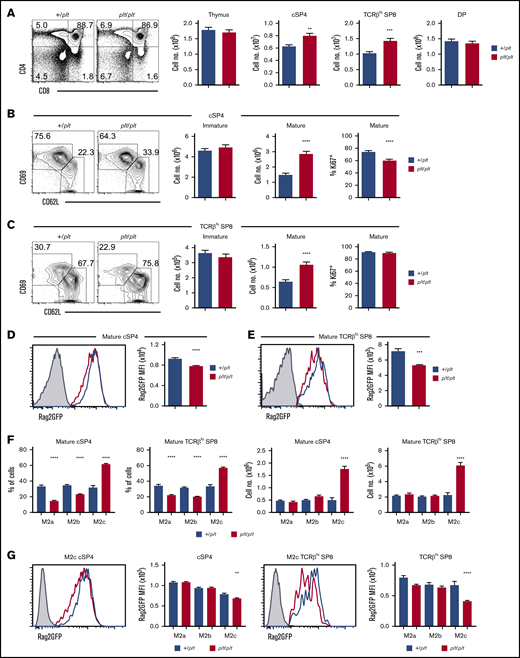
CCR7L deficiency prolongs the intrathymic dwell time Of neonatal SP thymocytes. (A-C) Flow cytometric analysis of thymocytes in plt/plt (n = 16) and +/plt (n = 16) littermate postnatal day–10 neonatal mice. cSP4 were gated as CD4+TCRβhiCD25−Foxp3−, SP8 as CD8+TCRβhi, immature SP as CD69+CD62L−, and mature SP as CD69−CD62L+. Percentages of cSP4 and SP8 expressing Ki67 are also shown in panels B and C. (E-D) Rag2GFP levels in cSP4 and SP8 thymocytes from Rag2GFPplt/plt mice (n = 5; red) and Rag2GFP+/plt controls (n = 7; blue). Gray histograms indicate nonfluorescent control cells. (F) Numbers and frequencies of M2a, M2b, and M2c subsets of mature CD69−CD62L+ cSP4 and SP8 in Rag2GFP+/plt (n = 16) controls and Rag2GFP plt/plt mice (n = 16). Bar chart indicates percentages of each subset in Rag2GFP+/plt (blue bars) and Rag2GFP plt/plt (red bars). (G) Rag2GFP levels in the M2c subset of cSP4 and SP8 thymocytes from +/plt controls (n = 7; blue) and plt/plt (n = 5; red) mice. Bar charts show percentages of M2a, M2b, and M2c subsets of cSP4 and SP8 in +/plt (blue bars) and plt/plt (red bars). For analysis of data in panels F and G, multiple comparison analysis was achieved by a 2-way analysis of variance followed by Sidak’s posttest in GraphPad Prism to determine statistical differences. In all cases, error bars represent mean ± SEM. Flow cytometric data representative of at least 3 independent experiments. **P < .01, ***P < .001, ****P < .0001. DP, double positive; MFI, mean fluorescence intensity.
CCR7L deficiency prolongs the intrathymic dwell time Of neonatal SP thymocytes. (A-C) Flow cytometric analysis of thymocytes in plt/plt (n = 16) and +/plt (n = 16) littermate postnatal day–10 neonatal mice. cSP4 were gated as CD4+TCRβhiCD25−Foxp3−, SP8 as CD8+TCRβhi, immature SP as CD69+CD62L−, and mature SP as CD69−CD62L+. Percentages of cSP4 and SP8 expressing Ki67 are also shown in panels B and C. (E-D) Rag2GFP levels in cSP4 and SP8 thymocytes from Rag2GFPplt/plt mice (n = 5; red) and Rag2GFP+/plt controls (n = 7; blue). Gray histograms indicate nonfluorescent control cells. (F) Numbers and frequencies of M2a, M2b, and M2c subsets of mature CD69−CD62L+ cSP4 and SP8 in Rag2GFP+/plt (n = 16) controls and Rag2GFP plt/plt mice (n = 16). Bar chart indicates percentages of each subset in Rag2GFP+/plt (blue bars) and Rag2GFP plt/plt (red bars). (G) Rag2GFP levels in the M2c subset of cSP4 and SP8 thymocytes from +/plt controls (n = 7; blue) and plt/plt (n = 5; red) mice. Bar charts show percentages of M2a, M2b, and M2c subsets of cSP4 and SP8 in +/plt (blue bars) and plt/plt (red bars). For analysis of data in panels F and G, multiple comparison analysis was achieved by a 2-way analysis of variance followed by Sidak’s posttest in GraphPad Prism to determine statistical differences. In all cases, error bars represent mean ± SEM. Flow cytometric data representative of at least 3 independent experiments. **P < .01, ***P < .001, ****P < .0001. DP, double positive; MFI, mean fluorescence intensity.
To investigate this, we crossed plt/plt mice with Rag2GFP mice,28 where GFP levels indicated cellular age and length of time SP thymocytes spent in the thymus.13,14,23 Interestingly, significantly decreased GFP levels were observed in mature CD69−CD62L+ cSP4 (Figure 1D) and CD69−CD62L+ SP8 (Figure 1E) from plt/plt mice. Importantly, proliferation of mature cSP4 and SP8 did not increase (Figure 1B-C), excluding the possibility that reduced GFP is caused by enhanced proliferation-associated GFP dilution. To examine whether plt/plt SP thymocytes display increased dwell time, we subdivided CD69−CD62L+ mature cSP4 and SP8 thymocytes into developmental stages14 based on CD62L levels, where CD62Llo (M2a) are the least mature, followed by CD62Lint (M2b) and the most mature CD62Lhi (M2c) cells (supplemental Figure 1). Because M2c cells express the highest levels of S1P1 within CD69−CD62L+ cells and are enriched within recent thymus emigrants (RTEs),14 their intrathymic frequency indicates thymus emigration rates. We saw a significant bias toward cSP4 and SP8 cell M2c subsets in plt/plt mice (Figure 1F), which was accompanied by selective reductions in GFP levels in cSP4 and SP8 M2c cells (Figure 1G). Collectively, alterations in mature subsets of cSP4 and SP8 thymocytes in neonatal plt/plt mice indicate prolonged intrathymic dwell times, providing evidence of a role for CCR7L in thymus emigration.
CCL21 is important for neonatal thymus emigration
plt/plt mice carry a genomic deletion resulting in absence of both Ccl19 and Ccl21a loci, the latter encoding the CCL21Serine (CCL21Ser) form of CCL21.25,31 Therefore, it is not known whether thymus emigration defects in plt/plt mice are due to absence of individual or multiple CCR7Ls. Because CCL19 and CCL21Ser are both detectable in WT thymus,32 we examined thymus emigration in neonatal mice lacking either CCL19 (Ccl19−/−)26 or CCL21Ser (Ccl21a−/−).27 Importantly, analysis of SP thymocyte heterogeneity in Ccl19−/− mice showed no alterations in cSP4 and SP8 thymocytes, including mature CD69−CD62L+ cells (supplemental Figure 2A-C) and their M2a, M2b, and M2c subsets (supplemental Figure 2D). Thus, CCL19 does not play an important role in thymus emigration. In contrast, comparable analysis of Ccl21a−/− neonates showed significantly increased mature CD69−CD62L+ cSP4 and SP8 thymocytes (Figure 2A-C). Moreover, we saw a selective increase in CD62L+ M2c cells for both cSP4 and SP8 (Figure 2D). Thus, accumulations of egress-competent cSP4 and SP8 thymocytes in plt/plt mice were observed in Ccl21a−/− but not Ccl19−/− mice, suggesting an important role for CCL21Ser, but not CCL19, in thymus emigration.

CCL21 is important for neonatal SP thymocyte egress. (A) Flow cytometric analysis and quantitation of CD4/CD8 thymocyte subsets from postnatal day–10 (P10) Ccl21a−/− (n = 15; red bars) and Ccl21a+/− (n = 16; blue bars) littermate controls. Quantitation of immature CD69+CD62L− and mature CD69−CD62L+ subsets of cSP4 (B) and TCRβhi SP8 (C) thymocytes in Ccl21a−/− (n = 15; red bars) and Ccl21+/− (n = 16; blue bars) littermate P10 neonatal mice. (D) Numbers and frequencies of M2a, M2b, and M2c subsets of cSP4 and SP8 thymocytes in Ccl21a+/− (blue bars) and Ccl21a−/− (red bars) mice. For analysis of data in panel D, multiple comparison analysis was achieved by a 2-way analysis of variance followed by Sidak’s posttest in GraphPad Prism to determine statistical differences. In all cases, error bars represent mean ± SEM. Flow cytometric data representative of 3 independent experiments. *P < .05, ***P < .001, ****P < .0001.
CCL21 is important for neonatal SP thymocyte egress. (A) Flow cytometric analysis and quantitation of CD4/CD8 thymocyte subsets from postnatal day–10 (P10) Ccl21a−/− (n = 15; red bars) and Ccl21a+/− (n = 16; blue bars) littermate controls. Quantitation of immature CD69+CD62L− and mature CD69−CD62L+ subsets of cSP4 (B) and TCRβhi SP8 (C) thymocytes in Ccl21a−/− (n = 15; red bars) and Ccl21+/− (n = 16; blue bars) littermate P10 neonatal mice. (D) Numbers and frequencies of M2a, M2b, and M2c subsets of cSP4 and SP8 thymocytes in Ccl21a+/− (blue bars) and Ccl21a−/− (red bars) mice. For analysis of data in panel D, multiple comparison analysis was achieved by a 2-way analysis of variance followed by Sidak’s posttest in GraphPad Prism to determine statistical differences. In all cases, error bars represent mean ± SEM. Flow cytometric data representative of 3 independent experiments. *P < .05, ***P < .001, ****P < .0001.
As well as causing an accumulation of SP thymocytes, impaired thymus emigration also reduces RTEs in peripheral tissues.4,33 However, because CCR7Ls control T-cell migration into secondary lymphoid tissues,25-27,34 alterations in the peripheral T-cell compartments of CCR7/CCR7L-deficient mice cannot be directly attributed to altered thymus emigration. To examine whether accumulation of mature SP thymocytes in Ccl21a−/− mice maps to specific requirements for thymic expression of CCL21Ser, we transplanted CD45.2+Ccl21a−/− or CD45.2+Ccl21a+/− lymphoid thymic lobes into WT CD45.1+ mice (Figure 3A). Here, we were able to track emigration of a single cohort of CD45.2+ thymocytes from a thymus lacking CCL21Ser into WT peripheral tissues where CCR7L were expressed normally. Comparable thymocyte cellularities in Ccl21a−/− and Ccl21a+/− thymuses before and after transplantation indicated no gross changes in T-cell development (Figure 3B; supplemental Figure 3). Importantly however, after transplantation, we saw significantly fewer cSP4 and SP8 RTEs in spleens of WT mice receiving Ccl21a−/− thymic lobes (Figure 3C-D). Thus, absence of intrathymic CCL21Ser leads to reduced RTEs in WT peripheral tissues, which argues in favor of an important role for this chemokine in neonatal thymus emigration.

Thymus-specific CCL21 deficiency decreases RTE frequency in WT peripheral tissues. (A) Schematic of the experimental approach used to measure thymic output from Ccl21a-deficient thymus. Freshly isolated E17 CD45.2+Ccl21a+/− or Ccl21a−/− thymic lobes were grafted under the kidney capsule of CD45.1+ WT hosts. Spleens were harvested from host mice 7 days after surgery. (B) Quantitation of total thymocyte numbers, and the number and proportion of CD4+CD8+ double-positive (DP) thymocytes in E17 Ccl21a+/− (n = 10) or Ccl21a−/− (n = 11) thymic lobes before transplantation. Flow cytometric detection and quantitation of donor thymus–derived CD45.2+TCRβhi T cells (C) and CD45.2+TCRβhi cSP4 and CD45.2+TCRβhi SP8 T cells (D) in the spleens of WT mice that received either Ccl21a+/− (n = 8; blue bars) or Ccl21a−/− (n = 8; red bars) grafts. Error bars represent mean ± SEM. Flow cytometric data representative of at least 3 independent experiments. *P < .05, **P < .01.
Thymus-specific CCL21 deficiency decreases RTE frequency in WT peripheral tissues. (A) Schematic of the experimental approach used to measure thymic output from Ccl21a-deficient thymus. Freshly isolated E17 CD45.2+Ccl21a+/− or Ccl21a−/− thymic lobes were grafted under the kidney capsule of CD45.1+ WT hosts. Spleens were harvested from host mice 7 days after surgery. (B) Quantitation of total thymocyte numbers, and the number and proportion of CD4+CD8+ double-positive (DP) thymocytes in E17 Ccl21a+/− (n = 10) or Ccl21a−/− (n = 11) thymic lobes before transplantation. Flow cytometric detection and quantitation of donor thymus–derived CD45.2+TCRβhi T cells (C) and CD45.2+TCRβhi cSP4 and CD45.2+TCRβhi SP8 T cells (D) in the spleens of WT mice that received either Ccl21a+/− (n = 8; blue bars) or Ccl21a−/− (n = 8; red bars) grafts. Error bars represent mean ± SEM. Flow cytometric data representative of at least 3 independent experiments. *P < .05, **P < .01.
Neonatal thymic expression of Ccl21a selectively maps to mTEC subsets
Given the importance of CCL21Ser in regulating neonatal thymus emigration, we next analyzed patterns of Ccl21a gene expression in cellular compartments of the neonatal thymus. Here, we used Ccl21atdTom reporter mice,27 and background levels of tdTomato were set using WT controls. Thymic lobes were enzymatically digested and subdivided into CD45−EpCAM1+ TECs and CD45+ hemopoietic cells. In agreement with expression patterns reported for adult thymus,27 Ccl21a was detectable in EpCAM1+ TECs but not hemopoietic cells (Figure 4A). Further analysis of non-TEC stromal compartments showed Ccl21a expression was undetectable in CD45−EpCAM1−CD31+ endothelium and CD45−EpCAM1−CD31− mesenchyme, indicating Ccl21a is selectively expressed by TECs in neonatal thymus (Figure 4A). By subdividing TECs into cortical TECs and mTECs, we found EpCAM1+Ly51+UEA1− cTECs lacked Ccl21a expression, whereas EpCAM1+Ly51−UEA1+ mTECs expressed CCL21atdTom at varying levels (Figure 4B). Interestingly, further subdivision of bulk mTECs using MHC II and CD80 expression revealed ∼50% of both MHCIIhiCD80hi mTECshi and MHCIIloCD80lo mTECslo were Ccl21atdTom+ (Figure 4C). Thus, Ccl21a is expressed by multiple mTEC subsets in the neonatal thymus. Importantly, and in line with flow cytometry, confocal microscopy of Ccl21atdTom of thymus sections from Ccl21a heterozygous mice demonstrated restricted expression to thymus medulla (Figure 4D). Thus, analysis of the cellular distribution and anatomic location of Ccl21a expression by stromal microenvironments in neonatal thymus indicates its selective expression by mTECs.

Ccl21a gene expression in the neonatal thymus is restricted to mTECs. (A) Flow cytometric analysis and quantitation of tdTomato expression in total CD45+ thymocytes and the indicated thymic stromal populations in postnatal day–10 (P10) heterozygous Ccl21atdTom mice (n = 8). Thymic mesenchyme was identified as CD45−CD31−EpCAM1− cells. Red lines indicate tdTomato staining levels in heterozygous Ccl21atdTom mice; gray histograms indicate nonfluorescent control cells. Flow cytometric plots and analysis representative of 3 independent experiments. (B) Analysis of Ccl21atdTom expression in P10 EpCAM1+Ly51+UEA1− cTECs and EpCAM1+Ly51−UEA1+ mTECs. (C) Ccl21atdTom expression after subdivision of total mTECs into MHCIIlowCD80low (mTEClo) and MHCIIhiCD80hi (mTEChi) subsets (n = 10). In all cases, error bars represent mean ± SEM. For analysis of data in panel A, multiple comparison analysis was achieved by a 1-way analysis of variance followed by Tukey’s posttest in GraphPad Prism to determine statistical differences. In panel D, confocal microscopy was used to show tdTomato expression in heterozygous Ccl21atdTom P10 mice alongside identification of cTECs with either anti-CD205 (green) or mTECs with UEA1 (green); dotted line denotes the CMJ. Scale bars represent 50 μm. Images shown are representative of 3 mice. ****P < .0001. C, cortex; M, medulla; MHC, major histocompatibility complex.
Ccl21a gene expression in the neonatal thymus is restricted to mTECs. (A) Flow cytometric analysis and quantitation of tdTomato expression in total CD45+ thymocytes and the indicated thymic stromal populations in postnatal day–10 (P10) heterozygous Ccl21atdTom mice (n = 8). Thymic mesenchyme was identified as CD45−CD31−EpCAM1− cells. Red lines indicate tdTomato staining levels in heterozygous Ccl21atdTom mice; gray histograms indicate nonfluorescent control cells. Flow cytometric plots and analysis representative of 3 independent experiments. (B) Analysis of Ccl21atdTom expression in P10 EpCAM1+Ly51+UEA1− cTECs and EpCAM1+Ly51−UEA1+ mTECs. (C) Ccl21atdTom expression after subdivision of total mTECs into MHCIIlowCD80low (mTEClo) and MHCIIhiCD80hi (mTEChi) subsets (n = 10). In all cases, error bars represent mean ± SEM. For analysis of data in panel A, multiple comparison analysis was achieved by a 1-way analysis of variance followed by Tukey’s posttest in GraphPad Prism to determine statistical differences. In panel D, confocal microscopy was used to show tdTomato expression in heterozygous Ccl21atdTom P10 mice alongside identification of cTECs with either anti-CD205 (green) or mTECs with UEA1 (green); dotted line denotes the CMJ. Scale bars represent 50 μm. Images shown are representative of 3 mice. ****P < .0001. C, cortex; M, medulla; MHC, major histocompatibility complex.
CCL21 protein presentation at sites of thymic exit
Because exit of mature SP thymocytes from thymus involves migration toward blood vessels at the CMJ,16,18 we wondered how mTECs restricted gene expression of Ccl21a related to its importance in neonatal thymic exit. To identify and compare sites of chemokine production and localization, we performed confocal microscopy of WT neonatal thymus sections using anti-CCL21 antibody to analyze distribution of CCL21 protein within medullary environments. Sections were costained with ERTR5 and anti-CD31 to detect mTECs and blood vessels, respectively. CCL21 protein was detected in medullary areas, including in ERTR5+ mTECs (Figure 5A). Staining observed with anti-CCL21 antibody was specific; no signal was observed when the same reagent was used on Ccl21a−/− thymus sections (Figure 5B). Interestingly, closer investigation revealed CCL21 protein was associated with ERTR5+ mTECs and CD31+ blood vessels at the CMJ, but not with cortical CD31+ vessels (Figure 5A,C). Indeed, higher magnification of CCL21+ vessels at the CMJ indicated CCL21 protein accumulated around CD31+ endothelial cells (Figure 5C). Collectively, these findings demonstrate the mTEC product CCL21 does not show even distribution in the thymus medulla. Rather, this chemokine is concentrated at CMJ blood vessels representing sites of thymic exit.
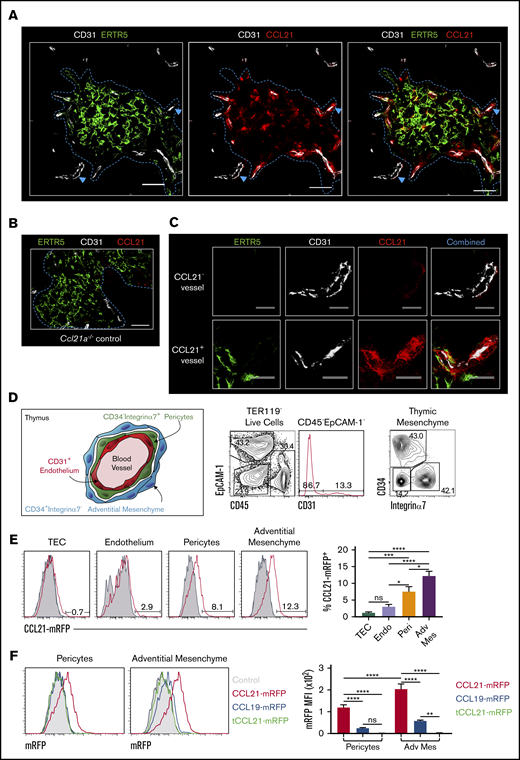
CCL21 protein is presented by thymic mesenchyme at sites of thymic exit. (A) Confocal images of thymus sections from postnatal day–10 (P10) WT mice stained with antibodies to the endothelial marker CD31 (white), mTEC marker ERTR5 (green), and CCL21 protein (red). Blue dotted line indicates the CMJ, and blue arrows indicate vessels investigated at higher magnification in panel C. (B) Image of a thymus section from a Ccl21a knockout P10 mouse stained with anti-CCL21 (red), anti-CD31 (white), and ERTR5 (green). Note the absence of CCL21 staining. Scale bars in panels A and B denote 50 μm. (C) High-power images of CCL21− (upper panels) and CCL21+ (lower panels) vessels identified by blue arrowheads in panel A. Images show individual channels for ERTR5 (green), CD31 (white), and CCL21 protein (red), as well as a combined image showing all markers simultaneously. Scale bars denote 25 μm. Data are representative of 4 mice from 2 separate experiments. (D) Schematic diagram and flow cytometric analysis of thymic mesenchymal populations associated with thymic blood vessels. Schematic is based on findings of Sitnik et al35 and demonstrates CD34−integrin α7+ pericytes and CD34+integrin α7− adventitial mesenchymal cells that surround thymic blood vessels. Flow cytometric analysis shows identification of these populations in P10 WT thymus. (E) Flow cytometric analysis of presentation of CCL21-mRFP by indicated thymic stromal populations in plt/plt P10 thymus suspensions. Gray histograms represent control staining seen in the absence of CCL21-mRFP. Bar chart indicates percentages of CCL21-mRFP+ cells within each stromal subset. (F) Flow cytometric analysis of stromal cell presentation of full-length CCL21-mRFP (red), full-length CCL19-mRFP (blue), or tCCL21-mRFP (green) by CD34−integrin α7+ pericytes and CD34+integrin α7− adventitial mesenchymal cells. Gray filled histograms represent staining levels observed when no chemokines were added. Bar chart shows mRFP mean fluorescence intensity (MFI) for each fluorescent chemokine and indicated stromal cell type. For analysis of data in panels E and F, multiple comparison analysis was achieved by a 1-way analysis of variance (ANOVA) followed by Tukey’s post-test (E) or 2-way ANOVA followed by Sidak’s posttest (F) in GraphPad Prism to determine statistical differences. All data shown representative of 3 independent experiments, with a total of 7 to 11 mice for each analysis. Error bars represent mean ± SEM. *P < .05, **P < .01, ***P < .001, ****P < .0001.
CCL21 protein is presented by thymic mesenchyme at sites of thymic exit. (A) Confocal images of thymus sections from postnatal day–10 (P10) WT mice stained with antibodies to the endothelial marker CD31 (white), mTEC marker ERTR5 (green), and CCL21 protein (red). Blue dotted line indicates the CMJ, and blue arrows indicate vessels investigated at higher magnification in panel C. (B) Image of a thymus section from a Ccl21a knockout P10 mouse stained with anti-CCL21 (red), anti-CD31 (white), and ERTR5 (green). Note the absence of CCL21 staining. Scale bars in panels A and B denote 50 μm. (C) High-power images of CCL21− (upper panels) and CCL21+ (lower panels) vessels identified by blue arrowheads in panel A. Images show individual channels for ERTR5 (green), CD31 (white), and CCL21 protein (red), as well as a combined image showing all markers simultaneously. Scale bars denote 25 μm. Data are representative of 4 mice from 2 separate experiments. (D) Schematic diagram and flow cytometric analysis of thymic mesenchymal populations associated with thymic blood vessels. Schematic is based on findings of Sitnik et al35 and demonstrates CD34−integrin α7+ pericytes and CD34+integrin α7− adventitial mesenchymal cells that surround thymic blood vessels. Flow cytometric analysis shows identification of these populations in P10 WT thymus. (E) Flow cytometric analysis of presentation of CCL21-mRFP by indicated thymic stromal populations in plt/plt P10 thymus suspensions. Gray histograms represent control staining seen in the absence of CCL21-mRFP. Bar chart indicates percentages of CCL21-mRFP+ cells within each stromal subset. (F) Flow cytometric analysis of stromal cell presentation of full-length CCL21-mRFP (red), full-length CCL19-mRFP (blue), or tCCL21-mRFP (green) by CD34−integrin α7+ pericytes and CD34+integrin α7− adventitial mesenchymal cells. Gray filled histograms represent staining levels observed when no chemokines were added. Bar chart shows mRFP mean fluorescence intensity (MFI) for each fluorescent chemokine and indicated stromal cell type. For analysis of data in panels E and F, multiple comparison analysis was achieved by a 1-way analysis of variance (ANOVA) followed by Tukey’s post-test (E) or 2-way ANOVA followed by Sidak’s posttest (F) in GraphPad Prism to determine statistical differences. All data shown representative of 3 independent experiments, with a total of 7 to 11 mice for each analysis. Error bars represent mean ± SEM. *P < .05, **P < .01, ***P < .001, ****P < .0001.
Thymic blood vessels are surrounded by concentric layers of mesenchyme (Figure 5D), where an outer layer of adventitial cells surrounds pericytes that ensheath CD31+ endothelial cells.17,18,35 Given the close proximity of both mesenchymal cell types to sites of CCL21 accumulation, we examined their relationship with CCL21 protein distribution. Using flow cytometric analysis of digested WT neonatal thymus, we identified pericytes as CD45−EpCAM1−CD31−CD34−integrin α7+ cells35 and adventitial mesenchymal cells as CD45−EpCAM1+CD31−CD34+integrin α7− cells35 (Figure 5D). To investigate their possible involvement in CCL21 localization, we examined the ability of thymic stromal subsets within digested plt/plt thymus to immobilize and present RFP-tagged recombinant CCL21. Thymus suspensions were incubated with full-length CCL21-mRFP protein and then stained with antibodies identifying stromal subsets. Interestingly, pericytes and adventitial cells clearly bound CCL21-mRFP protein, with a small but significant increase in adventitial cells compared with pericytes (Figure 5E). In contrast, little or no CCL21-mRFP binding by TECs or endothelium was observed (Figure 5E), with RFP fluorescence levels comparable to those of controls. Thus, the ability to capture and present CCL21 is restricted to specific thymic stromal subsets, namely pericytes and adventitial cells.
For T-cell migration in peripheral tissues, CCL21 is captured and immobilized by blood vessel–associated extracellular matrix (ECM) components.36,37 To facilitate this, CCL21 contains a positively charged C-terminal domain that binds to negatively charged ECM components, including heparin-like glycosaminoglycans (GAGs).9,38 We therefore examined whether CCL21-mRFP binding by thymic pericytes and adventitial mesenchyme might operate similarly. We incubated neonatal plt/plt thymus suspensions with full-length CCL21-mRFP or tCCL21-mRFP, which lacked the charged C-terminal extension, and assessed binding to thymic stromal populations by flow cytometry. Importantly, and in contrast to full-length CCL21-mRFP, neither pericytes nor adventitial cells bound tCCL21-mRFP (Figure 5F), indicating the C-terminal region of CCL21 is essential for immobilization by thymic stroma. Moreover, and in line with this, both pericytes and adventitial cells showed minimal binding of an RFP-conjugated form of CCL19, a CCR7L that lacks the C-terminal domain contained within CCL21 (Figure 5F). Thus, mesenchymal stromal cells surrounding sites of thymic exit capture and present mTEC-derived CCL21 at their surface, and this requires the C-terminal extension of CCL21 capable of ECM binding.
Thymic mesenchyme presents CCL21 via heparan sulfate
In lymph nodes, heparan sulfate is a GAG that captures CCL21 for T-cell migration.36 Given the presentation of CCL21 by thymic mesenchyme, we next analyzed intrathymic expression of heparan sulfate via flow cytometry. Hemopoietic and endothelial cells lacked detectable heparan sulfate expression, with only a small shift in fluorescence detectable in TECs (Figure 6A-B). In contrast, pericytes and adventitial cells showed high levels of heparan sulfate expression (Figure 6A), with the highest levels detectable on adventitial cells (Figure 6B). Consistent with this selective expression, heparan sulfate was also detectable around CD31+ thymic blood vessels in thymus sections that represent sites of adventitial mesenchyme, pericytes and CCL21 protein accumulation (Figure 6C).

Thymic heparan sulfate is restricted to adventitial mesenchyme and pericytes. Flow cytometric analysis (A) and quantitation (B) of heparan sulfate expression by CD45+ thymocytes, CD31+ endothelium, EpCAM-1+ TECs, CD34−integrin α7+ pericytes, and CD34+integrin α7− adventitial mesenchyme in postnatal day–10 (P10) WT thymus. Gray filled histograms indicate staining levels where no anti–heparan sulfate primary antibody was added. (B) Analysis of mean fluorescence intensity (MFI) of heparan sulfate (HS) on CD34−integrin α7+ pericytes (orange bar) and CD34+integrin α7− adventitial mesenchyme (purple bar) after gating on HS-expressing cells. Data shown from 3 separate experiments with a total of mice. Error bars in panel B represent mean ± SEM. For analysis of data in panel B, multiple comparison analysis was achieved by a 1-way analysis of variance followed by Tukey’s posttest in GraphPad Prism to determine statistical differences. (C) Confocal images of thymus sections from a P10 WT mouse stained with anti-CD31 (blue), anti-HS (green), and anti-CCL21 protein (red). White dotted line indicates the CMJ. Scale bar denotes 20 μm. Images shown representative of 5 mice. *P < .05, ** P < .01, ****P < .0001. C, cortex; M, medulla.
Thymic heparan sulfate is restricted to adventitial mesenchyme and pericytes. Flow cytometric analysis (A) and quantitation (B) of heparan sulfate expression by CD45+ thymocytes, CD31+ endothelium, EpCAM-1+ TECs, CD34−integrin α7+ pericytes, and CD34+integrin α7− adventitial mesenchyme in postnatal day–10 (P10) WT thymus. Gray filled histograms indicate staining levels where no anti–heparan sulfate primary antibody was added. (B) Analysis of mean fluorescence intensity (MFI) of heparan sulfate (HS) on CD34−integrin α7+ pericytes (orange bar) and CD34+integrin α7− adventitial mesenchyme (purple bar) after gating on HS-expressing cells. Data shown from 3 separate experiments with a total of mice. Error bars in panel B represent mean ± SEM. For analysis of data in panel B, multiple comparison analysis was achieved by a 1-way analysis of variance followed by Tukey’s posttest in GraphPad Prism to determine statistical differences. (C) Confocal images of thymus sections from a P10 WT mouse stained with anti-CD31 (blue), anti-HS (green), and anti-CCL21 protein (red). White dotted line indicates the CMJ. Scale bar denotes 20 μm. Images shown representative of 5 mice. *P < .05, ** P < .01, ****P < .0001. C, cortex; M, medulla.
To examine the functional importance of heparan sulfate in mesenchymal presentation of CCL21, thymus sections were treated with heparinase III, an enzyme that digests heparan sulfate,39,40 and then stained with antibodies specific for either intact heparan sulfate or its digested form (Δ-heparan sulfate).36 Untreated thymus sections showed positive staining for heparan sulfate around CD31+ blood vessels (Figure 7A upper panels), and the digested form of Δ-heparan sulfate was barely detectable (Figure 7A lower panels). In contrast, treatment with heparinase III before antibody staining abrogated detection of heparan sulfate (Figure 7B upper panels) and resulted in the detection of Δ-heparan sulfate (Figure 7B lower panels). Consistent with this, flow cytometric analysis showed that pericytes and adventitial mesenchyme stained positively for heparan sulfate but not Δ-heparan sulfate before heparinase III treatment (Figure 7C), whereas the converse was apparent after enzyme treatment (Figure 7D). Significantly, pretreatment of thymic stromal suspensions with heparinase III before incubation with CCL21-mRFP significantly reduced chemokine presentation by both adventitial mesenchyme and pericytes (Figure 7E). Together, these findings indicate adventitial mesenchyme and pericytes represent distinct stromal compartments that present mTEC-derived CCL21 at sites of thymic exit, which involves heparan sulfate–mediated immobilization and presentation of CCL21.

Heparan sulfate mediates CCL21 presentation at sites of thymic exit. (A) Confocal image of a blood vessel in a WT postnatal day–10 (P10) thymus section stained with anti-CD31 (red) and either anti–heparan sulfate (green; upper images) or an antibody to detect Δ-heparan sulfate (green; lower images). (B) Confocal images as in panel A, but sections were treated with heparinase III (H’ase III) enzyme before antibody staining. Scale bars denote 20 μm. Images typical of 2 separate experiments involving at least 3 mice. (C) Flow cytometric analysis of heparan sulfate expression by pericytes and adventitial mesenchyme before (blue histogram and blue bar) and after (red histogram and red bar) heparinase III treatment. (D) Flow cytometric analysis of Δ-heparan sulfate expression by pericytes and adventitial mesenchyme before (blue histogram and blue bar) or after (red histogram and red bar) heparinase III treatment. Bar charts in panels C and D show mean fluorescence intensity (MFI) expression levels of heparan sulfate and Δ-heparan sulfate, respectively. Data from 3 experiments with a minimum of 8 mice. (E) Flow cytometric analysis of CCL21m-RFP chemokine presentation by adventitial mesenchyme (upper panels) and pericytes (lower panels) in digested P10 WT thymus samples before (blue line) and after (red line) heparinase III treatment. Gray histograms represent control staining where no chemokine was added. Data from 3 separate experiments and 11 mice. Error bars represent mean ± SEM. Paired Student t tests were performed for statistical analysis of data in panel E. ****P < .0001.
Heparan sulfate mediates CCL21 presentation at sites of thymic exit. (A) Confocal image of a blood vessel in a WT postnatal day–10 (P10) thymus section stained with anti-CD31 (red) and either anti–heparan sulfate (green; upper images) or an antibody to detect Δ-heparan sulfate (green; lower images). (B) Confocal images as in panel A, but sections were treated with heparinase III (H’ase III) enzyme before antibody staining. Scale bars denote 20 μm. Images typical of 2 separate experiments involving at least 3 mice. (C) Flow cytometric analysis of heparan sulfate expression by pericytes and adventitial mesenchyme before (blue histogram and blue bar) and after (red histogram and red bar) heparinase III treatment. (D) Flow cytometric analysis of Δ-heparan sulfate expression by pericytes and adventitial mesenchyme before (blue histogram and blue bar) or after (red histogram and red bar) heparinase III treatment. Bar charts in panels C and D show mean fluorescence intensity (MFI) expression levels of heparan sulfate and Δ-heparan sulfate, respectively. Data from 3 experiments with a minimum of 8 mice. (E) Flow cytometric analysis of CCL21m-RFP chemokine presentation by adventitial mesenchyme (upper panels) and pericytes (lower panels) in digested P10 WT thymus samples before (blue line) and after (red line) heparinase III treatment. Gray histograms represent control staining where no chemokine was added. Data from 3 separate experiments and 11 mice. Error bars represent mean ± SEM. Paired Student t tests were performed for statistical analysis of data in panel E. ****P < .0001.
Discussion
In murine neonates, thymus emigration of conventional αβT cells is critical to establish T-cell compartments for protective immunity. This process is also necessary to avoid autoimmunity caused by disruption of the ordered emigration of conventional and then regulatory T cells that occurs in the neonate.10-12 Here, we show absence of CCR7L promotes accumulation of mature CD62L+ SP thymocytes and prolongs their intrathymic dwell time. Comparison of Ccl19−/− and Ccl21a−/− mice indicated defects occur as a result of a requirement for CCL21Ser but not CCL19. Because both CCL19 and CCL21Ser are expressed by thymic stroma,9,41,42 the requirement for CCL21Ser cannot be explained by lack of CCL19 availability. Rather, CCL21Ser seems specialized in controlling neonatal thymus emigration, a finding that is important in relation to previous work implicating CCL19 in this process.9 For example, earlier studies showed recombinant CCL19, but not CCL21, induced SP thymocyte egress from fetal thymus organ cultures. Furthermore, treatment of WT neonates with neutralizing anti-CCL19 antibodies reduced αβT cells in the spleen.9 The explanation for the discrepancy in these findings and those presented here is unclear. One possibility is differences in the experimental systems used. Whereas Ueno et al9 used both in vivo and in vitro approaches (fetal thymus organ cultures), we used in vivo and ex vivo approaches throughout our study. Thus, the requirements for in vitro thymus emigration may differ to those in vivo. Additionally, becAUSE CCL19 controls αβT-cell entry into the spleen,34 decreased splenic T-cell numbers after anti-CCL19 treatment may be due to inhibition of CCL19 in peripheral tissues. Alternatively, anti-CCL19 treatment may alter peripheral lymphoid tissues, which then alters thymus emigration in a thymus-extrinsic manner. Interestingly, analysis of peripheral T-cell numbers in CCL21-deficient mice showed a reduction of these cells in lymph nodes (data not shown), which again may be due to the reasons outlined above. In sum, we agree with Ueno et al9 on an important role for CCR7 in neonatal thymus emigration. Regarding current data on the roles of individual ligands, our data point toward an intrathymic requirement for CCL21 but not CCL19 in this process. However, a role for CCL19 in peripheral tissues is not ruled out, which would perhaps go some way toward explaining differences between our study and that by Ueno et al.9
As in adults,27 we found Ccl21a expression in neonates mapped to mTECs. Importantly, CCL21 protein accumulated at blood vessels representing sites of emigration, which involved heparan sulfate–mediated presentation by pericytes and adventitial mesenchyme. Interestingly, although enzyme treatment of thymic stroma completely abolished heparan sulfate expression by adventitial cells and pericytes, we still saw low-level CCL21 binding by these cells. One possible explanation for this is that other GAGs produced by these cell types can also contribute to CCL21 capture by thymic stroma. Whatever the case, because CCL21 production is limited to mTECs, whereas CCL21 presentation is a function of pericytes and adventitial cells, this dichotomy underlines the requirement for thymic stromal heterogeneity and identifies functional synergy between TECs and mesenchyme. Interestingly, although we identified roles for both pericytes and adventitial cells within thymic mesenchyme, it is not known whether additional subdivisions occur within these cell types that may relate to their capacity to capture chemokines such as CCL21. Additional studies are required to gain a better understanding of thymic mesenchyme heterogeneity and how it may relate to possible functional specialization. Importantly, CCL21 immobilization and presentation required the positively charged C-terminal extension that allows binding to negatively charged ECM components. Because CCL19 lacks this domain, this fits with its failure to be captured by stroma and mirrors lymph node entry of peripheral T cells, which involves heparan sulfate–mediated CCL21.36 Of note, it is unclear how disruption of intrathymic CCR7-CCL21 interactions results in impaired emigration. One possibility is that this occurs because of the disrupted medullary organization in neonatal Ccl21a−/− mice (data not shown), which has also been reported in adult Ccl21a−/− mice.27 Alternatively, defective emigration may map to the requirement for CCL21 in controlling dendritic cells,43 which have been linked to control of thymus emigration.44 Further work is needed to examine these possibilities.
The requirement for CCL21 in thymus emigration extends our understanding of this chemokine in thymus biology, which includes control of cortex-medulla migration in the adult.27 Related to this, although CCR7 plays additional roles in thymocyte development, including progenitor entry to thymus,45-47 CD4−CD8− precursor positioning,48 and control of the Foxp3+ regulatory T-cell pool,2,49 it is unclear if these requirements require CCL21 or CCL19. Also, unlike in the neonate, adult thymic egress is CCR7 independent.19 It is not known why CCR7 and CCR7L regulate neonatal thymus emigration but are dispensable in adults. One possibility is that in the absence of CCR7-mediated migration, adult SP thymocytes exit via blood vessels present in other thymic sites, and such alternate sites may not be available in neonatal thymus. Another possibility is neonatal T-lymphopenia provides feedback that influences thymus emigration. Whatever the explanation, these findings emphasize age-related differences in control of thymus emigration. Of note, it will be interesting to examine whether thymus emigration of γδT cells, including invariant γδT cells in embryonic periods,50,51 depends upon CCR7/CCL21.
In sum, by examining mechanisms controlling αβT-cell emigration from neonatal thymus, we identify CCL21Ser as an important regulator. These findings extend our understanding of an essential step in immune system formation, as well as the known functions of CCL21 in thymus biology. The collective control of chemokine production and distribution by thymic epithelium and mesenchyme emphasizes the functional importance of stromal cell heterogeneity in T-cell development.
For original data requests, please contact k.d.j.james@bham.ac.uk.
Acknowledgments
The authors thank Sanjiv Luther for providing Ccl19−/− mice, all laboratory members for their critical reading of the manuscript, and Andi Bacon and Biomedical Services Unit staff for animal husbandry. The authors also thank Douglas Dyer for helpful discussions.
This work was supported by Medical Research Council program grant MR/N000919/1 (G.A.); Swiss National Science Foundation grant 310030 189144 (D.F.L.); Japan Society for the Promotion of Science grant 17K08884 and NOVARTIS Foundation (Japan) for the Promotion of Science grant 274-1283 (I.O.); and the Intramural Research Program of the US National Institutes of Health, the National Cancer Institute, and the Center for Cancer Research (Y.T.).
Authorship
Contribution: K.D.J. designed and performed experiments, analyzed data, performed statistical analysis, and wrote the manuscript; A.J.W. designed and performed experiments; D.F.L., V.P., I.O., Y.T., and S.M.P. provided key reagents and expert advice in experimental design and methodology; and G.A. and W.E.J. designed experiments, analyzed data, and wrote the manuscript.
Conflict-of-interest disclosure: The authors declare no competing financial interests.
Correspondence: Graham Anderson, Institute for Immunology and Immunotherapy, Floor 4 Institute for Biomedical Research, Medical School, University of Birmingham, Birmingham B15 2TT, United Kingdom; e-mail: g.anderson@bham.ac.uk.

