

Key Points
There were no meaningful differences in routine clinical hematology laboratory studies between DICER1 carriers and family controls.
Hematologic abnormalities in a DICER1 carrier merit hematologic evaluation and should not be solely attributed to the DICER1 variant.

Abstract
Pathogenic germline variants in DICER1 underlie an autosomal dominant, pleiotropic tumor-predisposition disorder. Murine models with the loss of DICER1 in hematopoietic stem cell progenitors demonstrate hematologic aberrations that include reductions in red and white blood cell counts, hemoglobin volume, and impaired maturation resulting in dysplasia. We investigated whether hematologic abnormalities such as those observed in DICER1-deficient mice were observed in humans with a pathogenic germline variant in DICER1. A natural history study of individuals with germline pathogenic DICER1 variants and family controls conducted through the National Cancer Institute (NCI) evaluated enrollees at the National Institutes of Health Clinical Center during a comprehensive clinical outpatient visit that included collecting routine clinical laboratory studies. These were compared against normative laboratory values and compared between the DICER1 carriers and controls. There were no statistical differences in routine clinical hematology laboratory studies observed in DICER1 carriers and family controls. A review of the medical history of DICER1 carriers showed that none of the individuals in the NCI cohort developed myelodysplastic syndrome or leukemia. Query of the International Pleuropulmonary Blastoma/DICER1 Registry revealed 1 DICER1 carrier who developed a secondary leukemia after treatment of pleuropulmonary blastoma. We found limited evidence that the hematologic abnormalities observed in murine DICER1 models developed in our cohort of DICER1 carriers. In addition, no cases of myelodysplastic syndrome were observed in either the NCI cohort or the International Pleuropulmonary Blastoma/DICER1 Registry; 1 case of presumed secondary leukemia was reported. Abnormalities in hematologic indices should not be solely attributed to DICER1. This trial was registered at www.clinicaltrials.gov as #NCT01247597.
Introduction
DICER1 (OMIM 606241) is located on chromosome 14q32 and encodes an RNaseIII endonuclease essential for the production of microRNAs (miRNAs). A pathogenic germline variant in DICER1 results in an autosomal dominant cancer predisposition disorder associated with both benign and malignant tumors in multiple organs, including pleuropulmonary blastoma (PPB), cystic nephroma, Sertoli-Leydig cell tumors, and others.1-3 Murine studies have shown that DICER1 is involved in regulating normal hematopoiesis in lymphoid and myeloid lineages. By using DICER1 knockout mice, Buza-Vidas et al4 found that after 12 days, there was a reduction in red blood cells (RBCs), white blood cells (WBCs), and hemoglobin (Hgb). Additional work has suggested decreased bone marrow reconstitution in DICER1-deficient mice, and impairment of hematopoietic stem cell progenitors as early as 1 day after bone marrow irradiation and transplantation of DICER1-deficient hematopoietic stem cells and throughout 20 weeks of observation.5 When DICER1 was deleted in the later stages of erythroid development, the mice had normal blood counts compared with controls, but they demonstrated delayed recovery from anemia and a decreased total WBC count, suggesting an impaired compensatory response to bone marrow stress.6 Furthermore, several investigations found that mesenchymal stromal cells from patients with myelodysplastic syndrome (MDS) had lower DICER1 expression, and deletion of DICER1 can also lead to myeloid dysplasia when using DICER1-knockout fetal liver cells.7-9 To our knowledge, there have been no systematic studies in humans on the hematologic consequences (if any) of germline pathogenic variants in DICER1. We investigated whether hematologic abnormalities such as those observed in DICER1-deficient mice were also observed in humans heterozygous with a pathogenic germline variant in DICER1.
Materials and methods
Study population
Individuals with DICER1-associated tumors or pathogenic germline DICER1 variants were recruited to participate in our study titled “DICER1-related Pleuropulmonary Blastoma Cancer Predisposition Syndrome: A Natural History Study,” which was approved by an institutional review board (National Cancer Institute [NCI] Protocol 11C-0034). Probands with DICER1-associated tumors and their family members were offered DICER1 genetic testing. In this analysis, individuals with heterozygous pathogenic DICER1 germline variants are referred to as DICER1 carriers. Participants with suspected or confirmed DICER1 mosaicism (a postzygotic DICER1 mutation) or tumor-confined DICER1 variants were excluded from this analysis. Although our study established that the DICER1 phenotype can arise from mosaicism,10 we excluded individuals with mosaicism, given the uncertainty of determining which specific tissues harbor a DICER1 pathogenic variant. DICER1 mutation–negative and non-bloodline individuals served as controls.
A subset of the individuals enrolled in the DICER1 Natural History Study (DICER1 carriers and family controls) were offered a comprehensive 3-day evaluation at the National Institutes of Health (NIH) Clinical Center. The subset of patients enrolled in the NCI DICER1 Natural History Study who were not evaluated at the NIH Clinical Center are hereafter referred to as the field cohort. All DICER1 carriers received biennial follow-up questionnaires by mail inquiring about the development of new tumors and/or other significant medical problems. All patients provided written informed consent. For individuals younger than age 18 years, parents provided written informed consent. Enrollees older than age 10 years but younger than age 18 years also provided written assent.
Laboratory data collection and evaluation
As part of a 3-day evaluation at the NIH Clinical Center, both DICER1 carriers and family controls underwent laboratory testing by the Department of Laboratory Medicine. Laboratory studies included complete blood counts (with differentials, indices, and peripheral smears), erythropoietin levels, iron studies (serum iron, ferritin, transferrin, and iron saturation), reticulocyte counts, lactate dehydrogenase, erythrocyte sedimentation rate, and fetal Hgb (%). Collectively, these are referred to as hematologic indices. Normal ranges reported by the Department of Laboratory Medicine varied across time, reflecting changes in assays. Data were categorized using normative ranges (including values based on age, sex, and/or year of collection) designated as normal (falling within reported parameters at the time of testing), high (above the upper limit), or low (below the lower limit). Samples that were hemolyzed, clotted, or had insufficient quantity to perform the laboratory testing were excluded from analyses. Not all laboratory values were available for all patients. Patient information and laboratory values were collected from November 2011 through May 2018. Follow-up patient questionnaires were collected through April 2019.
Medical record reviews for diagnoses of hematologic malignancy and MDS
We reviewed longitudinal questionnaires and medical records for diagnoses of hematologic malignancy and/or MDS for DICER1 carriers in both the field and the NIH Clinical Center cohorts as of March 31, 2020. In addition, the International Pleuropulmonary Blastoma/DICER1 Registry (NCT03382158) and the International Pleuropulmonary Blastoma Treatment and Biology Registry (NCT01464606) were queried for any cases of hematologic malignancy or MDS in DICER1 carriers as of June 6, 2020. There were 792 individuals enrolled in the International Pleuropulmonary Blastoma/DICER1 Registry, 595 of whom had sufficient data for ascertainment of a hematology malignancy. There were 72 individuals who were enrolled in both the NCI DICER1 Natural History Study and the International Pleuropulmonary Blastoma/DICER1 Registry.
Statistical analysis
Statistical comparisons were made between DICER1 carriers and family controls using a χ2 test, or an exact test when an expected cell count was low (<5). P values < .05 were considered significant and were not adjusted for multiple comparisons. In a dedicated subgroup analysis, we removed those individuals who received chemotherapy and/or radiation within the 2 years before their evaluation at the NIH Clinical Center to reduce the iatrogenic cytopenias and allow for hematologic recovery. Medians and ranges were compared using a rank-sum test. All statistical analyses were conducted using Stata/IC 15.1.
Results
There were no differences in sex or age between DICER1 carriers and controls
Table 1 lists the demographic characteristics of participants evaluated at the NIH Clinical Center. There were no significant differences in race between DICER1 carriers (89% White) and controls (88% White; P = .70). Few participants were missing laboratory values aside from iron indices, fetal Hgb, and sedimentation rate, collection of which was initiated after the start of the study.
Demographic characteristics of DICER1 carriers and controls
| Characteristic | Controls (n = 64) | DICER1 carriers (n = 121) | ||
|---|---|---|---|---|
| No. | % | No. | % | |
| Sex | ||||
| Female | 30 | 47 | 63 | 52.1 |
| Male | 34 | 53 | 58 | 47.9 |
| Age, y | ||||
| <18 | 24 | 37.5 | 54 | 44.6 |
| ≥18 | 40 | 62.5 | 67 | 55.4 |
| Ethnicity | ||||
| Hispanic | 3 | 4.7 | 10 | 8.3 |
| Not Hispanic | 58 | 90.6 | 111 | 91.7 |
| Unknown | 3 | 4.7 | 0 | 0 |
| Race | ||||
| White | 57 | 89.1 | 106 | 87.6 |
| American Indian or Alaska Native | 0 | 0 | 1 | 0.83 |
| American Indian or Alaska Native and White | 1 | 1.56 | 5 | 4.1 |
| Asian | 0 | 0 | 2 | 1.65 |
| Black or African American | 1 | 1.56 | 0 | 0 |
| Black or African American and White | 1 | 1.56 | 2 | 1.65 |
| Unknown | 4 | 6.25 | 5 | 4.13 |
The distributions of WBC, ferritin, and immature reticulocyte count differed between DICER1 carriers and controls, but there were no significant differences in proportions of RBCs, Hgb, the leukocyte differential, or other indices between groups
For all hematologic indices, the proportions of low and not low parameters for each DICER1 carrier and control are listed in Table 2. Not low was defined as those values in the normal or high range. Scatter plots of RBC number, WBC count, and absolute neutrophil count (ANC) against age are shown in Figures 1-3. These clinically common indices were selected to visually demonstrate the overlap between DICER1 carriers and controls. Additional scatter plots for other hematologic indices are shown in supplemental Figures 1-27. We repeated the analysis and excluded those individuals who had received either chemotherapy or radiation within 2 years of their visit to the NIH Clinical Center (Table 3). There were statistically significant differences in WBCs but no differences in the ferritin or reticulocyte Hgb count. Frank red cell or platelet cell cytopenias described in murine DICER1 models were not observed in our cohort. The hematologic indices were broken down as proportions of DICER1 carriers into low, normal, and high parameters (see supplemental Tables 1 and 3). Comparisons of the medians and ranges are presented in supplemental Tables 2 and 4.
Laboratory values in DICER1 carriers and controls with statistical comparison between the 2 groups
| Laboratory tests | Controls (n = 64) | DICER1 carriers (n = 121) | P | ||||||
|---|---|---|---|---|---|---|---|---|---|
| Low | Not low | Low | Not low | ||||||
| No. | % | No. | % | No. | % | No. | % | ||
| Blood count indices | |||||||||
| WBCs | 2 | 3 | 61 | 97 | 16 | 13 | 104 | 87 | .028* |
| RBCs | 8 | 13 | 55 | 87 | 7 | 6 | 113 | 94 | .108* |
| Hgb | 6 | 10 | 57 | 90 | 9 | 8 | 111 | 92 | .635* |
| Hematocrit | 3 | 5 | 62 | 95 | 5 | 4 | 115 | 96 | 1 |
| MCV | 1 | 2 | 62 | 98 | 2 | 2 | 118 | 98 | 1 |
| MCH | 1 | 2 | 62 | 98 | 1 | 1 | 119 | 99 | 1 |
| MCHC | 5 | 8 | 58 | 92 | 8 | 7 | 112 | 93 | .768 |
| RDW | 2 | 3 | 61 | 97 | 1 | 1 | 119 | 99 | .273 |
| Platelet count | 5 | 8 | 58 | 92 | 9 | 8 | 110 | 92 | 1 |
| MPV | 4 | 6 | 58 | 94 | 16 | 13 | 103 | 87 | .154* |
| Nucleated RBCs | 0 | 0 | 60 | 100 | 0 | 0 | 112 | 100 | NA |
| Absolute nucleated RBCs | 0 | 0 | 60 | 100 | 0 | 0 | 112 | 100 | NA |
| Reticulocytes | 2 | 3 | 61 | 96 | 3 | 3 | 117 | 98 | 1 |
| Absolute reticulocytes | 1 | 2 | 62 | 98 | 3 | 3 | 117 | 98 | 1 |
| Reticulocyte Hgb | 1 | 2 | 62 | 98 | 7 | 7 | 113 | 94 | .266 |
| Immature platelet fraction | 2 | 3 | 61 | 97 | 6 | 5 | 112 | 95 | .716 |
| Immature reticulocyte fraction | 4 | 11 | 31 | 89 | 1 | 2 | 67 | 99 | .044 |
| Differentials | |||||||||
| Absolute neutrophil count | 1 | 2 | 62 | 98 | 10 | 8 | 110 | 92 | .101 |
| Absolute immature granulocytes | 0 | 0 | 51 | 100 | 0 | 0 | 89 | 100 | NA |
| Absolute lymphocytes | 3 | 5 | 60 | 95 | 8 | 7 | 112 | 93 | .751 |
| Absolute monocytes | 2 | 3 | 61 | 97 | 5 | 4 | 115 | 96 | 1 |
| Absolute eosinophils | 0 | 0 | 63 | 100 | 7 | 6 | 113 | 94 | .097 |
| Absolute basophils | 3 | 5 | 60 | 95 | 7 | 6 | 113 | 94 | 1 |
| Iron indices | |||||||||
| Iron | 2 | 14 | 12 | 86 | 3 | 10 | 26 | 90 | 1 |
| Transferrin | 0 | 0 | 14 | 100 | 0 | 0 | 29 | 100 | NA |
| Iron saturation | 4 | 29 | 10 | 71 | 11 | 38 | 18 | 62 | .735 |
| Ferritin | 6 | 10 | 57 | 90 | 26 | 22 | 94 | 78 | .040* |
| Other indices | |||||||||
| Erythrocyte sedimentation rate | 0 | 0 | 42 | 100 | 0 | 0 | 76 | 100 | NA |
| Fetal Hgb | 0 | 0 | 52 | 100 | 0 | 0 | 101 | 100 | NA |
| Erythropoietin | 0 | 0 | 56 | 100 | 0 | 0 | 104 | 100 | NA |
| Lactate dehydrogenase | 0 | 0 | 61 | 100 | 3 | 3 | 114 | 97 | .552 |
Percentages may not sum to 100% due to rounding. P values < .05 are shown in bold.
MCH, mean corpuscular Hgb; MCHC, mean corpuscular Hgb concentration; MCV, mean corpuscular volume; MPV, mean platelet volume; NA, not applicable; RDW, red blood cell distribution width.
Indicates χ2 test instead of Fisher’s exact test.
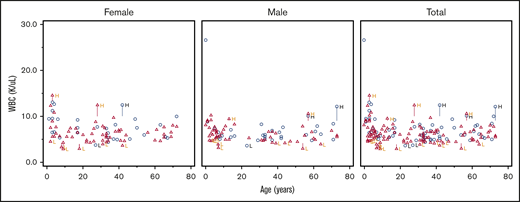
Scatter plot comparing WBC number in DICER1 carriers and controls in total and stratified by sex. Red triangles represent DICER1 carriers; blue circles represent controls. H, high; L, low. Vertical line associated with H or L is drawn from the upper limit or the lower limit, respectively, of that individual’s normal range.
Scatter plot comparing WBC number in DICER1 carriers and controls in total and stratified by sex. Red triangles represent DICER1 carriers; blue circles represent controls. H, high; L, low. Vertical line associated with H or L is drawn from the upper limit or the lower limit, respectively, of that individual’s normal range.
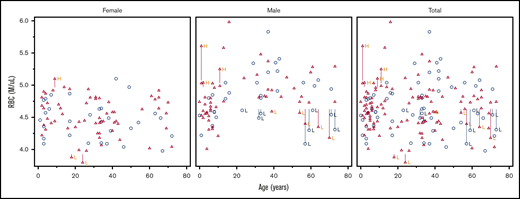
Scatter plot comparing RBC number in DICER1 carriers and controls in total and stratified by sex. Red triangles represent DICER1 carriers; blue circles represent controls. H, high; L, low. Vertical line associated with H or L is drawn from the upper limit or the lower limit, respectively, of that individual’s normal range.
Scatter plot comparing RBC number in DICER1 carriers and controls in total and stratified by sex. Red triangles represent DICER1 carriers; blue circles represent controls. H, high; L, low. Vertical line associated with H or L is drawn from the upper limit or the lower limit, respectively, of that individual’s normal range.
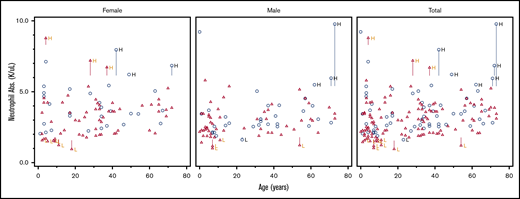
Scatter plot comparing ANC in DICER1 carriers and controls in total and stratified by sex. Red triangles represent DICER1 carriers; blue circles represent controls. H, high; L, low. Vertical line associated with H or L is drawn from the upper limit or the lower limit, respectively, of that individual’s normal range.
Scatter plot comparing ANC in DICER1 carriers and controls in total and stratified by sex. Red triangles represent DICER1 carriers; blue circles represent controls. H, high; L, low. Vertical line associated with H or L is drawn from the upper limit or the lower limit, respectively, of that individual’s normal range.
Hematologic parameters in DICER1 carriers and controls excluding those receiving chemotherapy or radiation within 2 years of evaluation
| Parameter | Controls (n = 64) | DICER1 carriers (n = 114) | P | ||||||
|---|---|---|---|---|---|---|---|---|---|
| Low | Not low | Low | Not low | ||||||
| No. | % | No. | % | No. | % | No. | % | ||
| Blood count indices | |||||||||
| WBCs | 2 | 3.2 | 61 | 96.8 | 14 | 12.3 | 100 | 87.7 | .043* |
| RBCs | 8 | 12.7 | 55 | 87.3 | 7 | 6.1 | 107 | 93.9 | .134* |
| Hgb | 6 | 9.5 | 57 | 90.5 | 8 | 7 | 106 | 93 | .57 |
| Hematocrit | 3 | 4.8 | 60 | 95.2 | 5 | 4.4 | 109 | 95.6 | 1 |
| MCV | 1 | 1.6 | 62 | 98.4 | 1 | 0.9 | 113 | 99.1 | 1 |
| MCH | 1 | 1.6 | 62 | 98.4 | 0 | 0 | 114 | 100 | .356 |
| MCHC | 5 | 7.9 | 58 | 92.1 | 6 | 5.3 | 108 | 94.7 | .524 |
| RDW | 2 | 3.2 | 61 | 96.8 | 1 | 0.9 | 113 | 99.1 | .289 |
| Platelet count | 5 | 7.9 | 58 | 92.1 | 8 | 7.1 | 105 | 92.9 | 1 |
| MPV | 4 | 6.5 | 58 | 93.5 | 14 | 12.4 | 99 | 87.6 | .216* |
| Nucleated RBCs | 0 | 0 | 60 | 100 | 0 | 0 | 107 | 100 | NA |
| Absolute nucleated RBCs | 1 | 1.6 | 62 | 98.4 | 10 | 8.8 | 104 | 91.2 | 1 |
| Reticulocytes | 2 | 3.2 | 61 | 96.8 | 3 | 2.6 | 111 | 97.4 | 1 |
| Absolute reticulocyte count | 1 | 1.6 | 62 | 98.4 | 3 | 2.6 | 111 | 97.4 | 1 |
| Reticulocyte Hgb | 1 | 1.6 | 62 | 98.4 | 4 | 3.5 | 110 | 96.5 | .657 |
| Immature platelet fraction | 2 | 3.2 | 61 | 96.8 | 4 | 3.6 | 108 | 96.4 | 1 |
| Immature reticulocyte fraction | 4 | 11.4 | 31 | 88.6 | 1 | 1.6 | 63 | 98.4 | .051 |
| Differentials | |||||||||
| Absolute neutrophil count | 1 | 1.6 | 62 | 98.4 | 10 | 8.8 | 104 | 91.2 | 1 |
| Absolute immature granulocytes | 0 | 0 | 51 | 100 | 0 | 0 | 88 | 100 | NA |
| Absolute lymphocytes | 3 | 4.8 | 60 | 95.2 | 8 | 7 | 106 | 93 | .749 |
| Absolute monocytes | 2 | 3.2 | 61 | 96.8 | 3 | 2.6 | 111 | 97.4 | 1 |
| Absolute eosinophils | 0 | 0 | 63 | 100 | 6 | 5.3 | 108 | 94.7 | .09 |
| Absolute basophil count | 3 | 4.8 | 60 | 95.2 | 7 | 6.1 | 107 | 93.9 | 1 |
| Iron indices | |||||||||
| Iron | 2 | 14.3 | 12 | 85.7 | 3 | 10.3 | 26 | 89.7 | 1 |
| Transferrin | 0 | 0 | 14 | 100 | 0 | 0 | 29 | 100 | NA |
| Iron saturation | 4 | 28.6 | 10 | 71.4 | 11 | 37.9 | 18 | 62.1 | .735 |
| Ferritin | 6 | 9.5 | 57 | 90.5 | 23 | 20.2 | 91 | 79.8 | .067* |
| Other indices | |||||||||
| Erythrocyte sedimentation rate | 0 | 0 | 42 | 100 | 0 | 0 | 76 | 100 | NA |
| Fetal Hgb | 0 | 0 | 52 | 100 | 0 | 0 | 101 | 100 | NA |
| Erythropoietin | 0 | 0 | 56 | 100 | 0 | 0 | 104 | 100 | NA |
| Lactate dehydrogenase | 0 | 0 | 61 | 100 | 3 | 2.7 | 108 | 97.3 | .533 |
Data excludes those individuals who received chemotherapy and/or radiation ≤2 years before their visit to the NIH Clinical Center. Percentages may not sum to 100% due to rounding. P values <.05 are shown in bold.
Designates χ2 instead of Fisher’s exact test.
There were no significant differences between groups in the distribution of either RBCs (P = .10) or Hgb (P = .87). Post hoc stratification by age and sex did not identify any differences in the proportion with abnormal values of Hgb (supplemental Table 5). Regarding WBC values among DICER1 carriers, 13% were low and 87% were normal or high compared with controls who had 3% low and 97% normal or high values (P = .028). Despite the difference in the WBC count, none of the absolute differential values demonstrated any significant difference. With the removal of patients who had received chemotherapy and/or radiation within 2 years of their laboratory blood draw, 12% of the DICER1 carriers had a low WBC count compared with 3% in the control group (P = .043). There were no associated differences in absolute differential values. Ferritin was low in 22% of the DICER1 carriers and normal or high in 78%; for controls, it was low in 10% and normal or high in 90% (P = .04). The immature reticulocyte fraction was low in 1% of the DICER1 carriers and normal or high in 99% compared with low in 11% and normal or high in 89% in the control group (P = .026).
Frequency of hematologic malignancies or MDS
Review of participants’ medical history and longitudinal follow-up questionnaires yielded no reported diagnoses of hematologic malignancies or MDS in any DICER1 carrier in the NIH Clinical Center (n = 145) or field cohorts (n = 108). In the International Pleuropulmonary Blastoma/DICER1 Registry (n = 595), there was 1 individual who was initially diagnosed with PPB type III and treated with cisplatin, etoposide, cyclophosphamide, vincristine, and doxorubicin who subsequently developed MLL 11q23-rearranged B-cell acute lymphoblastic leukemia (B-ALL) 11 months after completing PPB therapy.
Discussion
We observed no significant differences in RBC, Hgb, or absolute leukocyte differentials in a large cohort of pediatric and adult DICER1 carriers compared with family controls. The distributions of WBCs, ferritin, and reticulocyte Hgb differed statistically between these groups, although these were not adjusted for multiple comparisons. Moreover, on review of data from the NCI DICER1 Natural History Study and the International Pleuropulmonary Blastoma/DICER1 Registry, only 1 case of ALL was reported in a patient with a history of type III PPB who received chemotherapy. Our data do not suggest that the cytopenias and myelodysplasias demonstrated in murine models translate to meaningfully increased risk among humans with germline DICER1 variation.
DICER1 carriers consistently demonstrated lower WBC counts compared with controls, even with the removal of those individuals who had recently received chemotherapy and/or radiation. However, the absolute differential counts remained statistically insignificant between patients and controls. Review of the ANC in the DICER1 carriers who had a WBC count of <4.5 × 10³ cells per μL revealed that all individuals had both an ANC and absolute lymphocyte count >1000 × 103 cells per μL. One DICER1 carrier had an ANC of 1000 × 103 cells per μL and another DICER1 carrier had an ANC <1500 × 103 cells per μL, both of whom had previously received chemotherapy for treatment of PPB. There was statistical significance when the WBCs of DICER1 carriers were compared with those of controls, but this was unlikely to be clinically significant upon further investigation.
An additional query for potential confounding by individuals with benign ethnic neutropenia was performed. One African American DICER1 carrier had an ANC of 900 × 103 cells per μL (without leukopenia) at the time of NIH Clinical Center visit. There was no follow-up information available for this patient. Data for this single patient are unlikely to skew the results discussed above.
Interestingly, miRNA inhibition seems to play a role in iron homeostasis in murine models.11 Inhibition of miRNA-122 resulted in increased messenger RNA production of hepcidin activators HFE and HJV.11 Increasing hepcidin would result in decreased iron absorption and thus decreased ferritin. Moreover, a recent publication regarding 2 DICER1 carriers with mesenchymal hamartomas demonstrated decreased miRNA-122, an miRNA that plays a critical role in iron homeostasis.12 This could be why we observed that DICER1 carriers had lower ferritin levels than controls. Alternatively, this difference could represent the lack of iron storage reconstitution after chemotherapy or radiation treatment because the statistical difference in the ferritin that was observed during evaluation of the whole cohort was corrected when those who had previously received treatment were removed from the analyses.
Review of the literature uncovered an article13 that described 6 individuals with germline DICER1 variants who developed acute leukemia. The authors of that article determined that none of the 6 variants were pathogenic.13 In addition to patients from The International Pleuropulmonary Blastoma/DICER1 Registry and additional patients mentioned above, there is also a report in the literature of a child who developed 11q23 MLL-rearranged acute myeloid leukemia (AML) 2 years after therapy for pneumoblastoma (an older term for PPB).14 It is likely but not documented that this individual also had a pathogenic germline DICER1 variant.
DICER1-associated tumors harbor somatic variants at specific DICER1 hotspot codons (E1705, D1709, G1809, D1810, and E1813) that result in RNaseIIIb enzymatic dysfunction.15-18 D1713 and R1725 may be additional hotspot codons.19,20 We queried cBioPortal (5136 total variants),21,22 The Cancer Genome Atlas (TCGA) (144 total variants; http://portal.gdc.cancer.gov), and the Catalogue of Somatic Mutations in Cancer (COSMIC)23 (1898 total variants) for somatic DICER1 variants in individuals with hematologic malignancies or MDS. This resulted in 21 somatic variants being identified in coding regions, 3 of which were found in DICER1 hotspots. All 3 variants were E1705K and were found in patients with chronic lymphocytic lymphoma (CLL). One of these individuals had an additional ATM Y2817* variant. This particular variant has not been reported in CLL, but other ATM variants have been implicated in CLL.24
We emphasize that our report investigates the consequences of a rare germline pathogenic variant in DICER1, as determined phenotypically through routine clinical hematology laboratory testing. However, our observations do not definitively conclude that DICER1 variants do not lead to abnormal hematopoiesis or dysplastic bone marrow.
Our study investigates the consequence of a germline DICER1 variant. Given the central role of DICER1 in the production of miRNA, it is plausible that somatic alteration of the gene contributes to leukemia and allied disorders. For example, DICER1 is reported to be differentially expressed in the mesenchymal stem cells of individuals (who are not known to harbor a rare pathogenic variant in DICER1) with MDS and AML, suggesting a role for the gene in the development of these disorders.25
Various murine models of DICER1 deficiency and depletion have developed cytopenias, dysplasia, hematopoietic stem cell apoptosis, and low Hgb4,5,9,26 ; however, we have no evidence to support that these abnormalities of hematologic indices are found in humans with a pathogenic DICER1 variant. Alemdehy and Erkeland9 observed a block in macrophage development and myeloid dysplasia (resulting in leukemia) in their DICER1 knockout murine models. Although we did not perform bone marrow sampling to directly observe the histopathologic myeloid maturation, a review of the peripheral myeloid cells (absolute neutrophil, basophil, and eosinophil counts) showed that they were not notably low and were not meaningfully different between DICER1 carriers and controls. DICER1-mutant osteoprogenitor mouse models in Raaijmakers et al26 resulted in reduced cell numbers of all leukocyte subsets, anemia, and thrombocytopenia, resulting in MDS and leukemia, although none of these findings were observed in this cohort of individuals with a pathogenic germline variant. Buza-Vidas et al4 observed that DICER1 was important for erythroid development, but we observed no signs of decrease in the number of RBCs or signs of bone marrow erythroid dysfunction (normal mean corpuscular volume and RBC distribution width).
Detailed review of the DICER1 carriers in the NCI DICER1 Natural History Study cohort and the International Pleuropulmonary Blastoma/DICER1 Registry resulted in the identification of 1 patient who developed ALL after chemotherapy treatment of PPB. Etoposide has a significant dose-dependent risk of secondary malignancy. Approximately 2% to 12% of individuals who receive etoposide develop a secondary AML; the incidence of secondary ALL after etoposide has not been well established.27,28 The proximity of ALL development to the PPB treatment and the MLL gene rearrangement 11q23 both support that this ALL was related to previous exposure to chemotherapy.27
One limitation of this study was that normative standards varied for sex and age over the years of collection. We condensed continuous values into categories (low or not low and also into low, normal, and high) relative to these standards to reflect differences in indices that might be identified as abnormal in routine laboratory tests. This allowed for comparisons across sex and age, but over time, it precluded identification of marginal differences in indices. We also acknowledge that ascertainment and survival bias are potential concerns. Our analysis is conservative and should not be taken as evidence for the absence of smaller, systematic variations in the parameters considered. The average age of our DICER1 carriers is younger than the average age at presentation of MDS, which typically occurs in older individuals. As a result, we may not have captured small or modestly increased risks that present at older ages.
We acknowledge that this study is not adequately powered to effectively rule out the risk of hematologic consequences of possessing a pathogenic germline DICER1 variant. Importantly, abnormalities in hematologic indices of individuals with a pathogenic germline DICER1 variant should not be automatically attributed to the DICER1 variant. Such abnormalities (eg, anemia) may be explained by more common processes such as nutritional deficiencies or the co-occurrence of a pathogenic variant in another relevant gene (eg, sickle cell disease or inherited bone marrow failure). Although a parsimonious explanation is often attractive, it is possible that some individuals may have more than 1 rare condition. For these reasons, when presented with a child or adult with a pathogenic germline variant in DICER1 and a hematologic abnormality, it is important to perform a complete hematologic evaluation and refer any patients to an adult or pediatric hematologist as necessary.
For original data, please contact Douglas R. Stewart at drstewart@mail.nih.gov.
Acknowledgments
This work was supported by a grant from the Intramural Research Program of the Division of Cancer Epidemiology and Genetics of the National Cancer Institute, National Institutes of Health. The International Pleuropulmonary Blastoma/DICER1 Registry is supported by Pine Tree Apple Classic Fund and Children’s Minnesota Foundation (1R01CA244940-01/5R37CA244940-02 and 1R01CA143167-01) from the National Institutes of Health, National Cancer Institute.
The content of this publication does not necessarily reflect the official views or policies of the Department of Health and Human Services, Department of the Army, Department of the Navy, Department of the Air Force, or Department of Defense, nor does mention of trade names, commercial products, or organizations imply endorsement by the US government.
Authorship
Contributions: L.M.V. helped perform the formal analysis and wrote the manuscript; N.E.K. helped perform the formal analysis and created the figures; C.P.H., L.A.H., A.G.C., and A.K.H. curated the data, determined the methodology, and administered the project; K.A.P.S., M.L.M., and D.R.S. conceptualized and supervised the study, provided visualization, validation, and mentorship, and reviewed and edited the manuscript; and all authors reviewed the manuscript and provided revisions and edits.
Conflict-of-interest disclosure: D.R.S. provided contract clinical telegenetics services to Genome Medical Inc. in accordance with relevant NCI ethics policies. The remaining authors declare no competing financial interests.
The current affiliation for N.E.K. is Children’s Hospital of Los Angeles, Los Angeles, CA.
Correspondence: Douglas R. Stewart, Clinical Genetics Branch, Division of Cancer Epidemiology and Genetics, National Cancer Institute, 9609 Medical Center Dr, Room 6E450, Rockville, MD 20850; e-mail: drstewart@mail.nih.gov.

