

Key Points
Erythropoietic activities of C57BL/6 mouse liver, spleen, bone marrow as well as red cell parameters undergo dynamic changes after birth.
Characterizing dynamic developmental erythropoietic changes is critical for understanding normal and disordered murine erythropoiesis.

Abstract
Liver, spleen, and bone marrow are 3 key erythropoietic tissues in mammals. In the mouse, the liver is the predominant site of erythropoiesis during fetal development, the spleen responds to stress erythropoiesis, and the bone marrow is involved in maintaining homeostatic erythropoiesis in adults. However, the dynamic changes and respective contributions of the erythropoietic activity of these tissues from birth to adulthood are incompletely defined. Using C57BL/6 mice, we systematically examined the age-dependent changes in liver, spleen, and bone marrow erythropoiesis following birth. In addition to bone marrow, the liver and spleen of newborn mice sustain an active erythropoietic activity that is gradually lost during first few weeks of life. While the erythropoietic activity of the liver is lost 1 week after birth, that of the spleen is maintained for 7 weeks until the erythropoietic activity of the bone marrow is sufficient to sustain steady-state adult erythropoiesis. Measurement of the red cell parameters demonstrates that these postnatal dynamic changes are reflected by varying indices of circulating red cells. While the red cell numbers, hemoglobin concentration, and hematocrit progressively increase after birth and reach steady-state levels by week 7, reticulocyte counts decrease during this time period. Mean cell volume and mean cell hemoglobin progressively decrease and reach steady state by week 3. Our findings provide comprehensive insights into developmental changes of murine erythropoiesis postnatally and have significant implications for the appropriate interpretation of findings from the variety of murine models used in the study of normal and disordered erythropoiesis.
Introduction
Erythropoiesis is the process by which red blood cells (RBCs) are produced. During the life span of mice and humans, specific anatomical sites, including the yolk sac, liver, spleen, and bone marrow, differently contribute to erythropoiesis.1 Developmental erythropoiesis has been extensively studied using mouse models, and it is well established that dramatic changes in erythropoiesis occur during fetal development.2-4 These changes include the transition from primitive erythropoiesis to definitive erythropoiesis as well as the shifts in the sites of erythropoietic activity. In the mouse, primitive erythropoiesis is first observed in the yolk sac from embryonic day 7.5 (E7.5) to E8.5. Definitive erythropoiesis also emerges in the yolk sac at E8.5 and then shifts to the fetal liver before transitioning to the spleen and bone marrow at E17.5.4-6
Similar to fetal development, as mice grow to adulthood and reach steady-state body weight between 8 to 10 weeks, a great expansion in blood volume and red cell mass occurs. Consequently, there is a marked demand for red cell production during this rapid growth period. However, in marked contrast to the extensive studies on changes in erythropoiesis during fetal development, much less is understood about the precise timing and contribution of each site of erythropoiesis to the postnatal erythropoiesis. While morphologic analyses suggested splenic erythropoietic activity 2 days after birth,7 it is unclear how long this activity persists. As such, it is not clear at what time during murine development steady-state erythropoiesis in the bone marrow is established. Another related aspect pertains to the changes in red cell parameters, as erythropoietic activity migrates among different erythropoietic tissues. Understanding these issues not only is of biological interest but also has significant implications by establishing the baseline for normal murine erythropoiesis and as such in interpreting the data obtained using numerous murine models of red cell disorders.
In the present study, we have undertaken a systematic and comprehensive analysis of the erythropoietic activity of the liver, spleen, and bone marrow and measured the red cell parameters of C57BL/6 mice from postnatal day 1 (P1) to week 12. We focused on the inbred strain C57BL/6, as various models of red cell disorders have been backcrossed into this inbred strain.8-11 Our findings demonstrate the dynamic nature of erythropoietic organs and red cell parameters after birth. We document marked dynamic changes in murine erythropoiesis during the first 7 weeks of life while homeostatic steady-state erythropoiesis is established in the bone marrow after this period.
Materials and methods
Mice
C57BL/6 mice were purchased from Jackson Laboratory. All mice were bred and housed in the Lindsley F. Kimball Research Institute Animal Facility under Association for Assessment and Accreditation of Laboratory Animal Care International guidelines. The experimental protocols were approved by the Institutional Animal Care and Use Committee.
Antibodies
For flow cytometry, the antibodies used were purified rat anti-mouse CD16/CD32 Fc block, fluorescein isothiocyanate–conjugated anti-Ter119, allophycocyanin (APC) –conjugated anti-CD44, APC-cyTM7–conjugated rat anti-mouse CD11b, and APC-cyTM7–conjugated rat anti-mouse CD45 (BD Biosciences); APC-cyTM7–conjugated rat anti-mouse Ly-6G and Ly-6C and 7AAD (BD Pharmingen); and CD45 beads (Miltenyi Biotec). For immunohistochemistry, the secondary antibody used was Envision+ System–labeled polymer horseradish peroxidase anti-rabbit (Dako North America). All other reagents used for immunohistochemistry were from Dako North America.
Preparation of single-cell suspension of liver, spleen, and bone marrow
To obtain a single-cell suspension of liver or spleen, the whole organ was placed into a 701/4-μm cell strainer, and tissue was smashed through the cell strainer with a syringe plunger into a 50-mL tube. The cell strainer was rinsed with 2 mL cold phosphate-buffered saline (PBS) supplemented with 0.5% (wt/vol) bovine serum albumin (BSA) and 2 mM EDTA. For bone marrow single-cell suspension preparation, cells from mice tibia and femur were flushed with PBS 0.5% BSA 2 mM EDTA, and the cell suspension was gently passed through a 27G needle 3 or 4 times. Cell number was determined using a hematocytometer.
Cell staining and flow cytometric analysis
Cells were suspended in PBS 0.5% BSA buffer at a concentration of 106/80 μL and incubated with rat anti-mouse CD16/CD32 for 15 minutes on ice. Samples were subsequently stained with a cocktail of fluorescein isothiocyanate–conjugated Ter119, APC-conjugated CD44, APC-cyTM7–conjugated CD11b, APC-cyTM7–conjugated CD45, and APC-cyTM7–conjugated Ly-6G and Ly-6C in PBS 0.5% BSA for 15 minutes at room temperature. Cells were subsequently washed twice and resuspended in PBS 0.5% BSA and stained with the viability marker 7AAD. Flow cytometry analysis was performed using a FACSCanto flow cytometer (Becton Dickinson), and data were analyzed with the BD FACSDiva software package. Unstained cells were used as negative control.
The overall gating strategy is presented in supplemental Figure 1. Once the percentage of erythroblasts was obtained for each tissue, the absolute number of erythroblasts was determined.
Immunohistochemistry
Spleen sections were fixed with 10% (vol/vol) formalin, and 4-μm-thick paraffin-embedded tissue sections were cut and dewaxed in xylene and rehydrated in descending concentrations of ethanol. Endogenous peroxidase activity was quenched with peroxidase blocking reagent for 6 minutes. Sections were incubated overnight at 4°C with an anti-Ter119 antibody. After thorough washing with PBS, the sections were treated with horseradish peroxidase–conjugated secondary antibody for 1 hour at room temperature and developed with the liquid diaminobenzidine substrate chromogen system (Dakocytomation). The images were acquired with a Leica DM 2000 microscope (Leica Microsystems).
Measurement of serum EPO concentration
Mouse blood was collected every other day from P1 to P19 and then every week from weeks 3 to 12. Mouse blood samples were allowed to clot for 2 hours at room temperature before centrifuging for 20 minutes at 2,000g. The serum was stored −20°C. Serum erythropoietin (EPO) concentration was measured by commercial Quantikine ELISA kit from R&D Systems according to the manufacturer’s instructions.
Induction of acute anemia
Anemia was induced in 3-month-old mice by bleeding according to the protocol previously described by Liu et al,12 with slight modifications. On days 1 and 3, animals were injected intraperitoneally with 2 mL normal saline, followed by removal of ∼700 μL blood by retro-orbital puncture. With the use of this protocol, reticulocyte percentages reached 25% to 30% by day 5. Blood was collected on day 5 with EDTA-treated microcapillary tubes to measure red cell parameters.
Measurement of red cell parameters by ADVIA
To measure red cell parameters, blood was collected with an EDTA-treated microcapillary tube to prevent clot formation. Samples were analyzed using Siemens ADVIA 120 hematology system and the instrument routinely calibrated using normal blood, low-retic, and high-retic samples provided by Siemens as control. Hematocrit was calculated as the product of RBCs and mean cell volume (MCV). No lipemia or hemolysis in the samples affected the measurements.
Statistical analyses
All data are reported as mean ± standard error of the mean (SEM). A total of 4 to 13 C57BL/6 mice were used to isolate the various tissues for each experiment. The same mouse was used to isolate all tissues. When appropriate, statistically significant differences were determined using GraphPad Prism 8 software for analysis of variance (ANOVA) with Dunnett’s post hoc test with corrections for multiple comparisons or unpaired Student t test with Welch’s correction. A P value < .05 was considered as statistically significant.
Results
The liver maintains its erythropoietic activity for up to 9 days after birth
While numerous studies have documented the liver being the predominant erythropoietic organ during the final stages of fetal development and the bone marrow becoming the major site for erythropoiesis in adult mice, the precise time course of the postnatal transition has not been systematically examined. We addressed this question using the flow cytometry–based analysis that we developed13,14 to examine the erythropoietic activity in the newborn liver from P1 to P14 in C57BL/6 mice (an overview of the gating strategy is presented in supplemental Figure 1). Erythropoietic activity is defined by the presence of erythroid precursors at distinct differentiating stages. CD44hi nucleated erythroblasts represented a major cellular component on day 1, progressively decreased starting at day 3, and were no longer apparent from day 9 onward (Figure 1A). By day 9 after birth, we only observed CD44lo forward scatter (FSC)lo cells in the liver, corresponding to enucleated reticulocytes and red cells.13,14 Quantification of total liver erythroblasts defined as Ter119+ CD44hi revealed that the numbers of erythroblasts in the liver decreased from 15 million on day 1 to an undetectable level by day 9 (Figure 1B). We also quantified total liver cells. As shown in Figure 1C, no significant changes in total liver cells were noted from day 1 to day 9, demonstrating that the observed decrease in erythroblast cell number was not due to decrease in total liver cells. Indeed, the liver weight increased from 0.05 g on day 1 to 0.3 g on day 14 (Figure 1D).
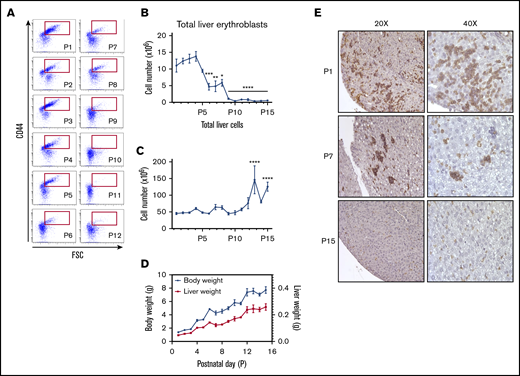
Dynamic changes in erythropoietic activity in the C57BL/6 mouse liver after birth. (A) Terminal erythroid differentiation in the liver for the first 12 days after birth (P1 to P12) was measured by flow cytometry using CD44 vs FSC as markers. (B) The total number of erythroblasts in the liver from P1 to P15 was determined by flow cytometry using Ter119+ CD44hi populations of erythroid cells (red gate is shown in panel A). (C) Absolute number of liver cells from P1 to P15. (D) Evolution of the mouse body weight (blue solid lines) vs liver weight (red solid line) from P1 to P15. (E) Erythropoietic activity in the liver was determined by immunohistochemistry using Ter119 staining at the indicated days (left panels, original magnification ×20; right panels, original magnification ×40). n = 4-13 animals per day; data are presented as mean ± SEM. *P < .05, **P < .01, ***P < .001, ***P < .0001, indicated postnatal day vs P1 (ANOVA with Tukey’s post hoc test with corrections for multiple comparisons).
Dynamic changes in erythropoietic activity in the C57BL/6 mouse liver after birth. (A) Terminal erythroid differentiation in the liver for the first 12 days after birth (P1 to P12) was measured by flow cytometry using CD44 vs FSC as markers. (B) The total number of erythroblasts in the liver from P1 to P15 was determined by flow cytometry using Ter119+ CD44hi populations of erythroid cells (red gate is shown in panel A). (C) Absolute number of liver cells from P1 to P15. (D) Evolution of the mouse body weight (blue solid lines) vs liver weight (red solid line) from P1 to P15. (E) Erythropoietic activity in the liver was determined by immunohistochemistry using Ter119 staining at the indicated days (left panels, original magnification ×20; right panels, original magnification ×40). n = 4-13 animals per day; data are presented as mean ± SEM. *P < .05, **P < .01, ***P < .001, ***P < .0001, indicated postnatal day vs P1 (ANOVA with Tukey’s post hoc test with corrections for multiple comparisons).
To independently confirm an erythropoietic activity in the postpartum liver, we obtained liver sections and immunostained them with Ter119. Consistent with our flow cytometry data, abundant Ter119+ nucleated erythroblasts were observed in day 1 liver sections. By day 7, the number of these cells was markedly decreased, and no nucleated Ter119+ cells could be detected by day 15 (Figure 1E).
Transient erythropoietic activity in the spleen during the postnatal period
The spleen does not possess significant erythropoietic activity in adult mice but becomes an erythropoietic organ in response to stress. As the role of the spleen in producing red cells during early infancy has been suggested7 but not comprehensively characterized, we examined splenic erythropoiesis over the first 12 weeks postpartum in C57BL/6 mice. Abundant numbers of erythroblasts were observed in the spleen at week 1 and progressively decreased until week 7, after which time they were no longer detected (Figure 2A). A detailed analysis of splenic erythropoiesis revealed that by week 4, the number of proerythroblasts was markedly decreased, suggesting that committed erythroid progenitors (ie, burst-forming unit-erythroid and colony-forming unit-erythroid) had ceased to enter terminal erythroid differentiation in the spleen around that time. In further support of the decreased erythropoietic activity of the spleen during that period, we noted that the more differentiated stages of erythroblasts (basophilic, polychromatophilc, and orthochromatophilic) also progressively decreased over the subsequent 2 weeks. By 7 weeks after birth, only reticulocytes and RBCs could be detected by flow cytometry, consistent with the little contribution of spleen to steady-state erythropoiesis in adult C57BL/6 mice. Quantification of erythroblast numbers revealed that splenic erythroblasts progressively decreased from ∼40 million at week 1 to an undetectable level by week 7 (Figure 2B). This decrease in splenic erythroblasts was accompanied by an increase in the total number of splenocytes for up to 4 weeks (Figure 2C) as well as by an increase in spleen weight (Figure 2D), implying that the observed decrease in erythroblast numbers was not related to the change in spleen size.
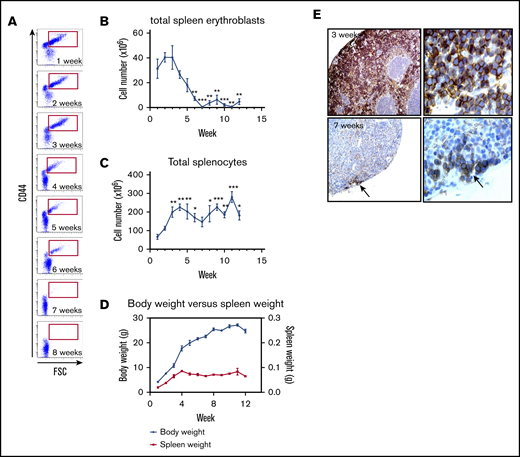
The spleen is a transient erythropoietic organ in the neonate C57BL/6 mouse. (A) Terminal erythroid differentiation in the spleen for the first 8 weeks after birth was measured by flow cytometry using CD44 vs FSC as markers. (B) The total number of erythroblasts in the spleen for the first 12 weeks was determined by flow cytometry using Ter119+ CD44hi populations of erythroid cells (red gate is shown in panel A). (C) Absolute number of splenocytes for the first 12 weeks. (D) Evolution of the mouse body weight (blue solid lines) vs spleen weight (red solid line) from week 1 to 12. (E) Erythropoietic activity in the spleen was determined by immunohistochemistry using Ter119 staining 3 weeks (upper panels) and 7 weeks (bottom panels) after birth (left panels, original magnification ×20; right panels, original magnification ×40). n = 4-13 animals per day; data are presented as mean ± SEM. *P < .05, **P < .01, ***P < .001, indicated week vs week 1 (ANOVA with Tukey’s post hoc test with corrections for multiple comparisons).
The spleen is a transient erythropoietic organ in the neonate C57BL/6 mouse. (A) Terminal erythroid differentiation in the spleen for the first 8 weeks after birth was measured by flow cytometry using CD44 vs FSC as markers. (B) The total number of erythroblasts in the spleen for the first 12 weeks was determined by flow cytometry using Ter119+ CD44hi populations of erythroid cells (red gate is shown in panel A). (C) Absolute number of splenocytes for the first 12 weeks. (D) Evolution of the mouse body weight (blue solid lines) vs spleen weight (red solid line) from week 1 to 12. (E) Erythropoietic activity in the spleen was determined by immunohistochemistry using Ter119 staining 3 weeks (upper panels) and 7 weeks (bottom panels) after birth (left panels, original magnification ×20; right panels, original magnification ×40). n = 4-13 animals per day; data are presented as mean ± SEM. *P < .05, **P < .01, ***P < .001, indicated week vs week 1 (ANOVA with Tukey’s post hoc test with corrections for multiple comparisons).
As an alternative method to determine changes in erythropoietic activity in the spleen postpartum, we examined splenic sections immunostained with Ter119. Consistent with the flow cytometric analyses, we observed a change in the splenic architecture with a decrease in the red pulp from 3 to 7 weeks along with a decrease in the numbers of nucleated Ter119+ cells (Figure 2E). By 7 weeks, only small clusters of nucleated Ter119+ cells were observed in the splenic subcapsular region (Figure 2E, lower panel).
Erythropoiesis reaches steady state in the bone marrow approximately 7 weeks after birth
To delineate in detail the timing of the onset and the extent of erythropoiesis in the bone marrow, we studied bone marrow erythropoiesis over the first 12 weeks postpartum in C57BL/6 mice. Abundant numbers of nucleated erythroblasts were present throughout the 12-week period (Figure 3A). Unexpectedly, there were much fewer nonnucleated red cells (reticulocytes and mature red cells) in the bone marrow during first 2 weeks. By week 4, the pattern of nonnucleated red cells and nucleated erythroblasts reached the steady-state pattern observed henceforth. Quantitative analysis revealed that nucleated erythroblasts increased progressively during the first 3 weeks (Figure 3B) and paralleled the increase in the total number of marrow cells (Figure 3C). Subsequently, the number of bone marrow cells plateaued while the number of nucleated erythroblasts appeared to decrease after week 3. We also measured the body weight and bone weight (1 tibia + 1 femur). Both the body weight and bone weight progressively increased during the first 12 weeks of life (Figure 3D). These findings suggest that the number of hematopoietic and accessory cells within the bone marrow remained constant after 3 weeks despite a continuing increase in bone weight.
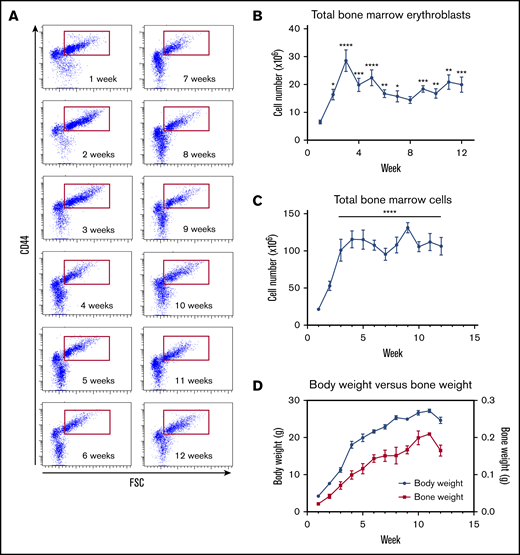
Steady-state erythropoiesis in the C57BL/6 mouse bone marrow is established within 7 weeks after birth. (A) Terminal erythroid differentiation in the bone marrow for the first 12 weeks after birth was measured by flow cytometry using CD44 vs FSC as markers. (B) The total number of erythroblasts in the bone marrow for the first 12 weeks was determined by flow cytometry using Ter119+ CD44hi populations of erythroid cells (red gate is shown in panel A). (C) Absolute number of bone marrow cells for the first 12 weeks. (D) Evolution of the mouse body weight (blue solid lines) vs bone marrow weight (red solid line) from week 1 to week 12. n = 4-13 animals per day using 1 femur and 1 tibia for each animal; data are presented as mean ± SEM. *P < .05, **P < .01, ***P < .001, ****P < .0001, indicated week vs week 1 (ANOVA with Tukey’s post hoc test with corrections for multiple comparisons).
Steady-state erythropoiesis in the C57BL/6 mouse bone marrow is established within 7 weeks after birth. (A) Terminal erythroid differentiation in the bone marrow for the first 12 weeks after birth was measured by flow cytometry using CD44 vs FSC as markers. (B) The total number of erythroblasts in the bone marrow for the first 12 weeks was determined by flow cytometry using Ter119+ CD44hi populations of erythroid cells (red gate is shown in panel A). (C) Absolute number of bone marrow cells for the first 12 weeks. (D) Evolution of the mouse body weight (blue solid lines) vs bone marrow weight (red solid line) from week 1 to week 12. n = 4-13 animals per day using 1 femur and 1 tibia for each animal; data are presented as mean ± SEM. *P < .05, **P < .01, ***P < .001, ****P < .0001, indicated week vs week 1 (ANOVA with Tukey’s post hoc test with corrections for multiple comparisons).
Changes in red cell parameters after birth
Having documented changes in the tissues involved in erythropoiesis during the first 3 postnatal months, we investigated changes in red cell parameters in C57BL/6 mice during the same time frame. The hemoglobin (8-10 g) and hematocrit (25% to 30%) remained constant during the first 3 weeks (Figure 4A-B). From weeks 3 to 7, both the hemoglobin and hematocrit increased progressively. By week 7, the hemoglobin had increased to 14 g and the hematocrit had increased to 45%. These results can be explained by changes in the RBC count and MCV during the first 7 weeks of life. Indeed, the RBC count progressively increased from 3 million/µL on day 1 to 9 million/µL by week 7, at which time it plateaued (Figure 4C). Meanwhile, the MCV progressively decreased from 90 fL on day 1 to 48 fL by week 3, at which time it plateaued (Figure 4D, blue line), as a result of the disappearance of the macrocytic red cells generated by fetal liver.15 This is also reflected by the decrease in the red cell distribution width (RDW) from 20% for the first 2 weeks to 15% by week 3 (Figure 4D, red line). In parallel with the decrease in the MCV, the mean cell hemoglobin content (MCH) also declined (Figure 4E), resulting in a constant cellular hemoglobin concentration mean (CHCM) (directly measured) value (Figure 4F). These data are consistent with the tight regulation of cellular hemoglobin concentration that occurs during development and erythroid differentiation.
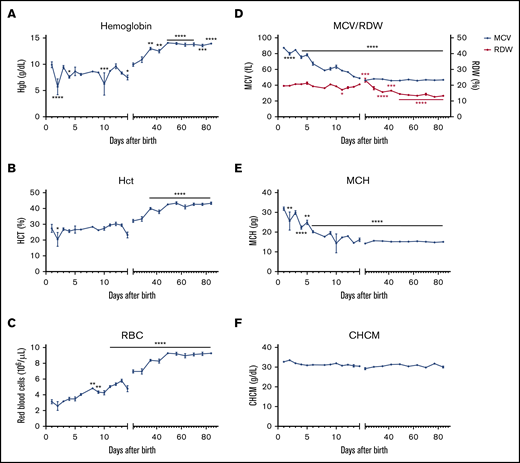
Red cell parameters in the circulation reflect the dynamic changes from the erythropoietic tissues. Red cell parameters were evaluated in C57BL/6 mice every day from P1 to P14 and then every week until 12 weeks of age using ADVIA 120. Hemoglobin (Hgb) (A), hematocrit (Hct) (B), RBCs (C), MCV (blue solid line) vs RDW (red solid line) (D), MCH (E), and measured mean cell hemoglobin concentration (CHCM) (F). n = 4-13 animals per day; data are presented as mean ± SEM. *P < .05, **P < .01, ***P < .001, ****P < .0001, indicated postnatal day vs P1 (ANOVA with Tukey’s post hoc test with corrections for multiple comparisons).
Red cell parameters in the circulation reflect the dynamic changes from the erythropoietic tissues. Red cell parameters were evaluated in C57BL/6 mice every day from P1 to P14 and then every week until 12 weeks of age using ADVIA 120. Hemoglobin (Hgb) (A), hematocrit (Hct) (B), RBCs (C), MCV (blue solid line) vs RDW (red solid line) (D), MCH (E), and measured mean cell hemoglobin concentration (CHCM) (F). n = 4-13 animals per day; data are presented as mean ± SEM. *P < .05, **P < .01, ***P < .001, ****P < .0001, indicated postnatal day vs P1 (ANOVA with Tukey’s post hoc test with corrections for multiple comparisons).
Changes in reticulocyte counts and EPO levels after birth
Since the reticulocyte count reflects the activity of erythropoietic tissues, we examined the changes in reticulocyte counts immediately after birth until 12 weeks of age in C57BL/6 mice. We observed that the reticulocyte count increased from ∼15% on day 1 to ∼30% on day 5 and henceforth progressively decreased to a plateau level of ∼3% by week 7 (Figure 5A). Serum EPO, the essential hormone for erythropoiesis, is maintained at low levels at steady state but increases significantly under hypoxic conditions.16 The combination of reticulocyte count and serum EPO levels reflects the degree of effective erythropoiesis and helps define causes of anemias. For instance, increased reticulocyte counts coupled with increased EPO levels represent a compensatory increase in red cell production in response to anemia. We measured the serum EPO levels during the first 12 weeks after birth and observed that the EPO levels increased from ∼200 pg/mL on day 1 to ∼500 pg/mL on day 5 in parallel with increase in reticulocyte count (Figure 5B). These levels continued to increase until day 14, when they peaked at a concentration of ∼1,300 pg/mL, which enabled sustained production of reticulocytes. In the subsequent 2 weeks, the EPO levels progressively decreased and reached the steady-state level (∼400 pg/mL) by week 4 in conjunction with sustained steady levels of circulating reticulocytes.
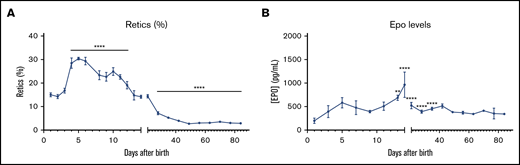
Dynamic changes in the reticulocyte count and EPO levels after birth. (A) Reticulocyte count was evaluated in C57BL/6 mice every day from P1 to P14 and then every week until 12 weeks of age using ADVIA 120. (B) EPO levels in the serum were measured every other day for the first 2 weeks and then every week until 12 weeks of age. n = 4-13 animals per day; data are presented as mean ± SEM. **P < .01, ****P < .0001, indicated postnatal day vs P1 (ANOVA with Tukey’s post hoc test with corrections for multiple comparisons).
Dynamic changes in the reticulocyte count and EPO levels after birth. (A) Reticulocyte count was evaluated in C57BL/6 mice every day from P1 to P14 and then every week until 12 weeks of age using ADVIA 120. (B) EPO levels in the serum were measured every other day for the first 2 weeks and then every week until 12 weeks of age. n = 4-13 animals per day; data are presented as mean ± SEM. **P < .01, ****P < .0001, indicated postnatal day vs P1 (ANOVA with Tukey’s post hoc test with corrections for multiple comparisons).
Red cell parameters in anemic adult mice
Red cell parameters following induction of acute anemia in adult 11-week-old C57BL/6 mice by phlebotomy are shown in Table 1. As a consequence of acute blood loss, a 50% decrease in hemoglobin (13.9 g/dL to 6.8 g/dL) and a 42% decrease in hematocrit (43.3% to 25.3%) were noted on day 5, in conjunction with an eightfold increase in reticulocytes (2.9% to 25.1%). At the same time, the MCV increased from 46.8 to 55.3 fL, the RDW increased from 13.3% to 26.4%, and the CHCM decreased from 30.1 g/dL to 26.9 g/dL. In marked contrast, there was little change in the MCH. These findings imply that the noted changes in MCV and CHCM are in large part the consequence of increased MCV and decreased CHMC of circulating reticulocytes and not the result of production of macrocytic red cells with increased cell hemoglobin content. The distribution of volume and hemoglobin content of reticulocytes and red cells, directly extracted from the ADVIA measurements, support these findings (supplemental Figure 2).17 Additionally, while there was little or no erythropoietic activity in the spleen of control mice, there was an increase in splenic erythropoiesis in the phlebotomized mice reflected by increased spleen weight, suggesting that under acute blood loss, there is a rapid reactivation of splenic erythropoiesis in adult mice, as observed in different models of anemia.11,18,19
Red cell parameters in adult anemic C57BL/6 mice
| Hgb, g/dL | HCT, % | RBCs, ×106/µL | MCV, fL | RDW, % | CHCM, g/dL | MCH, pg | Retics, % | |
|---|---|---|---|---|---|---|---|---|
| Control (11 wk) | 13.55 ± 0.49 | 42.65 ± 1.45 | 9.25 ± 0.43 | 46.20 ± 0.84 | 12.35 ± 0.78 | 31.65 ± 0.62 | 14.70 ± 0.22 | 2.77 ± 0.54 |
| Stress | 6.85 ± 0.32**** | 25.70 ± 1.28**** | 4.54 ± 0.19**** | 56.10 ± 1.09**** | 25.85 ± 2.05*** | 26.85 ± 0.13*** | 15.10 ± 0.10* | 24.16 ± 2.54*** |
Red cell parameters between adult control and age-matched anemic mice were evaluated using ADVIA 120. n = 4 11-week-old mice; data are presented as mean ± SEM. *P < .05, ***P < .001, and ****P < .0001, stress vs control (unpaired 2-tailed Student t test with Welch’s correction).
Discussion
In the present study, we have performed a comprehensive characterization of murine erythropoietic activity and cellular parameters of circulating red cells from birth to 12 weeks of age in C57BL/6 mice. We observed dynamic changes in erythropoietic activity in the various hematopoietic tissues, as well as changes in red cell parameters. These findings not only are of biological interest but also establish baselines for studying normal and disordered erythropoiesis during this time frame and appropriate interpretation erythropoiesis data obtained from numerous mouse models. It is interesting to note that the erythropoietic activity of the liver, which is the predominant organ for definitive erythropoiesis during fetal development, rapidly declines after birth. The finding that proerythroblasts were no longer detected on P2 suggests that commitment to the erythroid pathway in the liver ceases soon after birth. The more differentiated basophilic, polychromatic, and orthochromatic stage erythroblasts decreased over 10 days, at which time they were no longer observed. Although the molecular mechanisms responsible for sudden switching off of erythropoiesis in the liver is unclear, we infer that this cessation of hepatic erythropoietic activity during a period of increasing numbers of liver cells and increasing liver weight may be related to the numerous structural and functional changes necessitated in the livers of mature mice (eg, detoxification among others). However, it should be noted that in extreme cases of stress erythropoiesis, the adult liver can resume its erythropoietic activity.20,21
In contrast to the liver, the erythropoietic activity of the spleen persisted much longer. For the first 3 weeks, splenic erythropoiesis is fully active, as demonstrated by the presence of terminally differentiating erythroblasts at all developmental stages. However, at week 4, proerythroblast numbers begin to decrease, indicating the beginning of cessation of splenic erythropoiesis. Furthermore, the numbers of differentiated nucleated erythroblasts progressively decreased until they were no longer detectable at week 7. Given the fact that the spleen becomes the main erythropoietic organ in the mouse in response to anemia14,22-24 and is often used to study stress erythropoiesis in various mouse models, our findings have implications for interpretation of findings from these studies in terms of the age of the mice studied. The findings that the spleen possesses erythropoietic activity and that splenic erythropoiesis undergoes dynamic changes during the first 7 weeks strongly suggest that when studying the stress erythropoiesis of anemic mouse models, mice older than 7 weeks should be used, when possible. If this is not possible, then age-matched controls need to be used to fully appreciate the phenotype observed.
In the case of bone marrow erythropoietic activity, it expands rapidly during the first 3 weeks, followed by a decrease, and it reaches a plateau level between weeks 6 and 7. This finding, taken together with the finding that splenic erythropoiesis is detectable until week 6, implies that production of red cells by both spleen and bone marrow is required to meet the growing needs of newborn mice and that bone marrow erythropoiesis can meet the steady-state needs of red cell production by week 6 or 7.
It should be noted that while bone marrow erythropoiesis is able to sustain steady-state erythropoiesis in adult mice, it has very limited capacity to increase red cell production to meet increased demand.14 The spleen becomes the major site of erythropoiesis to meet increased demand for red cell production.25 This is confirmed from our findings of rapid splenic erythropoietic response following acute blood loss as well as marked splenomegaly seen in all murine models of hemolytic anemia.26 Murine spleen thus has the dual function of sequestering abnormal red cells and producing red cells to meet increasing demand.25,27 In this context, there are marked differences between murine and human erythropoiesis. While bone marrow erythropoiesis in humans can increase red cell production by >20-fold over steady-state production when the demand arises, bone marrow erythropoiesis in murine systems can at best double the steady-state production.14 While splenic erythropoiesis is a common feature of all murine models of hemolytic anemia, splenic erythropoiesis in humans is infrequent and rarely observed in disorders such as Cooley anemia, due to the use of all available bone marrow,28 or myelofibrosis, due to the loss of an effective bone marrow environment.29 Humans, however, can mobilize stress erythroid progenitor populations under severe stress conditions similar to the ones observed in mice.30 In contrast to mice, other mammals, including sheep and rabbits, like humans are able to substantially increase bone marrow erythropoiesis in response to erythropoietic stress with little contribution from the spleen.31,32 ACI inbred rats also respond to stress mainly through the bone marrow.33 However, other strains, such as Wistar, Long-Evans, and Sprague-Dawley, increase splenic erythropoiesis in response to stress, highlighting strain-specific differences.34-37 The fact that our study was conducted exclusively in the C57BL/6 inbred background is a limitation of the current study. While the physiology is mostly comparable between different strains of mice, some differences are noted due to variability in the genetic background.38-41 We focused on C57BL/6 due to its wide use in red cell biology, but this study will need to be adapted to the background (pure or mixed) as well as the genetically modified strain used.
Consistent with the establishment of steady-state erythropoiesis at week 6 or 7, the red cell counts, hemoglobin, and hematocrit all reached the steady levels at week 7. Analyses of changes in red cell parameters during the first 3 weeks reveal that while the red cell count progressively increases, hemoglobin and hematocrit are maintained at constant levels. This is due to the progressive decrease of MCV and MCH. Decreases in MCV reflect the progressive loss of macrocytic fetal red cells from circulation. High reticulocyte counts are important indicators of response to the needs of increased red cell production. Indeed, high reticulocyte counts are encountered at birth and during the rapid growth phase but reach lower steady-state levels at week 7, supporting the conclusion that steady-state murine erythropoiesis is established at week 7.
The noted changes in red cell parameters have implications for our understanding of differences between murine and human erythropoiesis. Red cells generated by fetal liver erythropoiesis have MCV and MCH very similar to that of human red cells while those generated by spleen and bone marrow are ∼50% of that of fetal red cells and remain stable during the entire life span of mice. Even under significant erythropoietic stress, the murine system fails to generate macrocytic red cells with increased MCH. The previously reported macrocytic anemia due to modest increases in MCV in various murine models of anemia such as Diamond-Blackfan anemia and others is not due to macrocytic red cells but is due to the confounding effect of increased MCV of reticulocytes.42,43 Thus, another important feature that distinguishes the murine system from humans and other mammals is that while mice can only generate normocytic red cells with normal cell hemoglobin content under erythropoietic stress, humans and other mammals can produce macrocytic red cells (increased MCV) with increased MCH.32,44,45 To our knowledge, the only true case of murine macrocytosis documented is in cyclin D3 knockout mice, in which red cells have markedly increased MCV in association with a proportional increase in MCH.46 These findings imply that increased MCH, but not increased MCV, is a truer reflection of macrocytic red cells.
In summary, the detailed systematic characterization of dynamic developmental changes in erythropoietic activities and red cell parameters in the murine system has enabled us to develop a strong foundational data set for improved understanding of normal and disordered murine erythropoiesis and provides furthers insight into the similarities and differences between murine and human erythropoiesis.
Send data sharing requests via e-mail to the corresponding author, Narla Mohandas (mnarla@nybc.org).
Acknowledgments
The graphical abstract was created with BioRender.
This work was supported in part by the National Institutes of Health, National Institure of Diabetes and Digestive and Kidney Diseases (grant DK32094) (N.M.) and National Heart, Lung, and Blood Institute (grants HL144436 and HL152099) (L.B.).
Authorship
Contribution: N.M. and X.A. designed the study; L.C., J.W., J.L., and H.W. performed the study; X.A, N.M., C.D.H., and L.B. analyzed and interpreted the data; X.A., L.B., and N.M. cowrote the manuscript; C.D.H. edited the manuscript; and all authors read and approved the final version of the manuscript.
Conflict-of-interest disclosure: The authors declare no competing financial interests.
Correspondence: Narla Mohandas, New York Blood Center, Red Cell Physiology Laboratory, 310 East 67th St, New York, NY 10065; e-mail: mnarla@nybc.org.

