

Key Point
Secondary AML-like gene mutations other than ASXL1 also identify a substantial subset of patients with intermediate-risk AML and a worse outcome.
In one-third of AML of the ELN 2017 intermediate-risk group, sAML-like mutations other than ASXL1 can be detected.

Abstract
In this study, we aimed to refine prognostication of older with acute myeloid leukemia (AML) after intensive chemotherapy. Five hundred and nine patients aged 60 years or older (median age, 68 years) were prospectively enrolled in the intensive Acute Leukemia French Association (ALFA)-1200 trial between 2012 and 2016, and 471 patient samples were submitted to multigene analysis. Mutations in any of 8 genes frequently altered in myelodysplastic syndromes (MDS), including ASXL1, SRSF2, STAG2, BCOR, U2AF1, EZH2, SF3B1, and ZRSR2, defined a secondary AML (sAML)-like disease, as reported. Of the samples analyzed, 48% included sAML-like gene mutations. These mutations were associated with a shorter event-free survival, both overall (hazard ratio, 1.46; 95% confidence interval, 1.19-1.79; P < .001) and within the European LeukemiaNet (ELN)-2017 intermediate-risk subgroup (hazard ratio, 1.52; 95% confidence interval, 1.01-2.28; P = .044), which excludes ASXL1-mutated cases by definition. We therefore included patients with intermediate-risk AML carrying sAML-like mutations in a single high-risk patients group together with adverse-risk patients with AML, whereas other intermediate-risk patients were included in a standard-risk group together with favorable-risk patients (high-risk/standard-risk patient ratio, 1.00). Using this 2-class risk assessment, we observed that transplantation prolonged overall survival from remission in patients with high-risk AML only, not in patients with standard-risk AML. Routine analysis of sAML-like gene mutations may thus improve the definition of high-risk older patients with AML, and better identify the half of older patients who clearly derive survival benefit from allogeneic transplantation in first remission. This trial was registered at www.clinicaltrials.gov as #NCT01966497.
Introduction
The outcome of older patients with AML after intensive chemotherapy (ICT) remains dismal.1,2 Apart from patient-related factors,3 prognosis is governed by age-related AML characteristics.4-8 These include an increased frequency of AML secondary to a prior myelodysplastic syndrome (MDS) and/or with adverse cytogenetics, categorized as AML with myelodysplasia-related changes (MRC) in the World Health Organization (WHO) classification.9 Using next-generation sequencing analyses of AML gene mutations, an extended definition of post–MDS-AML has been recently proposed, using an 8-gene classifier (ASXL1, SRSF2, STAG2, BCOR, U2AF1, EZH2, SF3B1, and ZRSR2) to define secondary AML (sAML)–like disease.10 This genetic tool could potentially enable a more precise prognostication of older AML.
In this prospective ALFA-1200 study (NCT01966497), fit patients with AML who were aged 60 years or older were offered a standard ICT and a risk-adapted strategy for allogeneic hematopoietic stem cell transplantation (HSCT). Our objective was twofold. First, because clinically defined sAML is well recognized as a still-relevant poor-prognosis factor, we aimed to analyze its value when using a broader definition based on newly defined genetic biomarkers, such as sAML-like gene mutations. Our goal was not to derive our own genetic risk classification, but to validate the added prognostic significance of sAML-like mutations in the context of existing European LeukemiaNet (ELN) risk classifications. Actually, only mutations of ASXL1, RUNX1, and TP53 genes have been incorporated in the adverse subgroup of the most recent ELN-2017 classification. Our expectation, validated by the present results, was that sAML-like gene mutations other than ASXL1 mutations might carry an as-poor prognostic significance. Second, because of the increasing use of reduced intensity conditioning allogeneic HSCT in older patients, we aimed to prospectively evaluate its role in a large enough cohort of patients recently homogeneously treated by intensive chemotherapy. Results presented here add new information to improve older AML risk classification and evaluation of HSCT outcomes.
Patients and Methods
Study population
Five hundred and nine patients were included between 2012 and 2016. Eligibility included previously untreated AML (except acute promyelocytic leukemia or AML evolving from myeloproliferative neoplasms), age 60 years or older, Eastern Cooperative Oncology Group performance status of 0 to 3, and no major organ dysfunction. Comorbidities were scored with the hematopoietic cell transplantation comorbidity index (HCT-CI), as defined.3 The study was approved by a National Review Board and conducted in accordance with the Declaration of Helsinki. All patients gave their informed consent.
Treatments
All patients received an induction course with idarubicin (12 mg/m2 per day on days 1-3) and cytarabine (200 mg/m2 per day as continuous infusion on days 1-7). Patients achieving complete remission (CR) or CR with incomplete platelet recovery (CRp) were eligible for 2 intermediate-dose cytarabine courses at 1.5 g/m2 per 12 hours as bolus infusion on days 1, 3, and 5 (reduced to 1 g/m2 per 12 hours for patients aged 70 years or older). Patients not achieving CR/CRp after the first course could receive the first intermediate-dose cytarabine course as a second induction. All patients in CR/CRp with intermediate- or adverse-risk AML according to the ELN-2010 classification11 were eligible for HSCT if they had a compatible sibling or a 9-10/10 HLA-matched unrelated donor. Standard National Cancer Institute criteria were used to define CR and CRp.12
AML genetics
Cytogenetic and genomic characteristics were centrally reviewed during the study. A standard Sanger polymerase chain reaction was used to detect CEBPA and NPM1 gene mutations, and fragment analysis was used to determine FLT3-ITD allelic ratios. Only biallelic CEBPA gene mutations were retained to classified cases as of favorable risk. At the end of the study, gene mutation patterns, including ASXL1, RUNX1, and TP53 mutational status, were retrospectively determined by next-generation sequencing in 471 (93%) of the 509 patients, using a 37-gene myeloid panel (detailed in the supplemental Appendix), allowing reclassification of 493 (97%) study patients within the recently updated ELN-2017 classification.13 Detection of at least 1 mutation in the 8 genes retained by Lindsley et al defined sAML-like disease.10
HSCT eligibility
According to study design, 305 CR/CRp patients with ELN-2010 intermediate- or adverse-risk AML were eligible for allogeneic HSCT. A total of 93 eligible patients were actually transplanted in first remission, including only 3 patients older than 70 years. The role of HSCT was thus evaluated in the 211 eligible patients aged 70 years or younger, with 90 of them being transplanted (43%). Characteristics of the 90 vs the 121 nontransplanted patients are shown in the supplemental Appendix (supplemental Table 3).
Statistical methods
Primary endpoint was event-free survival (EFS) calculated from the date of induction course initiation until failure of CR/CRp induction after 1 or eventually 2 chemotherapy cycles, relapse, or death. Survival probabilities were calculated using the Kaplan-Meier estimator and compared by the log-rank test.14,15 Measure of treatment effect was based on hazard ratio (HR) computed from a Cox model, together with 95% confidence interval (CI).16 To evaluate the effect of transplantation, we used a landmark at the median time between remission achievement and transplantation (ie, 113 days). Transplantation performed after the landmark was then considered as a time-dependent covariate. Outcome data were then calculated using the Mantel-Byar estimator and compared with an extended Cox model.17 The method described by Simon and Makuch was used for graphical representations.18 All statistical tests were 2-sided, with P values of .05 or less denoting statistical significance. All computations were performed on Stata/IC 15.1 statistical software (College Station, TX).
Results
Patient characteristics
Main patient characteristics are shown in Table 1. According to the various post-MDS sAML definitions, 74 (15%) of 509 patients had AML clinically evolving from a previously diagnosed MDS, and 133 (28%) of 472 patients had WHO AML-MRC, whereas 226 (48%) of 471 patients presented sAML-like gene mutations. The majority of clinically defined sAML (82%) fell into the genetically defined sAML-like subgroup. However, sAML-like mutation incidence was not higher in cases with WHO myelodysplasia-related cytogenetic abnormalities than in cytogenetically normal AML. This largely explained why 43% of the apparent de novo cases in this age group (ie, not classified as WHO AML-MRC or therapy-related AML) also fell into the sAML-like subgroup. Detailed incidences of sAML-like mutations are shown in Figure 1. Mutation in the ASXL1 gene was the most frequent sAML-like classifying mutation, even if 137 (61%) cases with sAML-like mutations only included other gene mutations. Of note, RUNX1 mutations were strongly associated with the presence of sAML-like mutations (Table 1; Figure 1A). Despite these associations, ASXL1 and/or RUNX1 mutations, both now considered as adverse-risk criteria in the ELN-2017 classification, were not detected in 100 (44%) cases with sAML-like mutations. Furthermore, if 72% of patients classified in the ELN-2017 adverse-risk subgroup had a sAML-like disease, 38% also did in the intermediate-risk subgroup, which by definition excludes ASXL1 and/or RUNX1 mutations (Table 1; Figure 1B).
Patient characteristics
| All patients | sAML-like mutations* | ||||
|---|---|---|---|---|---|
| Present† | Absent† | P† | Not tested | ||
| Patients | 509 | 226 | 245 | — | 38 |
| Sex, male/female | 289/220 | 156/70 | 111/134 | <.001 | 22/16 |
| Median age (range), y | 68 (60-85) | 69 (60-85) | 67 (60-80) | <.001 | 69 (61-83) |
| ECOG-PS 0/1/2+/na | 219/219/66/5 | 99/91/34/2 | 106/109/27/3 | .22 | 14/19/5/0 |
| HCT-CI 0/1/2/3+/na | 226/92/66/115/10 | 90/41/35/55/5 | 115/44/29/53/4 | .51 | 21/7/2/7/1 |
| Median WBC (range), ×109/L | 4.9 (0.25-547) | 4.8 (0.25-547) | 5.9 (0.48-358) | .43 | 2.9 (0.5-122) |
| WBC ≥50 × 109/L | 80 | 31 (41) | 45 (59) | .21 | 4 |
| sAML‡ | 74 | 56 (82) | 12 (18) | <.001 | 6 |
| Cytogenetics (N = 472 evaluable) | |||||
| CBF abnormalities | 15 | 2 (15) | 11 (85) | .022 | 2 |
| Normal karyotype | 238 | 100 (45) | 120 (55) | .29 | 18 |
| MRC abnormalities§ | 90 | 41 (49) | 43 (51) | .90 | 6 |
| AML type (N = 472 classifiable) | |||||
| WHO AML-MRC‖ | 133 | 75 (56) | 47 (35) | .001 | 11 |
| Therapy-related AML | 14 | 5 (38) | 8 (62) | .58 | 1 |
| De novo AML¶ | 325 | 129 (43) | 172 (57) | .002 | 24 |
| Gene mutations, n/N tested | |||||
| Biallelic CEBPA mutation | 8/471 | 2 (25) | 6 (75) | .29 | 0 |
| NPM1 mutation | 132/496 | 31 (24) | 96 (76) | <.001 | 5 |
| FLT3-ITD mutation | 90/497 | 23 (26) | 65 (74) | <.001 | 2 |
| FLT3-ITD high ratio# | 21/495 | 6 (29) | 15 (71) | .077 | 0 |
| ASXL1 mutation | 89/471 | 89 (100) | NA | NA | 0 |
| RUNX1 mutation | 82/471 | 69 (84) | 13 (16) | <.001 | 0 |
| TP53 mutation | 34/471 | 12 (35) | 22 (65) | .15 | 0 |
| ELN-2017 subgroups | <.001 | ||||
| Favorable | 136 | 33 (25) | 100 (75) | — | 3 |
| Intermediate | 157 | 49 (38) | 80 (62) | — | 28 |
| Adverse | 200 | 141 (72) | 54 (28) | — | 5 |
| Not classified | 16 | 3 (21) | 11 (79) | — | 2 |
Values are n or n (%), except as noted.
CBF, core binding factor; ECOG-PS, Eastern Cooperative Oncology Group performance status; HCT-CI, hematopoietic cell transplantation comorbidity index; na, not available; NA, not applicable; WBC, white blood cell count.
Defined by the presence of at least 1 gene mutation in the ASXL1, SRSF2, STAG2, BCOR, U2AF1, EZH2, SF3B1, or ZRSR2 genes.
Percentages and P values refer to distribution within sAML-like positive vs negative subsets for each characteristic.
sAML, clinically defined as patients with prior MDS or chronic myelomonocytic leukemia.
MRC cytogenetic abnormalities, according to the WHO AML-MRC definition.9
Includes sAML and/or AML with MRC cytogenetic abnormalities (the multilineage dysplasia criteria were not taken into account here).
Defined as AML classifiable in the WHO 2016 classification but not in the AML-MRC (as defined earlier) or therapy-related AML subgroups.
Defined as FLT3 mutated/wild-type allelic ratio >0.5.
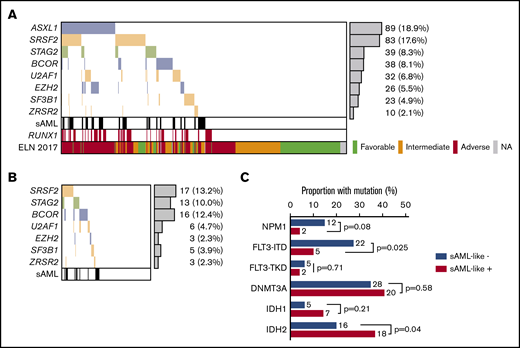
Incidences of sAML-like gene mutations. (A) sAML-like gene mutation in the whole population of 471 patients analyzed. (B) sAML-like gene mutation in the subset of 129 patients with ELN-2017 intermediate-risk AML who were analyzed. Of note, none of these patients had AML with ASXL1 and/or RUNX1 gene mutation, which are 2 criteria for adverse-risk AML in this classification. In these patients, the incidence of sAML-like mutations was not higher in patients with chromosomal abnormalities compared with those with a normal karyotype (41% vs 36%; P = .59). sAML is clinically defined as patients with prior myelodysplastic syndromes or chronic myelomonocytic leukemia (N = 74 patients). (C) Incidences of NPM1, FLT3, IDH1/2, and DNMT3A gene mutations in ELN-2017 intermediate-risk AML analyzed, according to the presence (n = 49) or absence (n = 80) of sAML-like gene mutations. As shown, FLT3-ITD mutations were more frequently observed in patients without sAML-like mutations, whereas IDH2 mutations were more frequently observed in those with sAML-like mutations. Of note, among these IDH2 gene mutations, the incidence of the poor-prognosis IDH2 R172 mutation was 6/49 vs 9/80 (P = .54).
Incidences of sAML-like gene mutations. (A) sAML-like gene mutation in the whole population of 471 patients analyzed. (B) sAML-like gene mutation in the subset of 129 patients with ELN-2017 intermediate-risk AML who were analyzed. Of note, none of these patients had AML with ASXL1 and/or RUNX1 gene mutation, which are 2 criteria for adverse-risk AML in this classification. In these patients, the incidence of sAML-like mutations was not higher in patients with chromosomal abnormalities compared with those with a normal karyotype (41% vs 36%; P = .59). sAML is clinically defined as patients with prior myelodysplastic syndromes or chronic myelomonocytic leukemia (N = 74 patients). (C) Incidences of NPM1, FLT3, IDH1/2, and DNMT3A gene mutations in ELN-2017 intermediate-risk AML analyzed, according to the presence (n = 49) or absence (n = 80) of sAML-like gene mutations. As shown, FLT3-ITD mutations were more frequently observed in patients without sAML-like mutations, whereas IDH2 mutations were more frequently observed in those with sAML-like mutations. Of note, among these IDH2 gene mutations, the incidence of the poor-prognosis IDH2 R172 mutation was 6/49 vs 9/80 (P = .54).
Overall treatment results
After induction therapy, 369 patients (72%) achieved CR/CRp, including 34 patients after a second course and 94 patients (18%) with resistant AML. The remaining patients (9%) died early during induction. Sixty- and 100-day mortality rates were 9.4% and 12.8%, respectively. Treatment courses and patient numbers are displayed in a CONSORT diagram in the supplemental Appendix. If 2 patients with favorable-risk AML transplanted in first remission, even if not eligible, are excluded, a total of 93 eligible patients with intermediate- or adverse-risk AML were actually allografted in first remission (supplemental Appendix). With a median follow-up of 3.8 years, 224 CR/CRp patients relapsed and 218 died, including 33 deaths in first remission. Median EFS was 9.4 months (95% CI, 8.2-11.3 months), and 4-year EFS was estimated at 21% (95% CI, 17%-25%). Median overall survival (OS) was 21.1 months (95% CI, 17.7-24.6 months), and 4-year OS was estimated at 31% (95% CI, 27%-36%).
Added prognostic value of sAML-like gene mutations
Overall, the presence of sAML-like mutations negatively affected EFS (HR, 1.46; 95% CI, 1.19-1.79; P < .001), with a trend toward a worse OS (HR, 1.22; 95% CI, 0.98-1.53; P = .071). In the ELN-2017 favorable- or adverse-risk subgroups, sAML-like gene mutations did not influence the patient outcome (supplemental Figures 1 and 2). As shown in Figure 2 and supplemental Figure 3, the effect of sAML-like mutations (by definition other than ASXL1 mutation) was more marked in the ELN-2017 intermediate-risk subgroup. This led us to propose a simplified older AML binary classification with a high-risk group including ELN-2017 intermediate-risk AML carrying sAML-like mutations together with adverse-risk AML, and a standard-risk group including other more favorable ELN-2017 intermediate-risk AML together with favorable-risk AML. Respective outcomes of standard-risk and high-risk patients (high-risk/standard-risk patient ratio, 1.00) are presented in Figure 2. Restricting this comparison with TP53-wild-type cases did not modify this observation (data not shown).
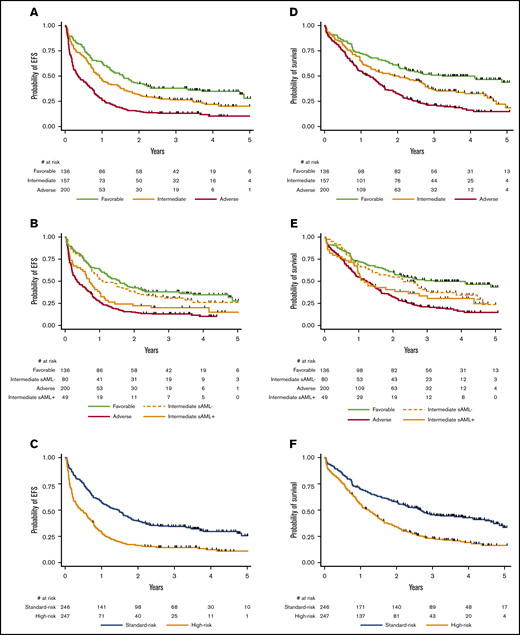
Prognostic effect of sAML-like gene mutations. (A) EFS according to the 3 ELN-2017 risk subgroups (P < .001). At 2 years, EFS was estimated at 42.6% (95% CI, 34.3%-50.8%), 31.8% (95% CI, 24.7%-39.2%), and 15.2% (95% CI, 10.6%-20.6%) in the favorable-, intermediate-, and adverse-risk subgroups, respectively. At 4 years, EFS was estimated at 34.8% (95% CI, 26.7%-43.1%), 21.8% (95% CI, 15.2%-29.2%), and 10.3% (95% CI, 6.0%-16.1%) in the favorable-, intermediate-, and adverse-risk, respectively. (B) EFS according to sAML-like mutations in the ELN-2017 intermediate-risk subgroup. The presence of sAML-like gene mutations significantly influenced EFS in the ELN-2017 intermediate-risk subgroup (HR, 1.52; 95% CI, 1.01-2.28; P = .044). (C) EFS according to the newly defined high-risk/standard-risk groups. EFS was significantly reduced in the high-risk group (HR, 2.03; 95% CI, 1.65-2.48; P < .001). At 2 years, EFS was estimated at 39.8% (95% CI, 33.7-45.9) in the standard-risk group compared with 16.4% (95% CI, 12.0%-21.3%) in the high-risk group. At 4 years, EFS was estimated at 29.6% (95% CI, 23.6%-35.8%) in the standard-risk group compared with 12.3% (95% CI, 8.2%-17.2%) in the high-risk group. (D) OS according to the 3 ELN-2017 risk subgroups (P < .001). At 2 years, OS was estimated at 60.3% (95% CI, 51.6%-68.0%), 50.1% (95% CI, 42.0%-57.6%), and 32.8% (95% CI, 26.4%-39.4%) in the favorable-, intermediate-, and adverse-risk subgroups, respectively. At 4 years, OS was estimated at 49.8% (95% CI, 41.0%-58.0%), 32.7% (95% CI, 24.9%-40.7%), and 16.2% (95% CI, 10.7%-22.6%) in the favorable-, intermediate-, and adverse-risk subgroups, respectively. (E) OS according to sAML-like mutations in the ELN-2017 intermediate-risk subgroup. The presence of sAML-like gene mutations did not significantly influence OS in the ELN-2017 intermediate-risk subgroup (HR, 1.31; 95% CI, 0.85-2.03; P = .22). (F) OS according to the newly defined high-risk/standard-risk groups. OS was significantly reduced in the high-risk group (HR, 1.86; 95% CI, 1.49-2.31; P < .001). At 2 years, OS was estimated at 57.6% (95% CI, 51.2%-63.5%) in the standard-risk group compared with 34.2% (95% CI, 28.3%-40.2%) in the high-risk group. At 4 years, OS was estimated at 42.9% (95% CI, 36.3%-49.3%) in the standard-risk group compared with 19.0% (95% CI, 13.8%-24.7%) in the high-risk group.
Prognostic effect of sAML-like gene mutations. (A) EFS according to the 3 ELN-2017 risk subgroups (P < .001). At 2 years, EFS was estimated at 42.6% (95% CI, 34.3%-50.8%), 31.8% (95% CI, 24.7%-39.2%), and 15.2% (95% CI, 10.6%-20.6%) in the favorable-, intermediate-, and adverse-risk subgroups, respectively. At 4 years, EFS was estimated at 34.8% (95% CI, 26.7%-43.1%), 21.8% (95% CI, 15.2%-29.2%), and 10.3% (95% CI, 6.0%-16.1%) in the favorable-, intermediate-, and adverse-risk, respectively. (B) EFS according to sAML-like mutations in the ELN-2017 intermediate-risk subgroup. The presence of sAML-like gene mutations significantly influenced EFS in the ELN-2017 intermediate-risk subgroup (HR, 1.52; 95% CI, 1.01-2.28; P = .044). (C) EFS according to the newly defined high-risk/standard-risk groups. EFS was significantly reduced in the high-risk group (HR, 2.03; 95% CI, 1.65-2.48; P < .001). At 2 years, EFS was estimated at 39.8% (95% CI, 33.7-45.9) in the standard-risk group compared with 16.4% (95% CI, 12.0%-21.3%) in the high-risk group. At 4 years, EFS was estimated at 29.6% (95% CI, 23.6%-35.8%) in the standard-risk group compared with 12.3% (95% CI, 8.2%-17.2%) in the high-risk group. (D) OS according to the 3 ELN-2017 risk subgroups (P < .001). At 2 years, OS was estimated at 60.3% (95% CI, 51.6%-68.0%), 50.1% (95% CI, 42.0%-57.6%), and 32.8% (95% CI, 26.4%-39.4%) in the favorable-, intermediate-, and adverse-risk subgroups, respectively. At 4 years, OS was estimated at 49.8% (95% CI, 41.0%-58.0%), 32.7% (95% CI, 24.9%-40.7%), and 16.2% (95% CI, 10.7%-22.6%) in the favorable-, intermediate-, and adverse-risk subgroups, respectively. (E) OS according to sAML-like mutations in the ELN-2017 intermediate-risk subgroup. The presence of sAML-like gene mutations did not significantly influence OS in the ELN-2017 intermediate-risk subgroup (HR, 1.31; 95% CI, 0.85-2.03; P = .22). (F) OS according to the newly defined high-risk/standard-risk groups. OS was significantly reduced in the high-risk group (HR, 1.86; 95% CI, 1.49-2.31; P < .001). At 2 years, OS was estimated at 57.6% (95% CI, 51.2%-63.5%) in the standard-risk group compared with 34.2% (95% CI, 28.3%-40.2%) in the high-risk group. At 4 years, OS was estimated at 42.9% (95% CI, 36.3%-49.3%) in the standard-risk group compared with 19.0% (95% CI, 13.8%-24.7%) in the high-risk group.
Allogeneic HSCT
As only 3 of the 93 transplanted patients were older than 70 years, the role of HSCT was evaluated in the 211 eligible patients aged 70 years or younger described in the supplemental Appendix. Ninety of them (43%) actually received transplantation in first remission. According to the ELN-2017 classification, transplantation in first remission was associated with a longer relapse-free survival in both intermediate- and adverse-risk subgroups (HR, 0.50 [95% CI, 0.27-0.94] and 0.37 [95% CI, 0.20-0.62]; P = .032 and .002 by extended Cox model, respectively). In contrast, OS from remission was significantly improved in the adverse-risk subgroup only (HR, 0.44; 95% CI, 0.23-0.85; P = .014 by extended Cox model), not in the intermediate-risk subgroup (HR, 0.68; 95% CI, 0.35-1.31; P = .25 by extended Cox model). The effect of transplantation was thus reassessed in the newly defined high-risk/standard-risk groups. Transplantation significantly prolonged OS from remission in the high-risk subgroup (HR, 0.49; 95% CI, 0.27-0.88; P = .017 by extended Cox model), whereas it did not in the standard-risk subgroup (HR, 0.80; 95% CI, 0.43-1.47; P = .47 by extended Cox model), as illustrated by Simon-Makuch plots in supplemental Figure 4. Again, restricting this analysis to TP53-wild-type cases did not modify these results. This differential effect was also observed after multivariable adjustment (supplemental Table 5).
Discussion
In this prospective older AML study, barriers to inclusion were merely limited to organ dysfunction precluding use of intensive chemotherapy. In the absence of standardized postremission regimens in this age group,11,13,19 responding patients were offered 2 consolidation courses with a high observed compliance rate. Overall results indicate that if more than 50% of patients with favorable-risk AML are still alive 4 years after diagnosis, long-term outcomes of most patients remain poor, even if 43% of those eligible and aged 70 years or younger were effectively transplanted in first remission in this study, a higher percentage than reported in previous analyses.20-23
How to best define high-risk AML in this age group, in the absence of adverse cytogenetics, remains a practical issue because of the well-known heterogeneity of older AML, the effects of aging, including on hematopoiesis, and the strong selection biases in older AML trials offering intensive therapies including HSCT. As in our previous trial,19 the survival of patients in this study did not significantly differ between clinically defined sAML, a well-recognized high-risk AML subset in this age group, and de novo AML. However, using the 8-gene classifier described by Lindsley et al10 to define an sAML-like disease, 43% of those patients with de novo AML could be also classified as such, with significant differences in outcome compared with patients with non sAML-like disease.
Since the opening of this trial, the ELN-risk classification was revised in 2017.13 Despite the known association of RUNX1 mutations with sAML features or sAML-like mutations,24 a sizeable 38% of AML of intermediate risk could still be classified as sAML-like disease as a result of mutations in genes other than ASXL1 or RUNX1. This led us to define high-risk AML as being of adverse or intermediate ELN risk only if genetically classified as sAML-like disease in the latter subgroup. All AML of the favorable or the remaining intermediate-risk cases were considered to be of standard risk.
This 2-class risk assessment, more adapted to the limited therapeutic choices currently available in older patients, identifies approximately half of the patients as being of high risk, with well-separated outcomes. Furthermore, in the few available older AML studies, the benefits of transplantation for overall survival have also not been clearly demonstrated in the ELN intermediate-risk group.20-23 Using this binary risk assessment, and even if this was not our primary objective, we observed that transplantation prolonged OS from remission in patients with high-risk AML only, suggesting that transplantation might not be proposed in first remission to the other half of older standard-risk patients.
We conclude that sAML-like gene mutations, including ASXL1 but not only ASXL1, should be integrated in older AML classification for an improved treatment stratification of patients with intermediate-risk AML standardly treated with intensive chemotherapy. Although this study is the largest prospective study reported so far in this population, more patients will be necessary to better identify which genetic alterations better discriminate these 2 risk groups.
Presented in part at the 59th annual meeting of the American Society of Hematology, Atlanta, GA, 9-12 December 2017.
Data available upon e-mail request to the corresponding author, Claude Gardin, at claude.gardin@aphp.fr.
Acknowledgments
The authors thank all ALFA investigators who participated in the ALFA-1200 study. They are indebted to Frédérique Hilaire, Rebecca Grapin, Anne Solenn Debrie, Imen Chouikh, and Lydia Amghar from the ALFA coordination office for their help in data collection, as well as to Julie Lejeune and Sylvie Chevret, from the Department of Medical Bio-informatics, for data management and hosting at the Hôpital Saint-Louis, Assistance Publique Hôpitaux de Paris, Paris, France.
Supported by the Programme Hospitalier de Recherche Clinique National, AOM06196-P060205.
Authorship
Contribution: C.G., C. Pautas, E.L., J.-H.B., L.A., J.-P.M., J.-V.M., L.G., E.R., J.L., T.B., X.T., S.C., T.C., S.d.B., C.B., N.B., R.P.d.L., M.M., and H.D. enrolled patients in the study; C.G., K.C.-L., and H.D. controlled the database; C.G. and H.D. were the principal investigators and coordinators of the study and wrote the manuscript; R.I., E.F., C.T., and C. Preudhomme undertook or reviewed the biological analyses centrally; H.D. performed the statistical analysis; and all authors contributed to the gathering of the clinical and biological data and approved the manuscript.
Conflict-of-interest disclosure: The authors declare no competing financial interests.
A complete list of investigators in the Acute Leukemia French Association is provided in a supplemental Appendix.
Correspondence: Claude Gardin, Service d'Hématologie, Hôpital Avicenne, Assistance Publique–Hôpitaux de Paris, 125 rue de Stalingrad, 93000 Bobigny, France; e-mail: claude.gardin@aphp.fr.

