

Key Points
During IC admission for adult US patients with AML, 16.0% died or were discharged to hospice (24.2% for patients ≥65 years).
Of all patients, 28.0%, 12.6%, and 4.0% required admission to intensive care units, mechanical ventilation, and dialysis, respectively.

Abstract
Cytarabine-anthracycline based intensive induction chemotherapy (IC) remains the standard of care for remission induction among fit patients with newly diagnosed acute myeloid leukemia (AML) in the United States (US). However, the mortality rate outside of clinical IC trials, predictors of death, and resource utilization during admission for IC have not been thoroughly examined. We used the Premier Healthcare database to identify adult patients (aged 18-89 years) treated with cytarabine-anthracycline-based IC during their first recorded inpatient stay for AML during the contemporary period of 2010 to 2017. We identified factors associated with inpatient death or discharge to hospice, using multivariable logistic regression models. We also assessed the patterns of inpatient healthcare resource utilization. A total of 6442 patients with AML from 313 hospitals who were treated with IC were identified. Median age was 61 years (interquartile range [IQR], 50-68 years), and 56% were men. Median length of stay was 29 (IQR, 25-38) days, with rates of in-hospital death and discharge to hospice of 12.3% and 3.7% (17.9% and 6.3% among patients aged ≥65 years), respectively. Predictors of in-hospital death or discharge to hospice included older age, geographic region, and lower hospital volume. During admission, 28.0%, 12.6%, and 4.0% of patients required treatment in intensive care units, mechanical ventilation, and dialysis, respectively. Despite improvements in supportive care in the contemporary era, inpatient mortality during first hospitalization for adult patients with AML treated with IC in the US remains high particularly among older patients.
Introduction
Despite major advances in our understanding of the underlying molecular biology of acute myeloid leukemia (AML), a cytarabine and anthracycline-based intensive induction chemotherapy (IC) regimen has been the standard of care for medically fit patients with AML for more than 45 years, with only minor changes to the treatment protocol.1,2 The most commonly used regimen in the United States for IC for AML involves continuous infusion of cytarabine for 7 days, overlapping with an anthracycline for the first 3 days, commonly referred to as “7+3.” Curative therapy for AML requires induction of complete remission, usually with IC, followed by curative-intent postremission therapy, often including allogeneic hematopoietic stem cell transplant. Current clinical trials are exploring the role of newer targeted agents in curative paradigms.1-4
Treatment-related mortality has been a major driver of early mortality in AML, especially among older (aged ≥65 years) patients and those with comorbidities.5-10 Improvements in supportive care and care through intensive care units (ICUs) have led to reductions in early mortality.11-13 In clinical trials, in 2006 to 2009, early mortality after treatment initiation was as low as 3% to 4% among patients with AML receiving IC, and was only 1% among those who received 7+3 alone in recent Southwest Oncology Group trials.13 However, population-based studies have reported mortality during the first month of treatment ranging from 5% to 15%.9,11,12
Although various aspects of IC, such as ICU admission, use of mechanical ventilation and dialysis, and IC-related mortality, have been reported in clinical trials, little is known about practice patterns and outcomes with IC in real-world settings. Prior studies suggested that, for patients with AML, early mortality and overall survival were associated with facility type (academic center, National Cancer Institute–designated cancer center, or nonacademic community hospital), racial and sociodemographic factors, patient age, and comorbidities.9,14-16 Unlike with most other cancers, patients with AML normally receive chemotherapy, especially intensive therapy, in inpatient settings. However, detailed inpatient information is not available in commonly used data sets such as Surveillance, Epidemiology, and End Results registry data, the National Cancer Database, or Medicare claims. Because of the lack of detailed inpatient information, previous studies were unable to assess specific chemotherapy regimens used. We report a large retrospective cohort study assessing details of inpatient care delivered in the United States for patients with AML receiving IC, including medications and use of specific resources (eg, mechanical ventilation, dialysis). We characterize in-hospital death and discharge to hospice and their predictors in the contemporary era (2010-2017).
Methods
Data source and study population
The Premier Healthcare database (Premier Inc., Charlotte, NC) includes data from geographically diverse, nonprofit, nongovernmental, community, and teaching hospitals in the United States.17 Premier captures information for 25% of all inpatient admissions across all ages and payor groups.17 The database includes demographics, diagnoses, and detailed charge records with information on diagnostic tests and the use of drugs, procedures, and other inpatient resources, with days relative to admission. It does not contain cytogenetic or molecular data. The Yale Human Investigation Committee determined that this study, using Premier data, did not directly involve human subjects.
Adult (aged 18-89 years) patients with AML who received cytarabine-anthracycline–based IC during their first recorded inpatient stay for AML between 2010 and 2017 were included. Cytarabine and anthracyclines (idarubicin, daunorubicin, doxorubicin) or anthracenediones (mitoxantrone) were identified from detailed drug charge files. As our focus for this analysis was on the most commonly used 7+3 regimen, we required that patients received at least 3 days of cytarabine, received at least 1 day of both cytarabine and anthracycline, had gaps between 2 doses smaller than 3 days, and had their regimen completed within 10 days of initiation.
Patients were excluded if they were diagnosed with acute promyelocytic leukemia based on diagnosis codes or receipt of all-trans retinoic acid for more than 6 days, or received chemotherapy that was not cytarabine-anthracycline based (etoposide, cladribine, clofarabine, fludarabine, azacitidine, dasatinib, decitabine, gemtuzumab ozogamicin, imatinib mesylate, nilotinib, and sorafenib). Receipt of hydroxyurea before or in conjunction with 7+3 was allowed. In addition, 13 patients with unknown sex and 1 patient with more than 2-year length of stay were excluded from the analysis.
Outcomes of interest
We used a composite indicator for in-hospital death or discharge to hospice (home or facility-based) based on reported discharge disposition. Although discharge to hospice is a potentially less devastating outcome than death, it indicates abandonment of future therapy targeted at cure in light of either treatment failure or overwhelming complications of therapy. In sensitivity analysis, we used the more limited outcome of in-hospital death. Using charge records, we assessed whether a patient was admitted to the ICU or received mechanical ventilation, dialysis, bone marrow assessment (including records for aspirate/biopsy and interpretation), and antibacterial, antifungal, or antiviral medications. We also captured readmissions to the same hospital.
Variables of interest
We obtained demographic characteristics (sex, age at admission, race, marital status at admission [single, married, unknown]) and information related to the inpatient stay (length of stay, whether transferred from another hospital) from the encounter file. We also analyzed data on provider location (urban vs rural), teaching hospital status, number of beds in the hospital, and geographic region.
We constructed a hospital-level measure of average annual volume of patients with AML receiving IC, based on the observations in the study sample. As some hospitals did not report to Premier continuously, we adjusted the denominator for years each hospital was observed. We categorized hospitals as low (<4), medium (4-8), or high (≥9) IC volume, with cutoff points chosen to balance the number of patients in each category (ie, tertiles).
Statistical analysis
Continuous variables were summarized by median and interquartile range (IQR). Categorical variables were described using frequencies and percentages. We compared patient and other provider characteristics by hospital volume, using an analysis of variance test for continuous variables and Pearson’s χ2 test for categorical variables. A multivariable logistic regression analysis was conducted to assess whether patient and provider characteristics were associated with in-hospital death or hospice discharge. The multivariable model included patient demographics (sex, age at admission, race/ethnicity, marital status), whether the patient was transferred from another hospital, hospital AML treatment volume, and provider geographical region.
We also described the patterns of inpatient health care use (ICU admission, mechanical ventilation, dialysis, bone marrow testing, and antiinfective medications) and evaluated whether the patterns varied by hospital AML treatment volume, using Pearson’s χ2 test. All tests were 2-sided with an α level of 0.05. As older patients with AML (≥65 years) are known to have worse outcomes and may be treated differently, we also described rates of in-hospital death or hospice discharge and patterns of inpatient health care use by 2 age groups (<65 years vs ≥65 years). All analyses were conducted using SAS (version 9.4, SAS Institute, Inc, Cary, NC).
Results
Study population
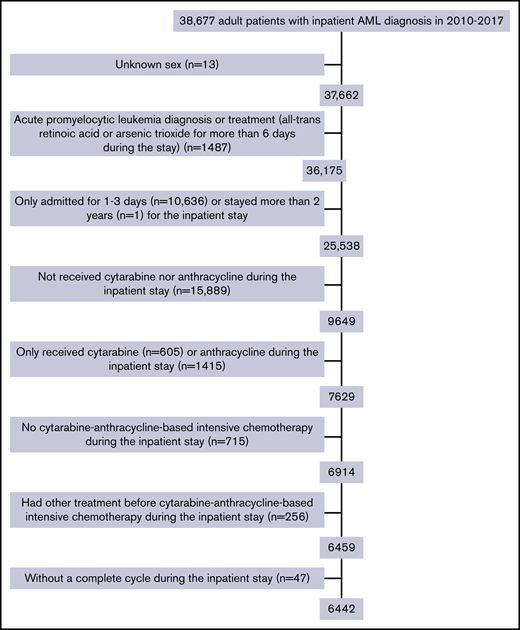
The final study cohort included 6442 patients with AML from 313 hospitals. As shown in Figure 1, patients were excluded mainly because of brief (≤3 days; n = 10 636) inpatient stay or if they did not receive cytarabine and/or anthracycline during the stay (n = 17 304). The median age was 61 years (range, 18-89 years; IQR, 50-68 years), and 56% of patients were men. The median time from admission to initiation of IC was 3 (IQR, 2-5) days, with a median length of stay of 29 (IQR, 25-38) days. More than half of the patients were treated in urban (95.6%), teaching (59.3%), and large (>500 beds; 55.5%) hospitals (Table 1). However, as shown in Table 2, 54.3% of the 313 hospitals treating patients with AML with IC were nonteaching hospitals. Of those, 223 hospitals were categorized as low-IC-volume hospitals and only 26 were high-IC-volume hospitals. As expected, high-IC-volume hospitals were more likely to be large (>500 beds, 80.8%) and teaching (80.8% vs 38.6% in low-IC-volume) hospitals. Compared with patients treated in hospitals with lower IC volume, patients in the high-IC-volume hospitals were more likely to be transferred from other hospitals (21.9% vs 8.0%; P < .01) and more likely to have readmissions (72.3% vs 65.3%; P < .01).
Characteristics of 6442 adult patients with AML who received cytarabine-anthracycline-based IC
| Overall | Hospital IC volume | P | |||||||
|---|---|---|---|---|---|---|---|---|---|
| Low | Medium | High | |||||||
| n | % | n | % | n | % | n | % | ||
| Total | 6442 | 2045 | 2239 | 2158 | |||||
| Sex | |||||||||
| Female | 2859 | 44.4 | 937 | 45.8 | 982 | 43.9 | 940 | 43.6 | .28 |
| Male | 3583 | 55.6 | 1108 | 54.2 | 1257 | 56.1 | 1218 | 56.4 | |
| Age, y | |||||||||
| Median (IQR) | 61 (50-68) | 61 (50-69) | 61 (50-68) | 60 (49-68) | |||||
| 18-39 | 798 | 12.4 | 243 | 11.9 | 279 | 12.5 | 276 | 12.8 | .52 |
| 40-59 | 2223 | 34.5 | 691 | 33.8 | 765 | 34.2 | 767 | 35.5 | |
| 60-89 | 3421 | 53.1 | 1111 | 54.3 | 1195 | 53.4 | 1115 | 51.7 | |
| Race/ethnicity | |||||||||
| Non-Hispanic white | 4669 | 72.5 | 1409 | 68.9 | 1723 | 77.0 | 1537 | 71.2 | <.01 |
| Non-Hispanic African American | 488 | 7.6 | 182 | 8.9 | 143 | 6.4 | 163 | 7.6 | |
| Hispanic | 418 | 6.5 | 155 | 7.6 | 124 | 5.5 | 139 | 6.4 | |
| Other | 818 | 12.7 | 286 | 14.0 | 239 | 10.7 | 293 | 13.6 | |
| Unknown | 49 | 0.8 | 13 | 0.6 | 10 | 0.4 | 26 | 1.2 | |
| Marital status | |||||||||
| Single | 2389 | 37.1 | 782 | 38.2 | 812 | 36.3 | 795 | 36.8 | .59 |
| Married | 3476 | 54.0 | 1090 | 53.3 | 1227 | 54.8 | 1159 | 53.7 | |
| Other | 577 | 9.0 | 173 | 8.5 | 200 | 8.9 | 204 | 9.5 | |
| Year of admission | |||||||||
| 2010 | 831 | 12.9 | 281 | 13.7 | 287 | 12.8 | 263 | 12.2 | <.01 |
| 2011 | 871 | 13.5 | 309 | 15.1 | 318 | 14.2 | 244 | 11.3 | |
| 2012 | 947 | 14.7 | 334 | 16.3 | 331 | 14.8 | 282 | 13.1 | |
| 2013 | 941 | 14.6 | 345 | 16.9 | 335 | 15.0 | 261 | 12.1 | |
| 2014 | 921 | 14.3 | 277 | 13.5 | 330 | 14.7 | 314 | 14.6 | |
| 2015 | 923 | 14.3 | 257 | 12.6 | 304 | 13.6 | 362 | 16.8 | |
| 2016 | 917 | 14.2 | 227 | 11.1 | 302 | 13.5 | 388 | 18.0 | |
| 2017 | 91 | 1.4 | 15 | 0.7 | 32 | 1.4 | 44 | 2.0 | |
| Readmission | |||||||||
| No | 1982 | 30.8 | 709 | 34.7 | 676 | 30.2 | 597 | 27.7 | <.01 |
| Yes | 4460 | 69.2 | 1336 | 65.3 | 1563 | 69.8 | 1561 | 72.3 | |
| Length of stay, d | |||||||||
| Range | 4-175 | 4-175 | 5-156 | 4-159 | |||||
| Median (IQR) | 29 (25-38) | 29 (24-37) | 29 (25-38) | 30 (25-39) | <.01 | ||||
| Discharge status | |||||||||
| Alive | 5414 | 84.0 | 1696 | 82.9 | 1863 | 83.2 | 1855 | 86.0 | .05 |
| Hospice | 238 | 3.7 | 76 | 3.7 | 89 | 4.0 | 73 | 3.4 | |
| Dead | 790 | 12.3 | 273 | 13.3 | 287 | 12.8 | 230 | 10.7 | |
| Transferred from other hospital | |||||||||
| No | 5450 | 84.6 | 1881 | 92.0 | 1884 | 84.1 | 1685 | 78.1 | <.01 |
| Yes | 992 | 15.4 | 164 | 8.0 | 355 | 15.9 | 473 | 21.9 | |
| Hospital location | |||||||||
| Rural | 283 | 4.4 | 187 | 9.1 | 8 | 0.4 | 88 | 4.1 | <.01 |
| Urban | 6159 | 95.6 | 1858 | 90.9 | 2231 | 99.6 | 2070 | 95.9 | |
| Teaching hospital | |||||||||
| No | 2622 | 40.7 | 1248 | 61.0 | 908 | 40.6 | 466 | 21.6 | <.01 |
| Yes | 3820 | 59.3 | 797 | 39.0 | 1331 | 59.4 | 1692 | 78.4 | |
| Hospital bed size | |||||||||
| 000-199 | 297 | 4.6 | 187 | 9.1 | 52 | 2.3 | 58 | 2.7 | <.01 |
| 200-299 | 673 | 10.4 | 417 | 20.4 | 103 | 4.6 | 153 | 7.1 | |
| 300-399 | 1093 | 17.0 | 559 | 27.3 | 368 | 16.4 | 166 | 7.7 | |
| 400-499 | 801 | 12.4 | 370 | 18.1 | 431 | 19.2 | 0 | 0.0 | |
| 500+ | 3578 | 55.5 | 512 | 25.0 | 1285 | 57.4 | 1781 | 82.5 | |
| Hospital region | |||||||||
| South | 3109 | 48.3 | 987 | 48.3 | 917 | 41.0 | 1205 | 55.8 | <.01 |
| Northeast | 863 | 13.4 | 149 | 7.3 | 298 | 13.3 | 416 | 19.3 | |
| Midwest | 1151 | 17.9 | 403 | 19.7 | 411 | 18.4 | 337 | 15.6 | |
| West | 1319 | 20.5 | 506 | 24.7 | 613 | 27.4 | 200 | 9.3 | |
Characteristics of 313 hospitals
| Overall | Hospital volume | |||||||
|---|---|---|---|---|---|---|---|---|
| Low | Medium | High | ||||||
| n | % | n | % | n | % | n | % | |
| Total | 313 | 223 | 64 | 26 | ||||
| Hospital location | ||||||||
| Rural | 28 | 8.9 | 26 | 11.7 | 1 | 1.6 | 1 | 3.8 |
| Urban | 285 | 91.1 | 197 | 88.3 | 63 | 98.4 | 25 | 96.2 |
| Teaching hospital | ||||||||
| No | 170 | 54.3 | 137 | 61.4 | 28 | 43.8 | 5 | 19.2 |
| Yes | 143 | 45.7 | 86 | 38.6 | 36 | 56.3 | 21 | 80.8 |
| Hospital bed size | ||||||||
| 000-199 | 34 | 10.9 | 30 | 13.5 | 3 | 4.7 | 1 | 3.8 |
| 200-299 | 55 | 17.6 | 49 | 22.0 | 5 | 7.8 | 1 | 3.8 |
| 300-399 | 78 | 24.9 | 63 | 28.3 | 12 | 18.8 | 3 | 11.5 |
| 400-499 | 52 | 16.6 | 40 | 17.9 | 12 | 18.8 | 0 | 0.0 |
| 500+ | 94 | 30.0 | 41 | 18.4 | 32 | 50.0 | 21 | 80.8 |
| Hospital region | ||||||||
| South | 140 | 44.7 | 99 | 44.4 | 26 | 40.6 | 15 | 57.7 |
| Northeast | 33 | 10.5 | 21 | 9.4 | 8 | 12.5 | 4 | 15.4 |
| Midwest | 70 | 22.4 | 55 | 24.7 | 11 | 17.2 | 4 | 15.4 |
| West | 70 | 22.4 | 48 | 21.5 | 19 | 29.7 | 3 | 11.5 |
In-hospital death or discharge to hospice
Of the 6442 patients, 12.3% died in the hospital and 3.7% were discharged to hospice (combined total, 16.0%). Among patients who died in the hospital, 76.8%, 19.9%, and 3.3% died in days 1 to 30, days 31 to 60, and more than 60 days from the initiation of IC, respectively. Mortality was highest during the second and third week after IC initiation (21.4% and 26.8% of deaths, respectively).
In multivariable analysis, younger patients (18-39 years) had a lower risk (odds ratio [OR], 0.34; 95% confidence interval [CI], 0.25-0.48; P < .01), whereas older patients (≥65 years) had a higher risk (OR, 2.24; 95% CI, 1.94-2.57; P < .01) of death or discharge to hospice compared with patients aged 40 to 64 years (Table 3). Patients treated in the high-IC-volume hospitals were less likely to die or to be discharged to hospice than those treated at low-IC-volume hospitals (OR, 0.80; 95% CI, 0.67-0.95; P = .01). Compared with patients treated in the South, patients treated in the Northeast were less likely to die or be discharged to hospice (OR, 0.72; 95% CI, 0.57-0.91; P < .01). In sensitivity analyses using in-hospital death only as the outcome, findings were mostly similar to the main model, with the addition of a significant association between transfer from another hospital and death (OR, 1.19; 95% CI, 1.01-1.40; P = .04) and lack of a difference across hospital regions (data not shown).
Patient/provider characteristics and risk for in-hospital death or discharge to hospice among 6442 adult patients with AML
| Status at discharge | OR | 95% CI | P | ||
|---|---|---|---|---|---|
| Alive, n (%) | Death/hospice, n (%) | ||||
| Total, N | 5414 | 1028 | |||
| Sex | |||||
| Female | 2433 (44.9) | 426 (41.4) | 1.00 | ||
| Male | 2981 (55.1) | 602 (58.6) | 1.09 | 0.95-1.26 | .21 |
| Age, y | |||||
| 18-39 | 759 (14.0) | 39 (3.8) | 0.34 | 0.25-0.48 | <.01 |
| 40-64 | 2835 (52.4) | 408 (39.7) | 1.00 | ||
| 65-89 | 1820 (33.6) | 581 (56.5) | 2.24 | 1.94-2.57 | <.01 |
| Race/ethnicity | |||||
| Non-Hispanic white | 3887 (71.8) | 782 (76.1) | 1.00 | ||
| Non-Hispanic African American | 417 (7.7) | 71 (6.9) | 0.92 | 0.70-1.21 | .56 |
| Hispanic | 360 (6.6) | 58 (5.6) | 0.99 | 0.73-1.34 | .96 |
| Other | 713 (13.2) | 105 (10.2) | 0.80 | 0.63-1.01 | .07 |
| Unknown | 37 (0.7) | 12 (1.2) | 1.69 | 0.87-3.31 | .12 |
| Marital status | |||||
| Single | 1991 (36.8) | 398 (38.7) | 1.30 | 1.12-1.50 | <.01 |
| Married | 2940 (54.3) | 536 (52.1) | 1.00 | ||
| Other | 483 (8.9) | 94 (9.1) | 1.21 | 0.94-1.56 | .14 |
| Transferred from other hospital | |||||
| No | 4581 (84.6) | 869 (84.5) | 1.00 | ||
| Yes | 833 (15.4) | 159 (15.5) | 1.15 | 0.95-1.40 | .14 |
| Hospital volume | |||||
| Low | 1696 (31.3) | 349 (33.9) | 1.00 | ||
| Medium | 1863 (34.4) | 376 (36.6) | 0.99 | 0.84-1.17 | .91 |
| High | 1855 (34.3) | 303 (29.5) | 0.80 | 0.67-0.95 | .01 |
| Hospital region | |||||
| South | 2593 (47.9) | 516 (50.2) | 1.00 | ||
| Northeast | 758 (14.0) | 105 (10.2) | 0.72 | 0.57-0.91 | <.01 |
| Midwest | 961 (17.8) | 190 (18.5) | 0.94 | 0.78-1.13 | .51 |
| West | 1102 (20.4) | 217 (21.1) | 0.96 | 0.80-1.16 | .70 |
Patterns of inpatient healthcare utilization
During their inpatient stay, 28.0%, 12.6%, and 4.0% of patients required ICU admission, mechanical ventilation, and dialysis, respectively. Surprisingly, only 59.2% of patients had records indicating a bone marrow aspirate/biopsy during their inpatient stay. Nearly all patients received antiinfective medications, including 99.1%, 94.8%, and 76.7% for antibacterial, antifungal, and antiviral medications, respectively. Patients in high-IC-volume hospitals were more likely to undergo a bone marrow assessment (P = .02) and receive antibacterial, antifungal, and antiviral medications (all P < .01; Figure 2).
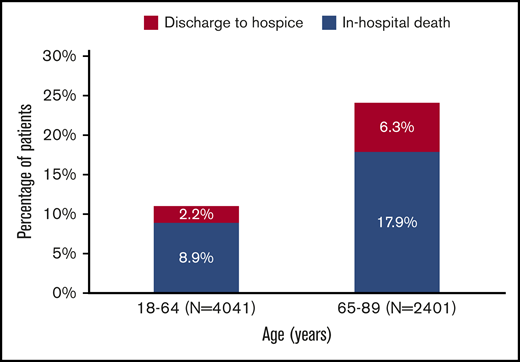
Discharge status among 6442 adult patients with AML who received cytarabine-anthracycline-based IC by age.
Discharge status among 6442 adult patients with AML who received cytarabine-anthracycline-based IC by age.
Outcomes by age
Among patients aged 18 to 64 years at admission, 11.1% met the composite outcome of early mortality (8.9% died in the hospital, 2.2% were discharged to hospice); this percentage was 24.2% among patients aged at least 65 years at admission (in hospital death, 17.9%; discharge to hospice, 6.3%; Figure 3). Younger patients had lower rates of ICU admission (P < .01), mechanical ventilation (P < .01), and dialysis (P = .05), but were more likely to receive bone marrow testing (P < .01) and antifungal (P = .01) and antiviral (P = .02) medications (Figure 4). There was no difference in the use of antibacterial medications (P = .14) between the 2 age groups.
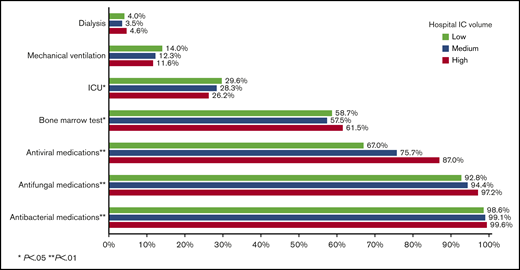
Healthcare use among 6442 adult patients with AML who received cytarabine-anthracycline-based IC by hospital volume.
Healthcare use among 6442 adult patients with AML who received cytarabine-anthracycline-based IC by hospital volume.
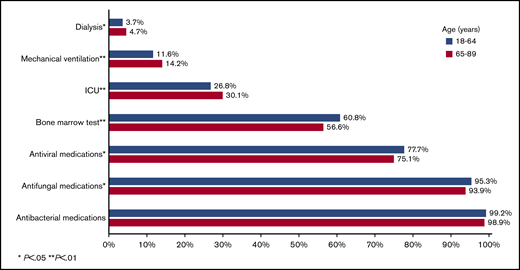
Healthcare use among 6442 adult patients with AML who received cytarabine-anthracycline-based IC by age.
Healthcare use among 6442 adult patients with AML who received cytarabine-anthracycline-based IC by age.
Discussion
In this large, contemporary cohort of patients with AML treated with cytarabine-anthracycline-based 7+3 IC, 1 in 7 patients overall, and 1 in 4 patients aged at least 65 years, died in the hospital during the first IC admission or was discharged to hospice, suggesting treatment failure or overwhelming complications of therapy. These rates are substantially higher than those reported in clinical trials.12,13,16,18 Rates of death or discharge to hospice were lower in hospitals with high IC volume, as were rates of ICU admission and mechanical ventilation. These results should help illuminate informed consent discussions regarding expected outcomes of 7+3 IC for AML in various patient groups and may help guide selection of appropriate therapeutic approaches in both the community and academic setting. Although many community practitioners are comfortable treating patients with AML, the outcomes based on AML volume and patient population should be considered when decisions regarding transfer to tertiary care centers are discussed.
Older patients with AML demonstrated a dramatically higher rate of in-hospital death or hospice discharge when compared with clinical trial estimates. We observed in-hospital death in 8.9% of patients younger than 65 years, with an additional 2.2% discharged to hospice. The mortality rates were doubled (17.9%) in patients aged 65 years and were almost triple the rate (6.3%) of discharge to hospice. Although it is not clear from our data whether in-hospital death and hospice discharges were related to treatment failure, progressive or refractory AML, or overwhelming complications of therapy, the vast majority of deaths occurred in the first 30 days after IC, suggesting that complications of therapy are an important driver of early death among older patients. Assessing chemotherapy tolerability is challenging and should not be based solely on age but, rather, on a comprehensive assessment of functional status, genetic and molecular profiling, and patient preferences.19 Our findings also suggest that other approaches aside from IC should be considered for such patients even if they are believed to be “fit” for IC. For example, venetoclax-based combinations with lower-intensity therapy, recently approved for older (≥75 years of age) or IC-ineligible patients, might serve as an alternative regimen.20,21 Interestingly, recent data from a large, single-center, retrospective analysis of patients with AML aged at least 70 years suggested that older patients with AML who are not eligible (or who decline) IC might benefit from nonintensive therapies such as hypomethylating agent therapy in terms of overall survival.22
Our findings also demonstrate better outcomes associated with treatment in centers with higher AML volume. In our study, patients treated at high-IC-volume hospitals had lower odds of inpatient death or hospice discharge during the IC hospitalization, although the magnitude of the effect was not large. Most of these high-IC-volume hospitals were teaching and large hospitals. Previous studies have found improved outcomes of patients with AML who were treated in academic or National Cancer Institute–designated cancer centers compared with their counterparts treated in smaller, community-based hospitals.9,14 Although selection bias based on stability and other factors associated with likelihood of transfer may confound the data, access to specialized providers and nursing staff, greater experience with early recognition and management of complications, improved adherence to treatment guidelines, and easier access to supportive care such as dialysis and mechanical ventilation have been proposed as the underlying mechanisms.9,14,23
Another novel and notable finding is the unexpectedly low rate of bone marrow assessments after completion of the IC regimen. Although diagnostic bone marrow assessments could have been performed before admission or were not performed because of the AML diagnosis made on the basis of peripheral blood blasts, our data suggest that many providers are not performing the follow-up actionable day 14 to 21 bone marrow evaluation after initiation of chemotherapy that is recommended by the National Comprehensive Cancer Network to assess for persistent leukemia.24
Although providing several important and novel observations, our study has several limitations associated with the use of administrative discharge and charge records from a large group of affiliated hospitals. First, our analysis is limited to outcomes and resource use for patients with AML receiving IC during their first reported AML admission in the database. The Premier database uses hospital/patient specific identifiers; as such, it does not support linking records across Premier providers and does not track patients when treated outside the Premier system. Thus, we developed an operational definition for 7+3 IC based on charge records for specific drugs at specific times. As shown in Figure 1, a major reason for patients to be excluded was receiving neither cytarabine nor anthracycline during their inpatient stay (n = 15 889). However, among those 15 889 patients, 13.3%, 10.6%, 7.4%, 6.4%, and 4.0% had a diagnosis-related group major category of infectious disease, blood disorders, respiratory disorders, circulatory system disorders, and digestive system disorders, respectively (41.7% in total), which indicates that a proportion of those excluded patients might not have been newly diagnosed with AML but, rather, reflect a prior AML diagnosis. We acknowledge that some patients who met those criteria may have received other forms of anthracycline/cytarabine-based IC and that our findings might not be generalizable to those patients. Second, there may be confounding on the basis of unobserved health status, financial resources, or social supports, which could not be measured with the available data. Prior research suggests that patients who travel to academic centers for second opinions or novel therapies are healthier and wealthier and have greater social supports. It is unclear whether these factors would be relevant for patients diagnosed acutely with a serious illness such as AML. However, we cannot rule out the potential for bias. Third, our analysis is limited to outcomes and resource utilization for the initial admission for IC. As a result, we were unable to evaluate subsequent treatments or longer-term survival. Finally, the Premier database does not contain cytogenetic and molecular data, which are increasingly being used to guide treatment selection for individual patients. Despite these limitations, our results are based on a large real-world sample selected on the basis of observable treatment regimens.
In conclusion, in this large contemporary cohort of 6442 adult patients with AML undergoing cytarabine-anthracycline based IC in the United States, we observed a higher risk for in-hospital mortality and discharge to hospice than reported by clinical trials. Further analyses are warranted to examine predictors of IC-related deaths and to develop strategies that improve patient outcomes.
Presented in abstract form at the 61st annual meeting of the American Society of Hematology, Orlando, FL, 7 December 2019.
The original data from the Premier Healthcare Database may not be shared by the authors per the data use agreement. However, the data can be requested directly from Premier.
Acknowledgments
This study was supported by an investigator-initiated research grant from Celgene Corp (principal investigator: X.M.). A.M.Z. is a Leukemia and Lymphoma Society Scholar in Clinical Research and is also supported by a National Cancer Institute Cancer Clinical Investigator Team Leadership Award. The conduct of the study and interpretation of the data are the sole responsibility of the authors.
Authorship
Contribution: A.M.Z., A.J.D., X.M., and R.W. designed the research, supervised data analysis, interpreted the data, and wrote the initial draft of the manuscript; X.W., C.Z., and R.W. performed data analysis; all other authors reviewed and interpreted the data and critically reviewed and contributed to the manuscript significantly; and all authors approved the final manuscript for submission.
Conflict-of-interest disclosure: A.M.Z. received research funding (institutional) from Celgene, Acceleron, AbbVie, Otsuka, Pfizer, Medimmune/AstraZeneca, Boehringer-Ingelheim, Trovagene, Incyte, Takeda, and ADC Therapeutics and had a consultancy with and received honoraria from AbbVie, Otsuka, Pfizer, Celgene, Ariad, Agios, Boehringer-Ingelheim, Novartis, Acceleron, Astellas, Daiichi Sankyo, Trovagene, BeyondSpring, Epizyme, and Takeda. N.A.P. received research funding (institutional) from Boehringer Ingelheim, Astellas Pharma, Daiichi Sankyo, Sunesis Pharmaceuticals, Celator, Pfizer, Astex Pharmaceuticals, CTI BioPharma, Genentech, AI Therapeutics, Samus Therapeutics, Arog Pharmaceuticals, and Kartos Therapeutics; received research funding from Celgene; and had a consultancy with and received honoraria from Alexion, Pfizer, Agios Pharmaceuticals, Blueprint Medicines, Incyte, Novartis, Celgene, Bristol-Myers Squib, and CTI biopharma. S.F.H. received research funding (institutional) from Celgene, TG Therapeutics, DTRM, and Genentech and reports personal fees from Celgene, Pharmacyclics, Genentech, and Bayer, outside the submitted work. S.D.G. has consulted for and receives research funding from Celgene and personal fees from AbbVie, Jazz Pharmaceuticals, Kyowa Hakko Kirin, Tolero Pharmaceuticals, and Daiichi Sankyo outside the submitted work. A.J.D. reports receiving grants from Celgene during the conduct of the study; and a family member with personal fees from AbbVie, Jazz Pharmaceuticals, Kyowa Hakko Kirin, Tolero Pharmaceuticals, and Daiichi Sankyo outside the submitted work. X.M. received research funding (institutional) from Celgene for this work. The remaining authors declare no competing financial interests.
Correspondence: Amer M. Zeidan, Section of Hematology, Department of Medicine, Yale University, 333 Cedar St, PO Box 208028, New Haven, CT 06520-8028; e-mail: amer.zeidan@yale.edu.

