

Key Points
FLT3ITD marks poor survival in younger (<60 years) but not in older (60-74 years) patients with AML.
NPM1mut marks good survival in older, but not younger patients, with AML.

Abstract
In acute myeloid leukemia (AML) FLT3 internal tandem duplication (ITD) and nucleophosmin 1 (NPM1) mutations provide prognostic information with clinical relevance through choice of treatment, but the effect of age and sex on these molecular markers has not been evaluated. The Swedish AML Registry contains data on FLT3-ITD and NPM1 mutations dating to 2007, and 1570 adult patients younger than 75 years, excluding acute promyelocytic leukemia, had molecular results reported. Females more often had FLT3ITD and/or NPM1mut (FLT3ITD: female, 29%; male, 22% [P = .0015]; NPM1mut: female, 36%; male, 27% [P = .0001]), and more males were double negative (female, 53%; male, 64%; P < .0001). Patients with FLT3ITD were younger than those without (59 vs 62 years; P = .023), in contrast to patients with NPM1mut (62 vs 60 years; P = .059). Interestingly, their prognostic effect had a strong dependence on age: FLT3ITD indicated poor survival in younger patients (<60 years; P = .00003), but had no effect in older patients (60-74 years; P = .5), whereas NPM1mut indicated better survival in older patients (P = .00002), but not in younger patients (P = .95). In FLT3ITD/NPM1mut patients, the survival was less dependent on age than in the other molecular subsets. These findings are likely to have clinical relevance for risk grouping, study design, and choice of therapy.
Introduction
Genetic markers are increasingly important in acute myeloid leukemia (AML) for knowledge on pathophysiology,1,2 risk classification, and choice of specific treatment.3 Cytogenetic results have been essential in the clinical work-up for more than 20 years.4 More recently, the prognostic effect of FLT3 internal tandem duplication (ITD) and nucleophosmin 1 (NPM1) mutations in AML have become well established.5-11 FLT3-ITD is associated with higher white blood cell (WBC) counts and blast counts at diagnosis, and a poorer prognosis,5-9 whereas NPM1 mutation associates with a better outcome if FLT3ITD is absent.8,9 Both FLT3 and NPM1 status have influence on European Leukemia Net risk stratification,12 and if FLT3-mutation is present, the recommendation is to include the multikinase inhibitor midostaurin into primary treatment13 and to perform allogeneic stem cell transplantation (alloSCT) in first complete remission, if feasible.
Age is also a strong prognostic marker,14 but the prognostic effect of genetic markers may differ by age,15 and the age-dependence for molecular aberrations has not been fully evaluated. We have therefore used the high-coverage nationwide population-based Swedish AML Registry14,16 to study the effect of FLT3ITD and NPM1mut in different age groups of adult AML.
Patients and methods
The Swedish AML Registry collects data on all adult (18 years or older) patients with AML,14 including secondary AML, diagnosed since 1997, and the registry now contains more than 8000 patients.16 The coverage has consistently been higher than 98% as compared with the Swedish National Cancer Registry, established in 1958, with compulsory dual reporting from both pathology and clinical departments. Missing data are actively requested and data quality maintained through monitoring by the Regional Cancer Center, funded by national grants, as previously reported.14 Data collection is facilitated by the Swedish personal ID code system, established in 1947. Survival is automatically updated daily through the population registry. The AML Registry became web-based in 2007, when more clinical data at diagnosis, including genetics, and details on primary treatment also were introduced. FLT3ITD and NPM1mut analyses have been performed in the university hospital laboratories, using established standard techniques, as part of the routine diagnostic workup in all Swedish AML centers. The molecular results (aberration present/absent/not evaluated) have been recorded in the AML registry since 2007. Molecular analysis was recommended for patients who had normal or inconclusive karyotype and were scheduled for intensive therapy, but in practice, most patients considered for active AML therapy had molecular analyses performed. FLT3ITD allelic ratio and other FLT3-mutations than ITD have not been recorded.
Patients have been uniformly treated according to the Swedish National Guidelines,17 established in 2005 and revised biannually; however, with minimal changes in primary treatment and indication for transplantation.16 Treatment consists of daunorubicin 60 mg/m2 per 8-hour infusion days 1 to 3 and cytarabine 1 g/m2 per 2-hour infusion twice daily on days 1 to 5, with a second identical course as consolidation #1, daunorubicin reduced to 2 days in consolidation #2, and optional cytarabine alone as consolidation #3. Few patients have been treated according to other clinical study protocols, and few patients up to 75 years have had dose reductions or modifications, primary treatment with hypomethylating agents, or palliation only (see details in Juliusson et al16 ). Patients diagnosed before 2019 did not receive FLT3-inhibitor as part of primary therapy. Patients were considered for alloSCT in first complete remission if medically fit, except for patients with favorable risk genetics (ie, core-binding factor AML or NPM1mut without FLT3ITD). During recent years, assessment of measurable residual disease by multicolor flow cytometry has been used to guide the indication for alloSCT. Current data were extracted from the registry in August 2019. Standard robust statistical analyses (parametric and nonparametric analyses, χ2 analysis, log rank analysis of overall survival [OS]) were performed using Statistica software version 12 (Tulsa, OK). In addition, parallel statistics on survival including hazard ratios with 95% confidence intervals were performed with R software (version 3.6.1). Studies on data from the AML Registry are approved by ethics review.
Results
At data extraction, the database contained 4716 patients overall (median age, 71 years; mean, 68 years) diagnosed since 2007, of whom 200 had acute promyelocytic leukemia (APL). For the purpose of this study, we selected the 2665 patients without APL who were younger than 75 years (median age, 63 years; mean age, 59 years) at diagnosis. Of them, 1827 (69%) had de novo AML, 1482 were males (56%) and 1183 females, and 2225 (83%) received intensive treatment, 119 (4%) primary hypomethylation, and the remaining palliation only.
Representativity of the study population
We identified 1461 patients with molecular results on both FLT3ITD and NPM1, 14 patients with only NPM1 results, and 95 patients with only FLT3ITD results. These molecularly characterized patients constitute 59% of the overall population, 73% of those younger than 60 years, 57% of patients aged 60 to 69 years, and 41% of those aged 70 to 74 years, as well as 67% of all receiving intensive treatment (76% of those <60 years, 60% of those 60-74 years) and 20% of those receiving nonintensive treatment (32% <60 years, 18% of those 60-74 years). Patients with de novo AML had molecular reports in 70% overall (80% if <60 years, 71% if 60-69 years, 51% if 70-74 years), and 33% of patients with secondary AML. There was no difference in molecular testing by sex. The median observation time of 640 surviving patients with reported data on FLT3 and NPM1 status was 4.6 years (quartile range, 2.0-7.6 years).
Sex differences
AML is overall more common in males,16 but more female than male patients with AML had FLT3ITD and/or NPM1mut. FLT3ITD was found in 202 (29%) of 704 females vs 185 (22%) of 852 males (χ2 analysis P = .0015), and NPM1mut in 240 (36%) of 667 females vs 216 (27%) of 808 males (P = .0001). FLT3ITD was more common in de novo AML (339/1278, 27%) than in secondary AML (48/278, 17%), but the sex difference remained in secAML (female, 32/133, 24%; male, 16/145, 11%; P = .004). FLT3ITD/NPM1mut double mutation was found in 111 (17%) of 661 females and 93 (12%) of 800 males (P = .005), and correspondingly more males than females were double negative (male, 513/800, 64%; female, 348/661, 53%; P < .0001).
FLT3ITD was more common in younger (<60 years) than in older (60-74 years) males (25% vs 19%; P = .044), whereas there was no such age difference in females (30% vs 27%; P = .4). Thus, FLT3ITD was more common in older females than in older males (female, 27%; male, 19%; P = .0048).
NPM1mut was more common in females than in males among both younger (female, 34%; male, 25%; P = .012) and older (female, 37%; male, 28%; P = .004) patients. NPM1mut was also more common in de novo (400/1210, 33%) than in secAML (56/265, 21%; P = .0001), and the sex difference of NPM1mut was similar in de novo and secAML (de novo: female, 38%; male, 29% [P = .002]; and secAML: female, 28%; male, 15% [P = .008]). Clinical data by mutation status and age are shown in Table 1.
Clinical and laboratory data at diagnosis in patients with AML (APL excluded) according to FLT3-ITD, NPM1, and age
| Number/median values | No FLT3-ITD | FLT3-ITD | ||||||
|---|---|---|---|---|---|---|---|---|
| NPM1-mutated | NPM1 wildtype | NPM1-mutated | NPM1 wildtype | |||||
| <60 y | 60-74 y | <60 y | 60-74 y | <60 y | 60-74 y | <60 y | 60-74 y | |
| Number of patients | 100 | 144 | 386 | 475 | 95 | 109 | 83 | 69 |
| Sex, male/female, n | 48/52 | 68/76 | 223/163 | 290/185 | 41/54 | 52/57 | 46/37 | 32/37 |
| Median age, y | 51 | 67 | 47 | 67 | 51 | 67 | 44 | 67 |
| de novo AML, % | 92 | 85 | 89 | 69 | 91 | 87 | 96 | 75 |
| Intensive treatment, % | 100 | 94 | 97 | 89 | 95 | 97 | 100 | 96 |
| ECOG/WHO PS, % 0-II | 96 | 93 | 95 | 95 | 88 | 90 | 96 | 91 |
| Hemoglobin, g/L | 93 | 94 | 95 | 95 | 94 | 96 | 92 | 94 |
| Platelet count, ×109/L | 91 | 81 | 62 | 73 | 54 | 62 | 45 | 72 |
| WBC, ×109/L | 14.8 | 21.1 | 6.3 | 4.0 | 49.7 | 59.2 | 44.9 | 39.7 |
| Blood blast count, ×109/L | 3.7 | 5.9 | 2.6 | 0.8 | 23.4 | 22.0 | 17.2 | 13.7 |
| Bone marrow blasts, % | 50 | 59 | 50 | 42 | 70 | 72 | 70 | 54 |
| LDH, ukat/L (normal <4.2) | 7.0 | 6.4 | 5.9 | 5.2 | 10.1 | 10.1 | 10.1 | 9.7 |
| Death <28 days, % | 6.0 | 4.2 | 1.3 | 5.7 | 5.3 | 11.0 | 0 | 8.7 |
| Allogeneic SCT, % | 32 | 12.5 | 55 | 21.7 | 57 | 18.3 | 71 | 26.1 |
| Median OS, y | >12 | 3.3 | 10.1 | 1.3 | 1.9 | 2.0 | 1.9 | 1.0 |
ECOG/WHO, Eastern Cooperative Oncology Group/World Health Organization; LDH, lactic dehydrogenase; PS, performance status.
Patients with FLT3ITD were slightly younger than those without FLT3ITD (mean, 59.0 vs 61.6 years, also including evaluated patients aged 75 years and older; P = .023). The mean age of patients with and without NPM1mut was 61.9 and 60.4 years, respectively (P = .059) compared with 72.9 years for patients who did not have mutation analysis performed.
Survival by mutation status, age, and sex
The main purpose of this study was to evaluate the effect of FLT3ITD and NPM1mut on OS in different patient subsets (Table 2). We could validate the established knowledge that FLT3ITD marks poor prognosis, and NPM1mut good prognosis in the absence of FLT3ITD. However, unexpectedly, we found a strong age dependence: FLT3ITD was a strong marker for poor survival in young patients (<60 years), but not in older patients (60-74 years; Figure 1). In contrast, NPM1mut was a strong marker for good survival in older patients, but not in young patients (Figure 2). To avoid bias from patient selection and treatment intensity, we performed corresponding studies in patients with de novo AML given intensive treatment, with very similar results (Table 2; supplemental Data).
OS (median in years, and 3-year percentage) by age, sex, genetic, and clinical subgroup
| Patients and comparison | <60 y | 60-74 y | <60 vs 60-74 y | |||||||||
|---|---|---|---|---|---|---|---|---|---|---|---|---|
| n | Median OS, y | 3-year OS, % | P | HR (95% CI) | n | Median OS, y | 3-year OS, % | P | HR (95% CI) | P | HR (95% CI) | |
| All | ||||||||||||
| FLT3-ITD | 194 | 1.87 | 45.1 | .00008 | 1.60 (1.26-2.02) | 193 | 1.33 | 34.8 | .50226 | 1.07 (0.88-1.30) | .00083 | 1.54 (1.10-1.99) |
| No FLT3-ITD | 515 | >8 | 63.4 | 1 | 654 | 1.49 | 35.5 | 1 | 0 | 2.32 (1.96-2.74) | ||
| Males | ||||||||||||
| FLT3-ITD | 95 | 2.55 | 50.0 | .0194 | 1.49 (1.06-2.09) | 90 | 1.4 | 35.4 | .91331 | 0.99 (0.75-1.29) | .0099 | 1.63 (1.12-2.37) |
| No FLT3-ITD | 287 | >8 | 65.2 | 1 | 380 | 1.45 | 33.5 | 1 | 0 | 2.48 (1.99-3.10) | ||
| Females | ||||||||||||
| FLT3-ITD | 99 | 1.72 | 40.8 | .0012 | 1.71 (1.23-2.38) | 103 | 1.13 | 34.3 | .25597 | 1.17 (0.89-1.55) | .0344 | 1.46 (1.03-2.06) |
| No FLT3-ITD | 228 | >5 | 61.1 | 1 | 274 | 1.64 | 38.4 | 1 | 0 | 2.10 (1.63-2.70) | ||
| De novo/intensive Tx | ||||||||||||
| FLT3-ITD | 176 | 2.23 | 48.2 | .00005 | 1.70 (1.31-2.19) | 155 | 1.6 | 39.5 | .19051 | 1.16 (0.93-1.46) | .0033 | 1.52 (1.15-2.02) |
| No FLT3-ITD | 454 | >12 | 66.9 | 1 | 455 | 2.16 | 42.8 | 1 | 0 | 2.24 (1.84-2.71) | ||
| All | ||||||||||||
| NPM1 mut | 198 | 11.83 | 59.4 | .5428 | 0.92 (0.72-1.19) | 258 | 2.92 | 49.8 | 0 | 0.64 (0.53-0.78) | .00038 | 1.63 (1.24-2.14) |
| NPM1 wt | 473 | 7.53 | 58.3 | 1 | 546 | 1.24 | 28.9 | 1 | 0 | 2.33 (1.97-2.76) | ||
| Males | ||||||||||||
| NPM1 mut | 92 | >12 | 68.2 | .1126 | 0.73 (0.49-1.08) | 124 | 3.01 | 50.6 | .00086 | 0.64 (0.49-0.83) | .00061 | 2.07 (1.35-3.17) |
| NPM1 wt | 270 | 7.53 | 58.4 | 1 | 322 | 1.28 | 28.4 | 1 | 0 | 2.29 (1.83-2.85) | ||
| Females | ||||||||||||
| NPM1 mut | 106 | 5.02 | 52.3 | .5158 | 1.12 (0.80-1.58) | 134 | 2.92 | 49.0 | .00233 | 0.65 (0.50-0.86) | .095 | 1.35 (0.95-1.94) |
| NPM1 wt | 203 | 7.47 | 58.1 | 1 | 224 | 1.23 | 29.8 | 1 | 0 | 2.36 (1.82-3.07) | ||
| De novo/intensive Tx | ||||||||||||
| NPM1 mut | 175 | 11.83 | 62.2 | .5643 | 0.92 (0.69-1.22) | 210 | 3.01 | 50.5 | .01514 | 0.76 (0.61-0.95) | .00012 | 1.80 (1.33-2.43) |
| NPM1 wt | 420 | >8 | 61.7 | 1 | 367 | 1.7 | 36.8 | 1 | 0 | 2.16 (1.78-2.63) | ||
| All | ||||||||||||
| FLT3-ITD/NPM1 mut | 95 | 1.93 | 46.1 | .00035 | 1.45 (1.05-1.99) | 109 | 1.99 | 46.7 | .00002 | 0.76 (0.59-0.99) | .1401 | 1.32 (0.91-1.91) |
| FLT3-ITD/NPM1 wt | 83 | 2.06 | 44.3 | 1.56 (1.13-2.17) | 69 | 0.96 | 18.9 | 1.25 (0.94-1.66) | .00029 | 2.03 (1.37-3.00) | ||
| No FLT3-ITD/NPM1 mut | 100 | >12 | 71.5 | 0.69 (0.48-1.01) | 144 | 3.3 | 51.5 | 0.59 (0.46-0.76) | .00025 | 2.13 (1.41-3.23) | ||
| Double negative | 386 | 10.06 | 61.5 | 1 | 475 | 1.28 | 30.6 | 1 | 0 | 2.45 (2.03-2.97) | ||
| De novo/intensive Tx | ||||||||||||
| FLT3-ITD/NPM1 mut | 81 | 11.83 | 52.0 | .0002 | 1.44 (0.99-2.07) | 93 | 2.38 | 48.8 | 0.01237 | 0.90 (0.67-1.20) | .0515 | 1.51 (0.99-2.30) |
| FLT3-ITD/NPM1 wt | 80 | 2.06 | 44.7 | 1.85 (1.32-2.61) | 51 | 1.21 | 24.2 | 1.40 (0.99-1.97) | .0059 | 1.82 (1.18-2.79) | ||
| no FLT3-ITD/NPM1 mut | 92 | >12 | 71.3 | 0.77 (0.51-1.15) | 114 | 3.3 | 52.0 | 0.73 (0.54-0.97) | .00027 | 2.26 (1.44-3.54) | ||
| Double negative | 337 | >10 | 66.0 | 1 | 314 | 1.85 | 39.1 | 1 | 0 | 2.36 (1.88-2.95) | ||
P values and hazard ratios calculated with R statistics comparing OS by genetic subset within each patient selection, and in the far-right column by age group within a genetic subset.
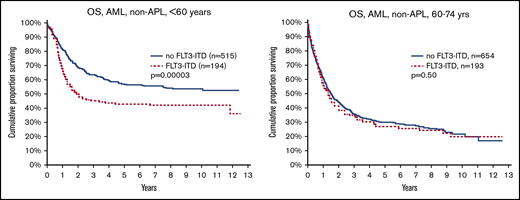
OS by FLT3-ITD and age. (Left) Aged younger than 60 years (P = .00003). (Right) Aged 60 to 74 years (P = .5).
OS by FLT3-ITD and age. (Left) Aged younger than 60 years (P = .00003). (Right) Aged 60 to 74 years (P = .5).
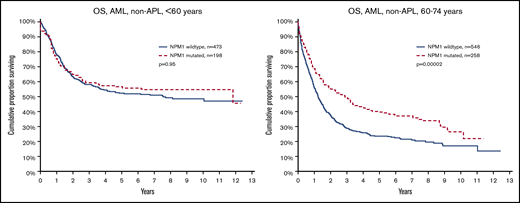
OS by NPM1 mutation and age. (Left) Aged younger than 60 years (P = .95). (Right) Aged 60 to 74 years (P = .00002).
OS by NPM1 mutation and age. (Left) Aged younger than 60 years (P = .95). (Right) Aged 60 to 74 years (P = .00002).
It is also well established that NPM1mut is associated with good survival in the absence of FLT3ITD. This was confirmed and was valid in both young and old patients (Figure 3). We also show that FLT3ITD in the absence of NPM1mut constitutes the worst survival in both younger and older patients. The beneficial effect of NPM1mut on survival was greater in old compared with young patients, both in patients with FLT3ITD (group C vs D; old, P = .049 vs young, P = .6) and in those without (group A vs B; P < .0001 vs P < 0.049, respectively), and the adverse effect of FLT3ITD was greater in young as compared with old patients both in patients with NPM1mut (group C vs A; young, P = .0005 vs old, P = .073) and NPM1wt (group D vs B; P = .018 vs P = .37, respectively; Figure 3).
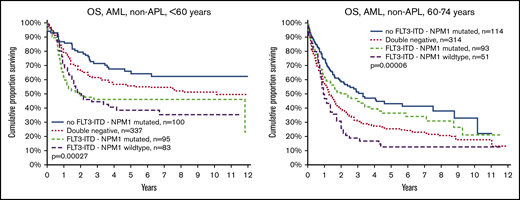
OS by FLT3-ITD, NPM1 mutation, and age. (Left) Aged younger than 60 years. (Right) Aged 60 to 74 years. Log rank analyses of survival in patients younger than 60 years (left): comparison of all 4 subsets (P = .00027); no FLT3-ITD/NPM1 mutated (group A) vs double-negative (group B; P = .049); FLT3-ITD/NPM1 mutated (group C) vs FLT3-ITD/NPM1 wild type (group D; P = .62); group A vs C (P = .0005); group A vs D (P = .0004); group B vs C (P = .007); group B vs D (P = .018). Patients aged 60 to 74 years (right): all 4 subsets (P < .0001, group A vs B (P < .0001), group C vs D (P = .049), group A vs C (P = .073), group A vs D (P < .0001), group B vs C (P = .10), and group B vs D (P = .37).
OS by FLT3-ITD, NPM1 mutation, and age. (Left) Aged younger than 60 years. (Right) Aged 60 to 74 years. Log rank analyses of survival in patients younger than 60 years (left): comparison of all 4 subsets (P = .00027); no FLT3-ITD/NPM1 mutated (group A) vs double-negative (group B; P = .049); FLT3-ITD/NPM1 mutated (group C) vs FLT3-ITD/NPM1 wild type (group D; P = .62); group A vs C (P = .0005); group A vs D (P = .0004); group B vs C (P = .007); group B vs D (P = .018). Patients aged 60 to 74 years (right): all 4 subsets (P < .0001, group A vs B (P < .0001), group C vs D (P = .049), group A vs C (P = .073), group A vs D (P < .0001), group B vs C (P = .10), and group B vs D (P = .37).
Patients with the double mutation FLT3ITD/NPM1mut had similar survival in the younger and the older age groups (Table 2), whereas age had a strong negative effect in double-negative patients (Figure 3). Thus, the prognostic rank between double mutated vs double negative was reversed when comparing young and old patients.
FLT3ITD had stronger negative effect on survival in females (all aged <75 years; P = .0057) than in males (P = .28). In contrast, NPM1mut had a stronger positive effect on survival in males (aged <75 years; P = .0024) than in females (P = .21; supplemental Data). No other significant differences in survival by sex were found.
Blood counts by genetics and age
FLT3ITD is, as previously well documented, strongly associated with increased leukemia cell counts, such as WBC counts at diagnosis, blood blast counts, and bone marrow blast percentages. We here also found higher lactate dehydrogenase and lower platelet counts in patients with FLT3ITD (Table 3).
Laboratory data at diagnosis by FLT3-ITD, NPM1, and age (mean with standard deviation), with Kolmogorov-Smirnov 2-sample test for pairwise comparison of genetic subgroups A, B, C, and D
| No FLT3-ITD | FLT3-ITD | |||||||||||||||||||
|---|---|---|---|---|---|---|---|---|---|---|---|---|---|---|---|---|---|---|---|---|
| NPM1-mut | NPM1 wt | NPM1-mut | NPM1 wt | <60 y | 60-74 y | |||||||||||||||
| Group | A | B | C | D | A vs B | A vs C | A vs D | B vs C | B vs D | C vs D | A vs B | A vs C | A vs D | B vs C | B vs D | C vs D | ||||
| Age group, y | <60 | 60-74 | <60 | 60-74 | <60 | 60-74 | <60 | 60-74 | ||||||||||||
| Age, y | 48 (10) | 67 (4) | 44 (11) | 67 (4) | 48 (9) | 67 (4) | 42 (13) | 67 (4) | * | * | ** | |||||||||
| Hemoglobin, g/L | 95 (20) | 95 (20) | 95 (23) | 94 (19) | 96 (22) | 98 (22) | 91 (22) | 92 (18) | ||||||||||||
| Platelet count, ×109/L | 109 (86) | 106 (113) | 98 (104) | 100 (103) | 86 (87) | 87 (82) | 71 (73) | 99 (86) | * | *** | **** | |||||||||
| WBC, ×109/L | 33 (47) | 49 (70) | 26 (53) | 19 (39) | 80 (78) | 74 (67) | 71 (79) | 68 (77) | ** | **** | *** | **** | **** | **** | **** | **** | **** | |||
| Blood blast count, ×109/L | 14 (27) | 28 (54) | 17 (45) | 9 (28) | 53 (71) | 48 (57) | 49 (65) | 32 (47) | **** | **** | **** | **** | **** | **** | **** | **** | ||||
| Bone marrow blasts, % | 51 (24) | 56 (25) | 53 (25) | 47 (23) | 66 (23) | 66 (24) | 65 (22) | 57 (22) | *** | *** | **** | **** | *** | * | **** | *** | * | |||
| LDH, ukat/L (normal <4.2) | 8 (5) | 9 (8) | 10 (17) | 8 (12) | 14 (12) | 8 (13) | 13 (9) | 11 (11) | * | **** | *** | **** | **** | *** | **** | * | **** | **** | ||
Values are mean (standard deviation).
P < .05.
P < .01.
P < .005.
P < .001.
Patients with NPM1mut also had higher WBC as compared with NPM1wt patients, but this was not seen in patients with concomitant FLT3ITD (Table 3).
There were few differences by age in the effect of mutation status on blood counts (ie, groups A vs D and groups A vs B in Table 3). Nonparametric analyses (Kolmogorov-Smirnov 2-test analysis) of laboratory values comparing younger and older patients did not show significant differences in any of the 4 molecular subgroups (A-D).
Discussion
FLT3ITD and NPM1mut are late-occurring events in the development of AML, not found in preleukemia1,2 and rarely in myelodysplastic syndromes, and thus mostly regarded as markers for de novo AML. The established knowledge that FLT3ITD with wild-type NPM1 confers poor prognosis, whereas the reverse, NPM1mut without FLT3ITD, is favorable was true in all ages, and is currently included in the European Leukemia Net risk classification.12 However, the main finding in our study was that FLT3ITD is a strong marker for poor survival only in the young, whereas NPM1mut strongly predicts good survival only in the older (60-74 years) patients. These are new findings that likely have clinical impact. Our data are strong, with large patient numbers and highly significant differences using robust standard statistics, and importantly, this study is the only population-based study so far with focus on the dominant age group (ie, patients older than 60 years).
FLT3ITD was, in 2010, reported to have a negative effect on survival also in older patients18 ; however, this was based on 41 study patients aged 60-69 years with FLT3ITD, who had an exceptionally poor survival (median OS, 0.6 years; 3-year OS, 10%) as compared with 137 such patients in our present study (median OS, 1.4 years; 3-year OS, 38%). Furthermore, 131 patients with FLT3ITD, aged 61-70 years, who received intensive therapy according to Swedish guidelines without a kinase inhibitor seem to have a similar 2-year survival as 86 such patients treated with intensive therapy and midostaurin in a recent German-Austrian study19 (46.0% vs 45.6%). One possible explanation might be that older Swedish AML patients mostly receive intensive treatment similar to younger patients,16 which is more intensive than most published protocols. As a consequence, clinical studies with targeted and other therapies should be performed in all relevant age groups, and extrapolation of data from studies in young patients will not suffice for older patients.
Previous studies have identified the NPM1mut/FLT3wt group as a good prognosis subset, with no specific rank between the other molecular subsets,6,7,9,20 whereas Gale et al also identified a worse prognosis in FLT3ITD/NPM1wt,11 as seen in our study. The ranking between double mutated vs double negative was not consistent in previous studies, and we here show that this could be a result of the age distribution of the study population (Figure 3). Together, our results indicate biological differences of these genetic markers in young as compared with older patients.
Both FLT3ITD and NPM1mut seem to increase AML cell proliferation, leading to higher leukemia cell counts (Table 1), despite their different prognostic effect. Outcome is clearly more dependent on the biology of the AML cells than the resulting blood counts. The mix between the molecular subsets in unselected AML populations may result in a low effect of WBC and blast counts in prognostic models. There were few differences in the clinical and diagnostic data between the age groups, and these differences can hardly explain any of the outcome differences by age.
Both FLT3ITD and NPM1mut are more common in females than in males. We could here find a modest effect of sex on outcome (supplemental Data), where FLT3ITD had more prognostic effect in females, and NPM1mut a stronger effect in males. It should be noted that the beneficial effect of midostaurin in the RATIFY study on FLT3-mutated patients was restricted to males.13 Whether this finding is relevant to ours needs further evaluation. Our present study included patients diagnosed since 2007, and we have recently shown an equal outcome by sex during the most recent decade16 ; no molecular data from previous decades have been available.
Our results are not the consequence of patient selection or different management. The Swedish AML Registry is population-based with high coverage (>98%) and low drop-out rates, with full survival update. Similar data on survival by age and molecular subgroups was found in separate analysis of patients with de novo AML and intensive treatment (supplemental Data). However, not all patients have been sampled for gene mutations, as data emerge from the patient population clinically selected for the recommended opinion that molecular analyses would be helpful in deciding on initial therapy, indication for alloSCT, and deep monitoring of remission status. Most evaluated patients have been treated with a high-intensity treatment, with high response and survival rates,16 as compared with published multicenter trials. Our results are clearly also influenced by the high transplantation rates, where presence of FLT3ITD has been a strong indication for alloSCT (Table 1). Among patients younger than 70 years, 47% of the patients with FLT3ITD had alloSCT reported as compared with 39% in those without FLT3ITD (P = .013). In contrast, patients with NPM1mut had alloSCT in 33% as compared with 46% in patients with NPM1wt (P < .0001). However, the high alloSCT rate still failed to neutralize the adverse prognostic effect of FLT3ITD in young patients.
Age is a strong prognostic marker in AML.14-16 Our current data, however, indicate that age has a limited effect on survival in AML with FLT3ITD/NPM1mut, and consequently, even greater effect in AML lacking both these molecular drivers. Broad molecular analyses on large clinical study samples have recently evaluated the incidence of further combinations of gene mutations,21 mainly of epigenetic modifiers that may develop early in preleukemic states.2 Most patients with NPM1mut were thus found to have mutations also involving DNMT3A, IDH1/2, and/or TET2. In patients with the subset NPM1/DNMT3A double mutation, FLT3ITD had a strong prognostic effect, but not so in other combinations of NPM1 and DNMT3A.21 In the study by Papaemmanuil et al,21 only 11% of the patients were older than 60 years, and thus not were representative for the overall AML population. We do not yet have access to other molecular results, but this will be an important task for the future. Our data could fit into the concept that younger double-negative (FLT3wt/NPM1wt) patients have a higher incidence of favorable molecular and/or cytogenetic changes (eg, core-binding factor leukemias), whereas older double-negative patients more often have other driver mutations and dysplastic changes leading to poor outcome, such as del(5q), monosomy 7, TP53 mutations, and complex and monosomal karyotypes. We have recently participated in a large international cooperative study to assess the influence of cytogenetic abnormalities on the prognostic effect of NPM1mut.22 A similar effort is likely required and warranted to analyze the additional effect of cytogenetic risk on outcome by FLT3 status, including the effect of FLT3ITD allelic ratio.
In conclusion, about 30% of the non-APL adult patients with AML who are younger than 75 years had NPM1mut, and 25% had FLT3ITD,14 with a female dominance, in contrast to the greater proportion of males in the 60% of patients with double-negative AML. FLT3ITD was slightly more common in younger patients, whereas NPM1 had a similar prevalence in all ages. FLT3ITD indicated poor prognosis in younger (<60 years) and female patients, but less so in older (60-74 years) and male patients, whereas the favorable effect of NPM1 was greater in older and male patients than in younger and female patients. In patients with strong driver mutations (ie, FLT3ITD/NPM1mut double mutated), age did not affect survival. This implies a biological age-dependent interaction between these genetic markers that is likely to be of clinical relevance.
Acknowledgments
Patient data are reported by all Swedish hematologists and other healthcare professionals involved in the diagnosis and treatment of AML in Sweden. Monitoring of registry data are performed by Ann-Katrin Andersson and Ann-Sofi Hörstedt at Regional Cancer Center South, Lund, Sweden, and Oskar Hagberg performed R statistics (Table 2).
The Swedish AML registry is supported by the Swedish Association of Local Authorities and Regions, Region Skåne and Regionalt Cancercentrum Syd, and the research by the Swedish Cancer Society.
Authorship
Contribution: G.J. designed study, performed analyses, and wrote the manuscript; and all authors contributed to the Swedish AML registry and critically reviewed and approved manuscript.
Conflict-of-interest disclosure: The authors declare no competing financial interests.
Correspondence: Gunnar Juliusson, Department of Hematology, Skåne University Hospital, S-221 85 Lund, Sweden; e-mail: gunnar.juliusson@med.lu.se.

