

Key Points
SCS of patients with AML detected clones at remission that expanded into the dominant clone at relapse.
SCS provides unique information on mutation cooccurrence and clonal diversity that may enhance MRD evaluation.

Abstract
Although most patients with acute myeloid leukemia (AML) achieve clinical remission with induction chemotherapy, relapse rates remain high. Next-generation sequencing enables minimal/measurable residual disease (MRD) detection; however, clinical significance is limited due to difficulty differentiating between pre-leukemic clonal hematopoiesis and frankly malignant clones. Here, we investigated AML MRD using targeted single-cell sequencing (SCS) at diagnosis, remission, and relapse (n = 10 relapsed, n = 4 nonrelapsed), with a total of 310 737 single cells sequenced. Sequence variants were identified in 80% and 75% of remission samples for patients with and without relapse, respectively. Pre-leukemic clonal hematopoiesis clones were detected in both cohorts, and clones with multiple cooccurring mutations were observed in 50% and 0% of samples. Similar clonal richness was observed at diagnosis in both cohorts; however, decreasing clonal diversity at remission was significantly associated with longer relapse-free survival. These results show the power of SCS in investigating AML MRD and clonal evolution.
Introduction
Acute myeloid leukemia (AML) is an aggressive neoplasm characterized by multiple molecular abnormalities often occurring in a complex combination of related subclones.1,2 AML is primarily a disease of the elderly and affects ∼20 000 adults annually in the United States. Patients are usually treated with aggressive induction chemotherapy followed by either consolidation chemotherapy or allogeneic hematopoietic cell transplantation. After induction, the majority of patients achieve a complete remission (CR) as defined by normalization of peripheral blood counts with <5% blasts detected in the bone marrow. However, patients often relapse, with resistant disease resulting in a 28.3% 5-year overall survival (OS).3 Increasing evidence suggests that minimal/measurable residual disease (MRD), which is considered persistent leukemia below the 5% threshold seen by morphologic evaluation, is an independent risk factor for relapse and could therefore guide disease management.4
MRD can be assessed by using multiparameter flow cytometry or molecular assays. Flow cytometry–based assays use leukemia-associated aberrant immunophenotypes to detect MRD; they can be highly variable and operator dependent. Regardless, immunophenotype-based MRD detected at a 0.1% threshold has been associated with significantly shorter relapse-free survival (RFS) and OS.5,6 Of interest, most cases of AML contain genetic mutations that can serve as clonal markers for MRD. Molecular techniques including real-time quantitative polymerase chain reaction (PCR) and next-generation sequencing (NGS) can therefore provide more specific assays for MRD detection. Furthermore, because the mutational landscape of AML is diverse, NGS can identify personalized MRD markers for potentially all AML cases by using a panel of AML-associated mutations. Large cohort studies using variant allele frequency (VAF) cutoffs between 0.02% and 2.5% have identified an association between MRD detection and RFS and OS.7-9
One complication of NGS MRD detection is that common mutations in DNMT3A, TET2, and ASXL1 may occur in pre-leukemic clonal hematopoiesis that persist in remission but do not reflect relapse-causing leukemic cells. Indeed, exclusion of common mutations associated with clonal hematopoiesis can enhance the detection of clinically relevant MRD and the predictive power for RFS.9 In addition, bulk NGS is unable to resolve clonal architecture, particularly with rare variants detected in remission, which can impair the ability to identify relapse-causing MRD. Moreover, characterizing changes in clonal heterogeneity or diversity is important for studying tumor evolution and its association with treatment resistance or relapse.10
To address these limitations, we used single-cell sequencing (SCS) to evaluate the clonal dynamics of AML from diagnosis to remission to relapse. We defined clones as cells containing the same mutations, and MRD as clones observed at remission that expand into the dominant clone at relapse. SCS was not only able to recapitulate bulk sequencing VAFs but was also able to determine the clonal architecture at each time point, providing insight into the clinical relevance of cooccurring clonal mutations. Indeed, SCS detected and quantified both pre-leukemic clonal hematopoiesis clones and frankly leukemic clones that eventually dominated at relapse. We observed complex patterns of clonal heterogeneity and evolution that may predispose patients to relapse after undergoing conventional chemotherapy and/or allogeneic hematopoietic cell transplantation. Our findings provide preliminary clinical validation of the utility of high throughput SCS for MRD evaluation.
Methods
Patients and cell samples
Human AML samples were obtained from patients at the Stanford Medical Center with informed consent, according to Institutional Review Board–approved protocols (Stanford Institutional Review Board Nos. 18329 and 6453). Collection occurred between 2011 and 2015, with samples of bone marrow and peripheral blood obtained from 14 patients with de novo AML, aged 22 to 71 years. Mononuclear cells were isolated from patient samples by using Ficoll separation (GE Healthcare Life Sciences) and cryopreserved in liquid nitrogen in 90% fetal bovine serum and 10% dimethyl sulfoxide. Analysis was performed on freshly thawed cells. To be included in the analysis, patients had to either have achieved CR or CR with incomplete hematologic recovery defined according to the 2017 European LeukemiaNet (ELN) guidelines.11 All patients were treated with an anthracycline- and cytarabine-containing induction regimen.
Targeted NGS of leukemia-associated mutations
Targeted amplicon sequencing was performed as previously described on select cases.12 VAF was defined as: (mutant read no.)/(wild-type read no. + mutant read no.). Read counts and primer pairs are available on request. Each locus was sequenced to >500-fold coverage for >99% of assays.
Single-cell sequencing
SCS was performed by using Mission Bio’s Tapestri AML platform, which assesses hotspot mutations in human AML (supplemental Figure 4), according to the manufacturer’s protocol. Briefly, cryopreserved bone marrow aspirates or peripheral blood mononuclear cells were thawed and counted before loading ∼150 000 cells onto the Tapestri microfluidic cartridge. Cells were emulsified with lysis reagent and incubated at 50°C before thermally inactivating the protease. The emulsion containing the lysates from protease-treated single cells was then microfluidically combined with targeted gene-specific primers, PCR reagents, and hydrogel beads carrying cell-identifying molecular barcodes using the Tapestri instrument and cartridge. After generation of this second, PCR-ready emulsion, molecular barcodes were released in a photocleavable manner from the hydrogels with UV exposure, and the emulsion was thermocycled to incorporate the barcode identifiers into amplified DNA from the targeted genomic loci. The emulsions were then broken by using perfluoro-1-octanol, and the aqueous fraction was diluted in water and collected for DNA purification with SPRI beads (Beckman Coulter). Sample indexes and Illumina adaptor sequences were then added via a 10-cycle PCR reaction, and the amplified material then underwent SPRI purification a second time.
After the second PCR and SPRI purification, full-length amplicons were ready for quantification and sequencing. Libraries were analyzed on a DNA 1000 assay chip with a Bioanalyzer (Agilent Technologies) and sequenced on an Illumina MiSeq with 150 bp paired-end chemistry. A single sequencing run was performed for each barcoded single-cell library prepared with our microfluidic workflow. A 5% ratio of PhiX DNA was used in the sequencing runs. Sequencing data were processed by using Mission Bio’s Tapestri Pipeline (trim adapters using Cutadapt, sequence alignment to human reference genome hg19 [GRCh37.p13], barcode demultiplexing, cell-based genotype calling using GATK/Haplotypecaller).
Data were analyzed by using Mission Bio’s Tapestri Insights software package and R software (R Foundation for Statistical Computing). In detail, the following quality metrics were used to filter for high-quality cells and variants: genotype quality score (default >30), reads per cell per amplicon (>10), mutant genotype VAF (>20%), germline variants as confirmed according to the ClinVar database (false), and variants mutated <1% in all samples in a series (diagnosis, remission, and relapse).13 These filters affect different parameters such as variant quality score, read depth per variant per cell, and limit of detection. Only variants with clinical implications known from databases (ClinVar and dbSNP) or verified from previous bulk NGS sequencing are selected to identify groups of cells that can be aggregated as arising from a single clone. The number of clones can vary depending on parameter selections during filtering. In all the selected clones, variants assigned a heterozygous genotype must have a VAF between 40% and 60%, <1% to be wild-type, and >95% to be homozygous. The allele dropout (ADO) rate was estimated with data generated from ADO amplicons. ADO amplicons span polymorphic regions of the genome with a minor allele frequency of 50% (= heterozygous variants). If at least 3 of 10 ADO amplicons were called heterozygous in at least 75% of all cells, the average fraction of cells with homozygous calls (reference or mutant) represents the ADO rate. In addition, during secondary analysis, potential ADO clones were identified and removed by using variant-specific performance metrics, including reads per cell and genotype quality scores.
Genomic landscape and mutation cooccurrence analysis
Data were initially analyzed by using the Tapestri Insights software package, which grouped cells with unique mutations. After filtering for high-quality variants, groups of cells with unique mutations were labeled as a distinct clone, creating 97 clones across all 38 samples. These clones were subsequently analyzed as individual observations, or “patients,” and the mutation landscape across all clones was evaluated by using maftools R package. Cooccurrence analysis was performed among these clones, and results were compared with per-patient VAFs inferred from SCS and bulk NGS from The Cancer Genome Atlas (TCGA).14 Only mutations identified from the targeted sequencing panel were included. Spearman correlation coefficients were determined by using the corrplot R package and displayed with adjusted P values in terms of the false discovery rate.
Mutation order analysis
The clonality patterns for each sample (n = 38) were determined by using previously described methods.15 Ancestral (d1) and descendant (d2) driver mutations were identified for each sample, and an edge between these 2 driver pairs was constructed (outgoing for d1 and ingoing for d2). In- and out-degrees for each driver event were counted, and hypothesis testing was performed by applying 2-tailed binomial tests to infer whether a driver event was early (greater number of out- vs in-degrees). Q values were determined in terms of the false discovery rate to account for multiple hypothesis testing using the qvalue R package.
Clonal diversity and evolution analysis
Shannon, Simpson, Menhinick, Margalef, and Richness indices were determined by using the clonal composition for each sample. Values at diagnosis and remission, and changes in values from diagnosis to remission, were calculated for each patient. Random forest regression was performed against RFS; it identified the Menhinick richness index at diagnosis and the change in the Simpson diversity index as the most influential features. Cox proportional hazards models were determined by using the Menhinick index at diagnosis, change in Simpson index, age, sex, and 2017 ELN risk category against RFS. The significance for each variable was assessed by using the Wald statistic. Median values for richness and change in diversity were used as split points for patient classification. End points (eg, RFS) were defined according to standard criteria. The Kaplan-Meier method and log-rank test were used for unadjusted analyses of time-to-event end points. Analysis was performed by using vegan, randomforest, randomForestExplainer, tree, survival, and survminer R packages.
Statistical methods
Statistical comparisons were performed by using the Wilcoxon rank sum test for continuous variables and Fisher’s exact test for categorical variables, unless otherwise noted.
Results
Fourteen patients with de novo AML who achieved a CR after combination induction chemotherapy were consented for institutional tissue banking and included in our cohort. Consecutive peripheral blood or bone marrow samples were sequenced at diagnosis, remission, and relapse for 10 relapsed patients and at diagnosis and remission for 4 nonrelapsed patients (n = 38 samples). SCS was performed by using a microfluidic, droplet-based platform (Tapestri).16 The Tapestri AML panel included hotspot regions of 19 recurrently mutated genes (supplemental Figure 4), and the study cohort was selected for those patients with mutations in these genes as determined by bulk NGS. A total of 310 737 cells were sequenced (average 8177 prefiltered cells per sample), with an average of 2829 reads per cell (supplemental Table 1). Cell capture rates were between 5% and 10%; however, the microdroplet cell capture process is not selective or size dependent, and should not introduce biases in resolving the underlying clonal architecture.17 The limit of detection of the platform is 0.1%, which has been reported with cell line spike-in experiments prepared at different ratios.13
Baseline patient characteristics are provided in Table 1, and additional clinical information is provided in supplemental Table 2. Targeted SCS identified additional variants that were not detected by bulk NGS but was unable to detect variants in ASXL1 for 3 patients. A majority of patient samples contained an NPM1 mutation (23 of 38 [60.5%]), which was identified in 51% of clones across all patient samples. FLT3 mutations were identified in 31.6% (12 of 38) of patient samples and were present in 26% of all clones. The mutational frequencies were generally similar to those identified from the TCGA cohort (supplemental Figure 1).14 The mutation landscape from SCS is illustrated in Figure 1A for all unique clones identified (n = 97) across all patient samples.
Patient characteristics
| ID | Age, y/sex | Cytogenetics Dx/Rem | 2017 ELN | SCS genotype Dx | SCS genotype Rem | SCS genotype Rel | Resp status | Disease detected | Treatment (Ind/Cons/HCT) |
|---|---|---|---|---|---|---|---|---|---|
| SU067 | 54/Female | NK | Fav | PTPN11_A72T* NPM1L287inc(TCTG)* | WT1_ins(GCACA)† NPM1L287inc(TCTG)† | WT1_ins(GCACA)* NPM1L287inc(TCTG)* | Relapse | Yes | IC/MEC/No |
| SU291 | 35/Female | Trisomy 8/NK | Int | NPM1L287inc(TCTG)* IDH2_R140W* | IDH1_R132H* NPM1L287inc(TCTG)* FLT3_D835Y* | Relapse | No | DC/HIDAC/No | |
| SU320 | 70/Male | NK | Int | IDH2_R140Q* KRAS_G12V* NPM1L287inc(TCTG)* FLT3_I836del(GAT)* FLT3_D835Y† | IDH2_R140Q | IDH2_R140Q* KRAS_G12V* NPM1L287inc(TCTG)* | Relapse | No | DC/IDAC/No |
| SU353 | 66/Male | NK | Adv | FLT3-ITD* NPM1L287inc(TCTG)* ASXL1-Q377‡ | FLT3-ITD NPM1L287inc(TCTG) | FLT3-ITD* NPM1L287inc(TCTG)* | Relapse | Yes | DC/No/No |
| SU359 | 22/Female | NK | Int | WT1_R375ins* NRAS_G12S* KRAS_G12D* FLT3-itd* | WT1_R375ins NRAS_G12S | Relapse | Unknown | IC/HIDAC/No | |
| SU372 | 54/Female | NK | Int | DNMT3A_R882H* IDH1_R132H* NPM1L287inc(TCTG)* PTPN11_P491L* | DNMT3AR882H IDH1_R132H NPM1L287inc(TCTG) PTPN11_P491L | DMNT3A_R882H* IDH1_R132H* NPM1L287inc(TCTG)* PTPN11_P491L* | Relapse | Yes | IC/HIDAC/No |
| SU442 | 61/Male | NK | Int | FLT3-ITD* NPM1L287inc(TCTG)* | FLT3-ITD* NPM1L287inc(TCTG)* | Relapse | No | DC/IC | |
| SU484 | 71/Male | NK | Adv | IDH2_R140Q* FLT3_V592D* NPM1L287inc(TCTG)* ASXL1-G996R‡ | IDH2_R140Q | IDH2_R140Q* NPM1L287inc(TCTG)* | Relapse | No | DC/No/No |
| SU654 | 47/Male | NK | Fav | DNMT3A_R882C* IDH1_R132C* NPM1L287inc(TCTG)* NRAS_G13D* | DNMT3A_R882C IDH1_R132C | DNMT3A_R882C IDH1_R132C NPM1L287inc(TCTG) NRAS_G13D | Relapse | Yes | DC/HIDAC |
| SU674 | 51/Female | NK | Int | DNMT3A_R882C FLT3-ITD NPM1L287inc(TCTG) | DNMT3A_R882C | DNMT3A_R882C FLT3-ITD NPM1L287inc(TCTG) | Relapse | No | IC/IC/Yes |
| SU218 | 40/Female | NK | Fav | NPM1L287inc(TCTG)* | NPM1L287inc(TCTG) | Remission (2695) | DA/HIDAC/No | ||
| SU290 | 64/Female | NK | Int | GATA2_A318T* NRAS_G12D* FLT3-ITD(8286)* FLT3-ITD(8315)* NRAS_G13D† NRAS_Q61R† KIT_D816H* NRAS_G12C† NRAS_Q61H† KIT_N822K* | GATA2_A318T† | Remission (2697) | GCLAC/GCLAC/Yes | ||
| SU564 | 58/Male | 45X, t(8;21)(q22;q22)/NK | Fav | KIT_N822K* | KIT_N822k | Remission (2061) | DC/HIDAC/No | ||
| SU380 | 23/Male | inv(16) | Adv | KIT_T417P* NRAS_Q61R* NRAS_G13D* ASXL1S577‡ | Remission (2061) | IC/HIDAC/No |
Unmarked variants are from samples without an NGS comparison. “Disease detected” indicates that the dominant clone at relapse was identified at remission.
Adv, advanced; C, cytarabine; Cons, consolidation; D, daunorubicin; Dx, diagnosis; E, etoposide; Fav, favorable; GCLAC, clofarabine, cytarabine, and filgrastim; HCT, hematopoietic cell transplantation; HIDAC, high-dose cytarabine; I, idarubicin; IDAC, intermediate-dose cytarabine; Ind, induction; Int, intermediate; M, mitoxantrone; NK, normal karyotype; Rel, relapse; Rem, remission; Resp, response.
Variants detected by both SCS and NGS.
Variants detected by SCS only.
Variants detected by NGS only.
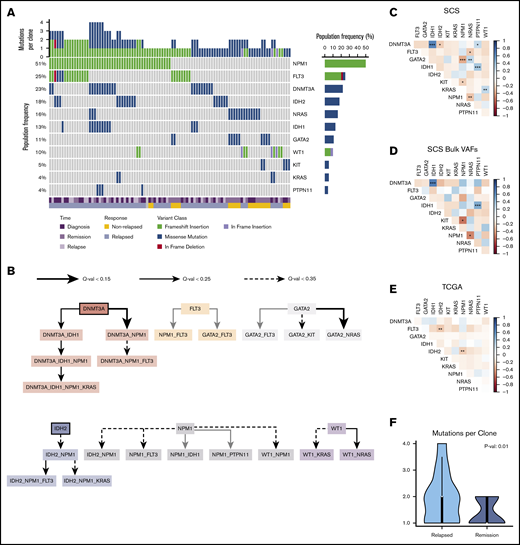
Mutation landscape as observed by using SCS. (A) Somatic mutations are shown across 97 unique clones (columns) from 38 unique patient samples. Columns are coded at the bottom based on clinical time point and response status. (B) Mutation order was determined by temporally directed edges when 2 putative driver mutations were identified per sample. Mutation ordering was counted across all samples. The edges infer temporal sequences of mutations, and significance is illustrated by Q values (as discussed in "Methods"). Mutations that are likely to occur early are emphasized with a thick border. The resulting graph illustrates the most likely temporal acquisition of mutations across all samples. (C) Cooccurrence of mutations identified from SCS were assessed by using Spearman correlation matrices across all 97 unique clones. (D) Cooccurrence of mutations is indicated from aggregated per-patient VAFs calculated from SCS data. (E) Cooccurrence of mutations from bulk NGS VAFs obtained from the TCGA is indicated for the Tapestri panel mutations. The plot shows cooccurrence (blue) or exclusivity (red) with color coding and the false discovery rate–corrected statistical significance. (F) Comparison of the number of mutation variants per cell identified by using SCS at diagnosis based on the patient’s eventual response. *P < .1; **P < .05; ***P < .01.
Mutation landscape as observed by using SCS. (A) Somatic mutations are shown across 97 unique clones (columns) from 38 unique patient samples. Columns are coded at the bottom based on clinical time point and response status. (B) Mutation order was determined by temporally directed edges when 2 putative driver mutations were identified per sample. Mutation ordering was counted across all samples. The edges infer temporal sequences of mutations, and significance is illustrated by Q values (as discussed in "Methods"). Mutations that are likely to occur early are emphasized with a thick border. The resulting graph illustrates the most likely temporal acquisition of mutations across all samples. (C) Cooccurrence of mutations identified from SCS were assessed by using Spearman correlation matrices across all 97 unique clones. (D) Cooccurrence of mutations is indicated from aggregated per-patient VAFs calculated from SCS data. (E) Cooccurrence of mutations from bulk NGS VAFs obtained from the TCGA is indicated for the Tapestri panel mutations. The plot shows cooccurrence (blue) or exclusivity (red) with color coding and the false discovery rate–corrected statistical significance. (F) Comparison of the number of mutation variants per cell identified by using SCS at diagnosis based on the patient’s eventual response. *P < .1; **P < .05; ***P < .01.
Using SCS data, we accurately resolved the clonal dynamics during treatment and studied the timing of mutations in driver genes by analyzing their cooccurrence patterns. We systematically annotated ancestor–descendant relationships for each pair of mutations that cooccurred in at least 1% of sequenced cells in a sample. Mutations were classified as occurring early or late by comparing frequencies of ancestral and dependent mutations, and mutation order was inferred with statistical significance by using the binomial test (as discussed in "Methods"). This analysis identified DNMT3A and IDH2 as early mutations, although there were cases in which IDH2 seemed to have been acquired after NPM1 (Figure 1B). Variants in NPM1 and FLT3 were acquired at intermediate stages, whereas mutations in RAS and KIT were predominantly late acquisitions. SCS provided increased power to identify cooccurring mutations compared with inference from bulk VAFs and with NGS results from the TCGA cohort (Figure 1C-E). For patients who eventually relapsed, there was a greater number of clonal cooccurring variants at diagnosis (2 vs 1; P = .01) (Figure 1F).
In comparing the results of serial specimen SCS from individual patients, we identified clonal mutations in remission for 8 of 10 patients who eventually relapsed (80%) and for 3 of 4 patients who never relapsed (75%) (Table 1). Furthermore, the predominant clone detected at relapse was identified in 4 of 9 evaluable remission samples (44%) for patients with relapsed disease. Thus, SCS detected relapse-causing MRD in primary patient specimens at a higher frequency than published results using NGS (64 of 340 [19%]), albeit in a smaller cohort.9 The lower limit of detection by SCS was similar to published results using the Tapestri platform.17
We have previously reported on the heterogeneity of relapsed AML, showing multiple distinct patterns of clonal evolution, including relapse with the predominant clone from diagnosis, with a minor subclone from diagnosis, or with further clonal evolution.18 Individual cases from the current cohort also display diverse patterns of clonal evolution with similar patterns as our initial findings. Case SU067 (Figure 2A) revealed a clonal switch from a predominant NPM1/PTPN11 mutant clone at diagnosis to one with NPM1 and WT1 mutations at relapse. The relapse-initiating clone was detected at 0.24% (10 of 4136 cells) in remission. From our previous analysis of this case, we were not able to detect this variant at remission using targeted NGS, indicating the potential utility of SCS for MRD detection. Case SU291 (Figure 2B) revealed a clonal switch from an NPM1/IDH2 mutant clone to an NPM1/IDH1/FLT3–tyrosine kinase domain cooccurring clone. SCS of remission samples at days 26 and 359 did not detect any MRD. Case SU320 (Figure 2C) revealed that the dominant IDH2/NPM1/KRAS mutant clone at relapse was a minor clone at diagnosis, and day 30 SCS did not detect any MRD. Case SU353 (Figure 2D) relapsed with the same major clone identified at diagnosis, and sequencing of the remission sample identified MRD at 1.3% (82 of 6442 cells). Our previous analysis also revealed that this patient had MRD as measured by targeted amplicon sequencing of the flow-sorted CD34+ compartment at remission. Although this patient was in hematologic CR, the high level of MRD was prognostic, as the patient relapsed early at day 62. Case SU654 (Figure 2E) also relapsed with the same dominant clones from diagnosis. Sequencing of the remission sample identified MRD at 0.12% (10 of 7840 cells), as well as clonal mutations in DNMT3A and IDH1. In contrast to patient SU353, patient SU654 relapsed later on day 248. Case SU674 (Figure 2F) relapsed with a minor clone from diagnosis, and no MRD was detected according to SCS of the remission sample.
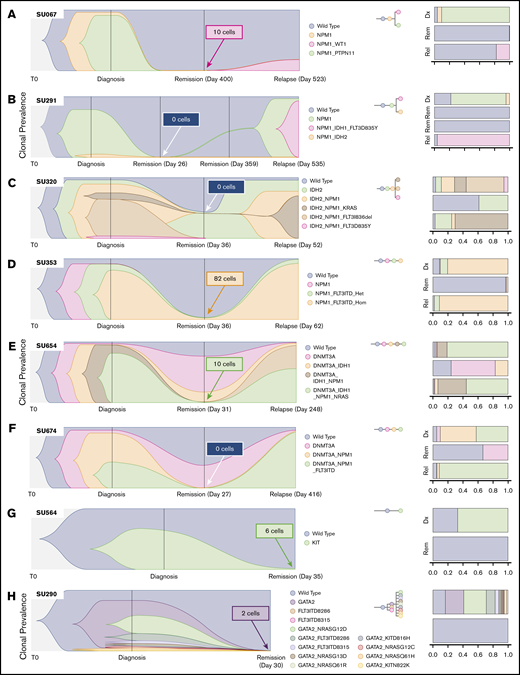
SCS reveals heterogeneous clonal evolution in AML. Fishplots illustrating the diversity in clonal evolution captured by SCS at diagnosis, remission, and relapse. Selected cases from patients who relapsed (A-F) and from patients who remained in remission (G-H). For each remission sample, the total number of cells identified as the dominant clone at relapse (or at diagnosis for SU564 and SU290) are indicated in the box. Stacked bar graphs are displayed on the right to illustrate cell frequencies at the respective time points.
SCS reveals heterogeneous clonal evolution in AML. Fishplots illustrating the diversity in clonal evolution captured by SCS at diagnosis, remission, and relapse. Selected cases from patients who relapsed (A-F) and from patients who remained in remission (G-H). For each remission sample, the total number of cells identified as the dominant clone at relapse (or at diagnosis for SU564 and SU290) are indicated in the box. Stacked bar graphs are displayed on the right to illustrate cell frequencies at the respective time points.
SU320, SU654, and SU674 illustrate cases in which pre-leukemic clonal hematopoiesis can be distinguished from MRD by using SCS. Figure 2G-H illustrates 2 cases of patients who remained in remission. In case SU564 at diagnosis, only one mutation in KIT was detected, although it is likely other mutations were present not covered by the Tapestri panel. Regardless, the KIT mutation was measured at 0.08% (6 of 7179 cells) at remission. In case SU290, there were 12 unique clones identified at diagnosis, and the GATA2 mutation was measured at 0.02% (2 of 8726 cells) in the remission sample by using SCS. Of note, we observed AML clones at remission for 2 cases that continue in remission, SU380 and SU218 (supplemental Figure 2), which was likely due to early sampling. The remaining cases are illustrated in supplemental Figure 2. All together, these cases illustrate the wide diversity of clonal architecture and responses to treatment observed in patients with AML and illustrate the utility of SCS to directly identify MRD in some patients who subsequently relapse.
Clonal evolution in AML can be influenced by both anti-leukemia therapies and the microenvironment; however, AML evolution during treatment and its clinical relevance are not completely understood. Modeling clonal heterogeneity using richness and diversity metrics can provide insights into cancer evolution and its association with treatment resistance and disease relapse.10 Richness indices such as the Menhinick index quantify the number of different clones in a sample. Diversity indices such as the Simpson index account for not only the number of observed clones but also the relative abundance of each clone. A sample with equal clonal frequencies would be considered more diverse than another sample containing a dominant clone within the same total number of clones. To evaluate the importance of clonal richness and diversity in AML, we characterized the cellular composition of patient samples at diagnosis and remission by using standard ecosystem metrics (Figure 3A; supplemental Figure 3). Among these metrics, random forest regression against RFS identified the Menhinick richness index at diagnosis and the change in the Simpson diversity index from diagnosis to remission as the 2 most influential features. Cox proportional hazards analysis identified the change in the Simpson diversity index as the most significant measurement associated with RFS (hazard ratio, 0.077; P = .03) compared with the Menhinick richness index, age, 2017 ELN risk category, and sex (Figure 3B). The 2017 ELN molecular risk stratification11 was determined by using mutation data from both SCS and bulk NGS. Stratifying patients based on changes in clonal diversity (supplemental Table 4) showed an RFS benefit for patients who had a greater decrease in diversity at remission (median not reached vs 224 days; P = .008) (Figure 3C). These findings suggest that although patients with AML have a similar degree of clonal richness at diagnosis, a greater decrease in leukemia diversity at remission may be associated with longer RFS. Stability or increase in AML diversity may therefore be a measure of leukemia fitness and treatment resistance. Overall, this analysis is limited by small patient numbers, the size of the genetic panel, and possible ADO; however, the results suggest that clonal diversity and mutation cooccurrence are clinically relevant in AML.
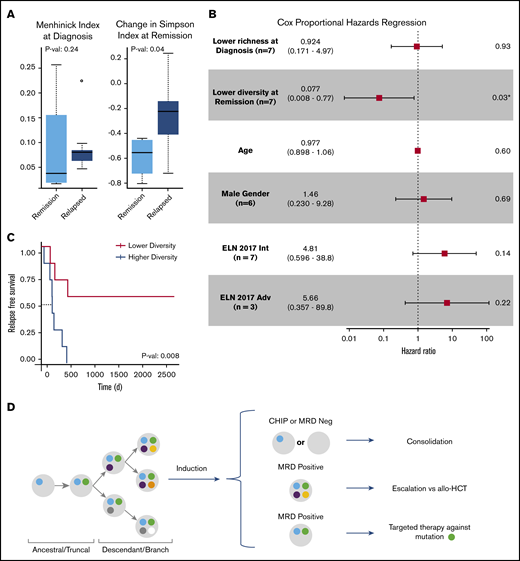
Clinical significance of clonal diversity in AML. (A) Comparison of clonal richness quantified by using the Menhinick index and change in clonal diversity from diagnosis to remission quantified according to the Simpson index based on patient response. (The circle indicates an outlier.) (B) Cox proportional regression model comparing clonal richness, change in clonal diversity, age, sex, and the 2017 ELN risk category. The ELN risk categories are compared with favorable risk. P values were calculated based on the Wald test. (C) Kaplan-Meier analysis showing RFS of 14 de novo AML patients stratified according to change in diversity at remission compared with diagnosis. P value was calculated by using the log-rank test. (D) Schema for future single-cell MRD-guided clinical strategies. *P value of .03 is significant (P < .05). Adv, adverse; allo-HCT, allogeneic hematopoietic cell transplant; Int, intermediate.
Clinical significance of clonal diversity in AML. (A) Comparison of clonal richness quantified by using the Menhinick index and change in clonal diversity from diagnosis to remission quantified according to the Simpson index based on patient response. (The circle indicates an outlier.) (B) Cox proportional regression model comparing clonal richness, change in clonal diversity, age, sex, and the 2017 ELN risk category. The ELN risk categories are compared with favorable risk. P values were calculated based on the Wald test. (C) Kaplan-Meier analysis showing RFS of 14 de novo AML patients stratified according to change in diversity at remission compared with diagnosis. P value was calculated by using the log-rank test. (D) Schema for future single-cell MRD-guided clinical strategies. *P value of .03 is significant (P < .05). Adv, adverse; allo-HCT, allogeneic hematopoietic cell transplant; Int, intermediate.
Discussion
Over the past 30 years, significant advances have been made in defining the prognosis of AML patients based on clinicopathologic features, cytogenetic aberrations, and somatic mutations. Increasingly, the heterogeneity of AML at the molecular level has become apparent. Although molecular and cytogenetic profiling continues to provide the framework for risk stratification used to guide management of AML,11 there has been inconsistency in NGS-based classification systems used in clinical practice. Here we show that SCS of AML samples at diagnosis, remission, and relapse allowed for quantification of cooccurring mutation variants, differentiation of pre-leukemic clonal hematopoiesis from relapse-causing clones, identification of clinically relevant MRD, and investigation of evolutionary trajectories during treatment.
In our data set, persistence of clones with multiple variants during remission was associated with increased risk of relapse. This finding is similar to previously published work using bulk NGS assays with a sensitivity of 0.2% that showed that persistence of ≥2 lesions was associated with significantly reduced leukemia-free survival and OS.19 This finding raises the possibility that identification of complex or multiple clones during remission increases the risk of resistant disease and future relapse. Multiple groups are exploring personalized digital droplet PCR assays for MRD tracking to leverage this finding.20-22 However, SCS offers the opportunity to avoid needing a personalized approach, while also allowing for identification of de novo or previously undetectable somatic variants. SCS also provides direct quantification of clonal diversity, and modeling clonal evolution may be relevant for understanding AML outcomes (Figure 3). Additional research is needed to verify these observations in a larger cohort of patients.
Our results suggest a possible increased sensitivity of SCS compared with NGS for identifying persistent mutations, with 80% of relapsed cases having ≥1 mutation identified at the remission time point. Previous studies have reported 40% to 51.4% of patients with persistent somatic variants at time of remission according to bulk NGS sequencing.8,9 This is in part due to the higher limit of detection of previously implemented NGS techniques, which usually detected VAFs down to 2%.
Considerable interest exists regarding the use of MRD status in AML to help inform escalation or de-escalation therapeutic strategies (eg, initiating or intensifying treatment of patients with MRD to lessen risk of relapse). Furthermore, assessment of MRD status as a surrogate end point for clinical trials is also being actively explored. SCS may add to this field by allowing for unequivocal resolution of clonal structure at time of remission, as well as allowing for identification of previously difficult-to-detect emerging resistant clones.17 This approach may allow for better risk stratification and lead to proactive treatment of persistent or emerging treatment-resistant clones (Figure 3D). We also note that single-cell analysis can provide unambiguous resolution of persistent pre-leukemic clonal hematopoiesis from leukemic clones at remission. In addition, our observations support the need for serial sampling to assess MRD, as cases SU380 and SU218 had detectable variants at remission but remained in remission. In fact, the recent consensus document by the ELN MRD working party recommends serial measurements of MRD during treatment.4
Current limitations of SCS for MRD detection include limited single-cell throughput, relatively small panel size, ADO, and inability to multiplex DNA with other analytes. Addressing these limitations may allow for SCS to further increase the limit of detection and improve specificity to allow for routine application of this technology in clinical research and practice. Already, decreasing costs of sequencing have allowed for expansion of the current panel from 19 genes (50 amplicons) to 47 genes (330 amplicons) in the next iteration. In addition, multi-omics capabilities of the current platform have been shown, possibly allowing for further characterization of MRD clones beyond just the DNA mutational signature.23 Finally, the recent ELN MRD Working Party recommendations suggest that at least 10 000 cells, if not upward to 500 000 cells, are needed to accurately detect MRD lower than the 0.01% threshold.4 Improvements in microfluidics technology have allowed for increased throughput to >50 000 cells,24 theoretically decreasing the limit of detection into the range of most error-corrected NGS and digital droplet PCR technologies.25 However, significant improvements are needed in SCS throughput to accurately quantify clinical MRD.
In conclusion, SCS-based evaluation of MRD during CR may allow for identification of AML patients at high risk for relapse. It specifically enabled the differentiation of pre-leukemic clonal hematopoiesis from leukemic clones responsible for relapse. In addition, greater clonal complexity was associated with reduced elimination of all malignant clones with standard chemotherapy regimens. This observation was associated with a higher risk of resistant clones persisting and eventually causing clinical relapse. Based on these results, SCS MRD assessment may be useful for informing treatment decisions in first remission and for following clonal evolution during and after conventional therapy in AML.
For original data, please contact the corresponding author (Ravindra Majeti; e-mail: rmajeti@stanford.edu).
Acknowledgments
The authors thank Mission Bio for providing assistance with data generation, data analysis, and data interpretation, and for comments on the manuscript. In particular, they thank Jose Jacob for his generous support on sample preparation, sample processing, data processing, and data analysis. They also thank their patients and the Stanford Hematology Division Tissue Bank for providing the specimens.
This work was supported by the National Institutes of Health, National Cancer Institute (R01-CA188055, R.M.), the Ludwig Institute for Cancer Stem Cell Research and Medicine (R.M.), and the Advanced Residency Training Program at Stanford (A.E.). R.M. is a Leukemia & Lymphoma Society Scholar.
Authorship
Contribution: A.A., A.E., and R.M. were responsible for conception and design, and developed the methodology; B.C.M., M.L., M.S., and R.M. were responsible for acquisition of data (eg, provided animals, acquired and managed patients, provided facilities); A.A., A.E., J.G.R., T.K., and R.M analyzed and interpreted the data (eg, statistical analysis, biostatistics, computational analysis); A.A., A.E., T.K., J.G.R., M.R.C., and R.M. wrote, reviewed, and/or revised the manuscript; and A.A., A.E., T.K., M.S., M.R.C., and R.M. provided administrative, technical, or material support (ie, reporting or organizing data, constructing databases).
Conflict-of-interest disclosure: R.M. is a founder, consultant, equity holder, and serves on the Board of Directors of Forty Seven Inc. A.A. is an employee of Natera and a consultant for Mission Bio and Notable Labs. B.C.M. is an employee of Roche/Genentech. The remaining authors declare no competing financial interests.
Correspondence: Ravindra Majeti, Division of Hematology, Department of Medicine, Lokey Stem Cell Research Building, 265 Campus Dr, G3021B, Stanford, CA 94305-5461; e-mail: rmajeti@stanford.edu.

