

Key Points
WASP and Mst1 are essential for the central and peripheral development of B cells as well as the early activation of B cells.
WASP and Mst1 regulate the localization and function of each other, and Mst1 inhibits the expression of WASP via WASP-interacting protein.

Abstract
Mst1 is a serine/threonine kinase involved in cell survival, proliferation, apoptosis, and tumorigenesis. In mice, Mst1 regulates actin dynamics required for T-cell adhesion and migration, which correlate with thymic egress and entry into lymphatic tissue. The role of Mst1 in B cells and how it may control actin-dependent processes has not been well characterized. Wiskott-Aldrich syndrome protein (WASP) deficiency only moderately affects development and B-cell receptor (BCR) signaling, suggesting WASP likely associates with other molecules. We investigated whether Mst1 associates with WASP to regulate B-cell development and activation. Experimenting on Mst1/WASP double knockout (DKO) mice, we found a severe defect in the bone marrow B-cell development, and BCR signaling in the DKO mice was severely reduced. Even though WASP or Mst1 could influence the early B-cell activation, we found that the early activation events such as B-cell spreading, BCR clustering, and BCR signaling were much more impaired in the B cells from DKO mice. Furthermore, reciprocal regulation between Mst1 and WASP was observed in WASP and Mst1 KO mice, whereby the localization and function of phosphorylated WASP were affected in Mst1 KO mice. Most importantly, Mst1 inhibits the expression of WASP by decreasing the expression of WASP-interacting protein. Interestingly, we also found that WASP deficiency in patients and mice interferes with phosphorylated Mst1 localization and therefore function in B cells. Overall, our study provides a partner for WASP to regulate B-cell development and BCR signaling, as well as the reciprocal regulating molecular mechanism of one another.
Introduction
Both Mst1 and Wiskott-Aldrich syndrome (WAS) protein (WASP) are reportedly involved in regulating the actin cytoskeleton of lymphocytes.1,2 Patients with mutations in STK4 (Mst1) present with a primary immunodeficiency, including bacterial and viral infections, mucocutaneous candidiasis, and cutaneous warts, and some of the STK4/Mst1-deficient patients are reported to suffer from neutropenia; patients with WAS are characterized by thrombocytopenia, eczema, recurrent infection, autoimmunity, and susceptibility to tumors.3-7 Mst1 is a kinase with high homology to Ste20 in yeast.8,9 Mammalian Ste20 kinase is involved in cell proliferation, differentiation, apoptosis, and tumorigenesis. Mst1 is highly expressed in lymphocytes, and studies have shown that Mst1 knockout (KO) mice have lymphopenia of T cells and deficiencies in thymic output, which are due to defects in actin regulation that affect T-cell adhesion and migration.10
Evidence suggests that Mst1 plays a role in mediating actin-dependent processes. Mst1 directly phosphorylates L-plastin, an actin-binding protein that plays an important role in the stability of lamellipodia.11 Mst1 also regulates the spatial location of myosin IIA and thus regulates cell contraction.12 In T cells, Mst1 binds to and activates the guanine exchange factor Dock8 by activating the downstream substrate Mob1,13 which regulates many of the actin-dependent processes.14 This evidence suggests that Mst1 may control the function of B lymphocytes through synergistic action with actin and its regulators. WASP is an important actin nucleation–promoting molecule that binds actin and initiates the actin polymerization process by binding to the Arp2/3 complex. Loss of WASP expression or functional alteration can lead to a rare X-linked primary immunodeficiency disease (WAS).15,16 As a result of its expression in the hematopoietic system and involvement in the regulation of actin cytoskeletal remodeling, WASP is important for almost all immune cells and has very complex functions.2 Mst1 is likely to interact with WASP to regulate lymphocyte function, as it is necessary for many actin-mediated cellular events involved in survival and growth.
In the current study, we generated WASP and Mst1 double KO (DKO) mice and found that WASP and Mst1 are indispensable for the development of bone marrow B cells and activation of B-cell receptor (BCR) signaling. Interestingly, we found that WASP and Mst1 reciprocally regulate the localization and function of each other, both in mice and in patients with WAS. Mechanistically, Mst1 inhibits the expression of WASP via decreasing the transcription of WASP-interacting protein (WIP).
Materials and Methods
Patients and control subjects
Three Chinese patients with WAS mutations from 3 unrelated Chinese families were enrolled in the current study. The diagnosis of WAS was made based on clinical signs and symptoms, WAS mutations, and WASP expression measured according to flow cytometry analysis, as previously described.17 Healthy control subjects consisted of 3 age-matched subjects (3-month, 2-year, and 1-month). Human B cells were enriched by using a B-cell isolation kit (Miltenyi Biotec) or sorted with flow cytometry with anti-CD19 antibody (BD Biosciences). Signed consent from all the children’s parents was obtained under the approval of the Ethics Committee of the Children’s Hospital of Chongqing Medical University.
Mice
Dock8 KO mice were generated by using the TALEN technique (Shanghai Biomodel Organism Science & Technology Development Co., Ltd.). The first exon of Dock8 was chosen for TALEN-induced mutagenesis, and the absence of 34 bp nucleotides in the coding frame of exon 1 led to the open reading frame shift of Dock8 (supplemental Table 1). WASP KO mice of C57 background were provided by Dr. S. Snapper (Harvard Medical School), and C57 wild-type (WT) mice were from The Jackson Laboratory. Mst1 KO mice on a 129-SvEv background were provided by Wufan Tao from Fudan University.18 Mst1/WASP DKO mice were generated by crossing WASP KO mice with Mst1 KO mice. The data were generated from breeding littermates of Mst1+/− WAS+/− (female) with Mst1+/− WASY/– (male) for littermate control mice (Mst1+/+ WASY/+), WASP KO mice (Mst1+/+ WASY/–), Mst1 KO mice (Mst1−/− WASY/+), and DKO mice (Mst1−/− WASY/–). Because the background of the WASP KO and Mst1 KO mice is different, the color of the littermates is variable. However, the influences of the different background on the mice were reduced to a minimum by detecting the littermate control in the experiments.
Splenic B cells were isolated as previously described.19 All animal work was reviewed and approved by the Institutional Animal Care and Usage Committee of Children’s Hospital of Chongqing Medical University.
Phosflow
Enriched B cells from peripheral blood mononuclear cells were incubated with the monobiotinylated Fab′ fragment of anti-human immunoglobulin G + M (mB-Fab′-anti-Ig) plus streptavidin at 37°C for varying lengths of time. Cells were fixed with Phosflow Lyse/Fix buffer, followed by permeabilization with Phosflow Perm buffer III (BD Biosciences) and staining with the following antibodies: phosphorylated p44/42 MAPK (pErk1/2, Thr202/Tyr204; Cell Signaling Technology), phosphorylated Btk (pBtk,Y551; Abcam), phosphotyrosine (pY; MilliporeSigma), phosphorylated Mst1 (pMst1, T183; Abcam), and phosphorylated CD19 (pCD19, Y531; Abcam).
Preparation of antigen-tethered planar lipid bilayers and monobiotinylated Fab′ antibody and model antigens
The planar lipid bilayer was prepared as previously described.20,21 Liposomes were made by sonicating 1,2-dioleoyl-sn-glycero-3-phosphocholine and 1,2-dioleoyl-sn-glycero-3-phosphoethanolamine-cap-biotin (Avanti Polar Lipids) in a 100:1 molar ratio in phosphate-buffered saline at a lipid concentration of 5 mM. Aggregated liposomes were removed by ultracentrifugation and filtration. Coverslip chambers (Nalge Nunc International) were coated with the planar lipid bilayer by incubating with the liposomes (0.05 mM) for 10 minutes. After extensive washes, the coated coverslip chamber was incubated with 1 μg/mL of streptavidin (Jackson ImmunoResearch Laboratories), followed by 2 μg/mL of AF546-mB-Fab′-anti-Ig mixed with 8 μg/mL of mB-Fab′-anti-Ig antibody.
Total internal reflection fluorescence microscopy
Images were acquired by using a Nikon A1R confocal and total internal reflection fluorescence microscopy system on an inverted microscope (Nikon Eclipse Ti-PFS), equipped with a 100×, NA 1.49 Apochromat TIRF objective (Nikon Instruments), an iXon EM-CCD camera (Andor), and 3 solid-state lasers of wavelengths 405, 488, and 546 nm.
To image intracellular molecules, B cells were incubated with an antigen-tethered lipid bilayer at 37°C for varying lengths of time. Cells were then fixed with 4% paraformaldehyde, permeabilized with 0.05% saponin, and stained for phosphorylated Btk (pBtk, Y551; Abcam) and phosphorylated CD19 (pCD19, Y531; Abcam). The B-cell contact area was determined by using interference reflection microscopy images and NIS-Elements AR 3.2 software. The mean fluorescence intensity (MFI) of each staining in the B-cell contact zone was determined by using NIS-Elements AR 3.2 software. Background fluorescence generated by an antigen tethered to lipid bilayers in the absence of B cells or secondary antibody controls was subtracted. For each set of data, >50 individual cells from 2 or 3 independent experiments were analyzed. Images were acquired according to a previous protocol.22
Coimmunoprecipitation Analysis
For coimmunoprecipitation, purified splenic B cells (5 × 10⁶) were incubated with or without Biotin-conjugated F(ab')2 Anti-Mouse Ig (G+M) (115-066-068; Jackson ImmunoResearch Laboratories) for indicated times in the presence or absence of streptavidin. Cells were then lysed with a 150 μL radioimmunoprecipitation assay lysis buffer (Beyotime, P0013B) containing protease inhibitor cocktail (G2006; Servicebio).The cell lysates were incubated with 1 μg of antibody anti-Mst1 or control immunoglobulin G (sc-2025; Santa Cruz Biotechnology) for 2 hours at 4°C, followed by incubation with 30 μL protein G Seph agarose (10253638; GE Healthcare) overnight at 4°C. After washing 5 times with 1× phosphate-buffered saline, the IP agarose was denatured by boiling in 30 μL 1× sodium dodecyl sulfate loading buffer for 10 minutes at 95°C. Denatured agarose was examined by western blotting with anti-Dock8 monoclonal antibodies (1:1000 dilution).
Treatment of latrunculin B and cytochalasin D
B cells were pretreated with latrunculin B (10 μM) or cytochalasin D (2 μM) (Calbiochem) for 30 minutes at 37°C before incubation with antigens in the presence of latrunculin B or cytochalasin D.
Real-time polymerase chain reaction
Total RNA was extracted from 1 × 10⁶ B cells by using a superpure total RNA extraction kit (Bioteke). The RNA was purified by a 1:5 volume mixture of chloroform and 1 mL 70% ethanol, and then dissolved in the water. The quality of the purified RNA was detected by using the Nanodrop 2000 spectrophotometer (Thermo Fisher Scientific). The extracted total RNA was reverse transcribed into complementary DNA by using the PrimeScript RT reagent Kit (Takara Bio), and the expression level was quantified by using CFX96 Touch equipment (Bio-Rad) with an RT-PCR Assay Kit (Qiagen). Glyceraldehyde-3-phosphate dehydrogenase was used to standardize messenger RNA (mRNA) expression.
Statistical analysis
Statistical significance was assessed with a Student t test or 1-way analysis of variance with the Tukey test by using Prism software (GraphPad Software) when multiple groups were compared. The P values were determined in comparison with WT or control B cells or healthy controls (*P < .01, **P < .001).
Results
WASP and Mst1 deficiency causes a growth lag and inflammation
To determine the physiological role of WASP and Mst1, the WASP KO mice were crossed with Mst1 KO mice to generate WASP/Mst1 DKO mice. By measuring the length of the body, we found that DKO mice had severe growth retardation in contrast with WT, WASP KO, and Mst1 KO mice at 2 months of age (Figure 1A). As with WASP KO and Mst1 KO mice, DKO mice had splenomegaly (Figure 1B; supplemental Figure 1A). DKO mice had severe lymphocytic infiltration in the liver and complete destruction of the villi structure in the colon compared with the other genotypes, and they exhibited glomerular enlargement and lymphocytic infiltration similar to that of WASP and Mst1 KO mice (Figure 1C). These results suggest that WASP and Mst1 both control growth development and inflammation in mice.
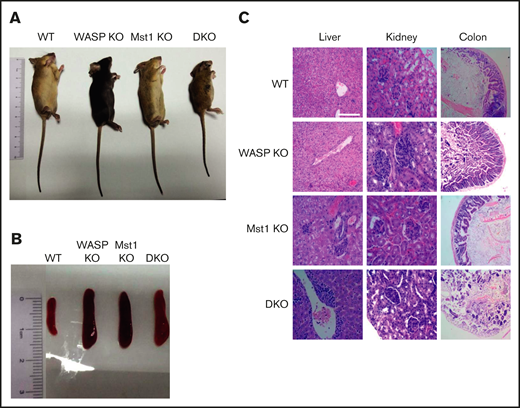
WASP and Mst1 are indispensable for the development of the mice and critical to control inflammation. Images of WT, WASP KO, Mst1 KO, and DKO mice (A) and spleen (B) from WT, WASP KO, Mst1 KO, and DKO mice at 2 months of age (n = 5). (C) Hematoxylin and eosin staining of liver, kidney, and colon from WT, WASP KO, Mst1 KO, and DKO mice. Data are representative of at least 2 independent experiments.
WASP and Mst1 are indispensable for the development of the mice and critical to control inflammation. Images of WT, WASP KO, Mst1 KO, and DKO mice (A) and spleen (B) from WT, WASP KO, Mst1 KO, and DKO mice at 2 months of age (n = 5). (C) Hematoxylin and eosin staining of liver, kidney, and colon from WT, WASP KO, Mst1 KO, and DKO mice. Data are representative of at least 2 independent experiments.
WASP and Mst1 deficiency blocks the development of bone marrow and peripheral B cells
To determine whether Mst1 or WASP are involved in the regulation of bone marrow B-cell development, we examined the bone marrow B-cell development in WT, WASP KO, Mst1 KO, and DKO mice by using flow cytometry. Previous studies have shown that WASP has no significant effect on the development of bone marrow B cells,16 and the data from Mst1 KO mice showed no differences in early B-cell development compared with WT mice (supplemental Figure 1C-D). Among the various stages of development, we found that the number of bone marrow cells did not differ among all the genotypes, but the total bone marrow B cells were reduced in DKO mice (Figure 2B-C). The proportion and number of B220+ CD43– and B220+ CD43+ B cells did not change in either WASP KO or Mst1 KO mice but significantly decreased in the bone marrow of DKO mice (Figure 2A,D-G). The results of further subgroup analysis revealed that a large number of bone marrow B cells were concentrated in the pre-pro- (A) stage (Figure 2H-I). The number and proportion of pro- (B), early pre- (C), late pre- (D), and immature (E) B cells were significantly decreased, but the proportion of recirculating B cells (F) was significantly increased, although the number did not change. These results indicate that Mst1 and WASP are involved in the development of bone marrow B cells.
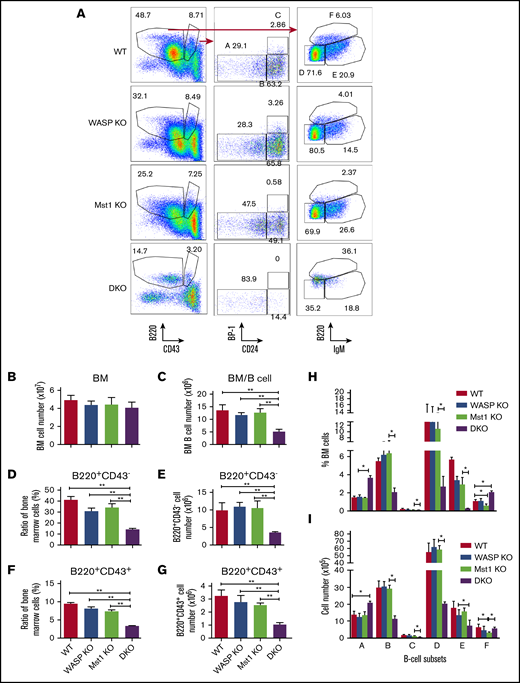
WASP and Mst1 deficiency has a severe effect on the development of bone marrow (BM) B cells. BM cells were labeled with antibodies specific for surface markers of pre-pro- (A), pro- (B), early pre- (C), late pre- (D), immature (E), and recirculating mature B cells (F) and analyzed by using flow cytometry. Shown are representative dot plots (A), the average numbers of BM (B), BM B cells (C), percentages and numbers of B220+CD43– cells (D-E), and B220+CD43+cells (F-G). (H-I) The average percentages (± standard error of the mean) and numbers of different subsets extracted from BM (n = 8). One-way analysis of variance with the Tukey test was used to perform multiple group comparisons; *P < .01, **P < .001.
WASP and Mst1 deficiency has a severe effect on the development of bone marrow (BM) B cells. BM cells were labeled with antibodies specific for surface markers of pre-pro- (A), pro- (B), early pre- (C), late pre- (D), immature (E), and recirculating mature B cells (F) and analyzed by using flow cytometry. Shown are representative dot plots (A), the average numbers of BM (B), BM B cells (C), percentages and numbers of B220+CD43– cells (D-E), and B220+CD43+cells (F-G). (H-I) The average percentages (± standard error of the mean) and numbers of different subsets extracted from BM (n = 8). One-way analysis of variance with the Tukey test was used to perform multiple group comparisons; *P < .01, **P < .001.
Previous studies have shown that WASP or Mst1 predominantly affects the differentiation of marginal zone (MZ) B cells but has no significant effect on the development of follicular (FO) B cells.23-25 Although the number of splenocytes was increased in the WASP KO, Mst1 KO, and DKO mice compared with that of WT mice, the number of spleen B cells was reduced in WASP KO and Mst1 KO mice and even further decreased in DKO mice (supplemental Figure 1A-B). We found that the number and percentage of FO B cells were significantly reduced and the proportion of MZ B cells decreased to only 0.12% in DKO mice (Figure 3A-C). Furthermore, the number and proportion of T1 and T2 cells were also dramatically reduced in DKO mice (Figure 3D-G). The number and proportion of spleen germinal center (GC) B cells were increased in WASP KO mice but decreased in Mst1 KO mice. Interestingly, the proportion of GC B cells was significantly higher in DKO mice but did not change in number (Figure 3H-I). These results indicate that Mst1 and WASP affect peripheral B-cell differentiation.

WASP and Mst1 deficiency has an impact on the differentiation of FO and GC B cells. Splenic B cells were stained with antibodies specific for surface markers of FO, MZ, T1, T2, and GC B cells. Samples (n = 9) were then analyzed by using flow cytometry. Shown are representative dot plots (A), the average percentages (± standard error of the mean), and numbers of cells of FO and MZ B cells (B-C), T1 B cells (D-E), T2 B cells (F-G), and GC B cells (H-I) extracted from spleen of 3 independent experiments. One-way analysis of variance with the Tukey test was used to perform multiple group comparisons; *P < .01, **P < .001.
WASP and Mst1 deficiency has an impact on the differentiation of FO and GC B cells. Splenic B cells were stained with antibodies specific for surface markers of FO, MZ, T1, T2, and GC B cells. Samples (n = 9) were then analyzed by using flow cytometry. Shown are representative dot plots (A), the average percentages (± standard error of the mean), and numbers of cells of FO and MZ B cells (B-C), T1 B cells (D-E), T2 B cells (F-G), and GC B cells (H-I) extracted from spleen of 3 independent experiments. One-way analysis of variance with the Tukey test was used to perform multiple group comparisons; *P < .01, **P < .001.
WASP and Mst1 deficiency reduces the BCR signaling and internalization
Previous studies have shown that Mst1 or WASP can affect the BCR signaling pathway22,25,26 ; we therefore examined the effect of the Mst1 and WASP deficiency on BCR signaling. First, we examined the effects of Mst1 and WASP deficiency on the spatial location of BCR and signaling molecules by using confocal microscopy. The total phosphorylated tyrosine proteins (pY) were examined to reflect the total BCR signaling and the key upstream molecules of BCR signaling (pCD19 and pBtk) by specific antibodies. In WT B cells, the colocalization of pY and pBtk with BCRs was increased from 5 minutes up to 10 minutes after BCR activation, and it was reduced with BCR internalization at 30 minutes (Figure 4A,G). In WASP KO, Mst1 KO, and DKO B cells, the colocalization of pY and pBtk with BCRs was decreased significantly compared with that of WT B cells (Figure 4A-G). Flow cytometry analysis of the percentage of BCRs remaining on the cell surface revealed that BCR internalization of Mst1 or WASP KO B cells was decreased and was further decreased in DKO B cells (Figure 4H). To additionally validate the results, we examined the further upstream and distal BCR signaling molecules, CD19 and Erk. The confocal microscopy results revealed that the colocalization of pCD19 and pErk with BCRs was significantly reduced in WASP KO, Mst1 KO, and DKO B cells compared with that of WT B cells (Figure 4I). Furthermore, the levels of pY, pBtk, pCD19, and pErk were decreased in WASP and Mst1 KO B cells and further reduced in DKO B cells compared with that of WT B cells (Figure 4J-M; supplemental Figure 1E). Altogether, these results suggest that Mst1 and WASP are synergistically involved in regulating BCR signaling.
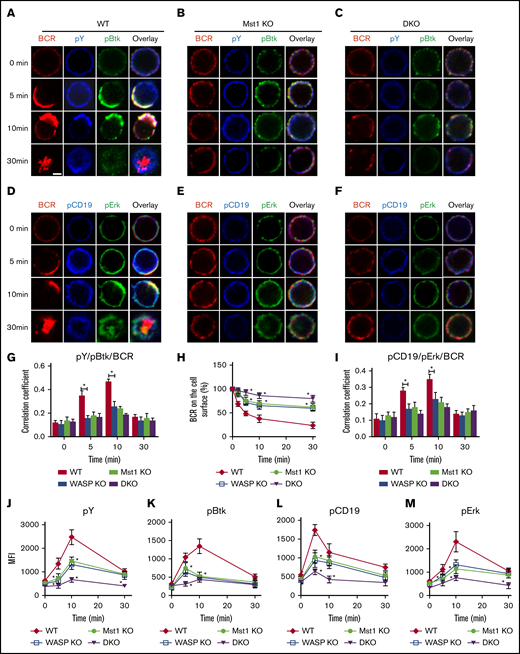
The levels of tyrosine and Btk phosphorylation in BCR clusters in response to sAg is reduced in Mst1 DKO B cells. Splenic B cells were incubated with AF546-mB-Fab′-anti-Ig without (−) or with streptavidin (sAg) at 4°C, washed, and warmed to 37°C for varying lengths of time (n = 4). (A-F) After fixation and permeabilization, the cells were stained for pY, pBtk, pCD19, and pErk and analyzed by using confocal microscopy. (G-I) The Pearson’s correlation coefficients between BCR and pY/pBtk and pCD19/pErk staining in sAg-stimulated cells were determined by using NIS-Elements AR 3.2 software. (J-M) Flow cytometry analysis of the MFI of pY, pBtk, pCD19, and pErk after stimulation with sAgs from 3 independent experiments. Shown are representative images at indicated times and the average values (± standard deviation) of ∼50 cells from 3 independent experiments. Scale bars, 2.5 μm. One-way analysis of variance with the Tukey test was used to perform multiple group comparisons; *P < .01.
The levels of tyrosine and Btk phosphorylation in BCR clusters in response to sAg is reduced in Mst1 DKO B cells. Splenic B cells were incubated with AF546-mB-Fab′-anti-Ig without (−) or with streptavidin (sAg) at 4°C, washed, and warmed to 37°C for varying lengths of time (n = 4). (A-F) After fixation and permeabilization, the cells were stained for pY, pBtk, pCD19, and pErk and analyzed by using confocal microscopy. (G-I) The Pearson’s correlation coefficients between BCR and pY/pBtk and pCD19/pErk staining in sAg-stimulated cells were determined by using NIS-Elements AR 3.2 software. (J-M) Flow cytometry analysis of the MFI of pY, pBtk, pCD19, and pErk after stimulation with sAgs from 3 independent experiments. Shown are representative images at indicated times and the average values (± standard deviation) of ∼50 cells from 3 independent experiments. Scale bars, 2.5 μm. One-way analysis of variance with the Tukey test was used to perform multiple group comparisons; *P < .01.
WASP and Mst1 deficiency reduces the early activation of B cells
Previous studies have shown that the activation of CD19 affects the early activation of B cells, and we have reported that WASP regulates CD19 transcriptional levels in human memory B cells.26-28 We examined the effect of WASP and Mst1 deficiency on the early activation of B cells by the membrane-bound antigen system and total internal reflection fluorescence microscopy. We found that B-cell spreading and BCR clustering (measured by the contact area of interference reflection microscopy and MFI of BCR clustering in the contact zone) were reduced in Mst1 KO and WASP KO B cells but were severely reduced in DKO B cells (Figure 5A-F). B-cell spreading and BCR clustering are indispensable for the recruitment of signalosomes, and we found that recruitment of pY and pCD19 in the contact zone was significantly reduced (Figure 5G-H). Taken together, these results suggest that Mst1 and WASP are involved in the early activation of B cells.
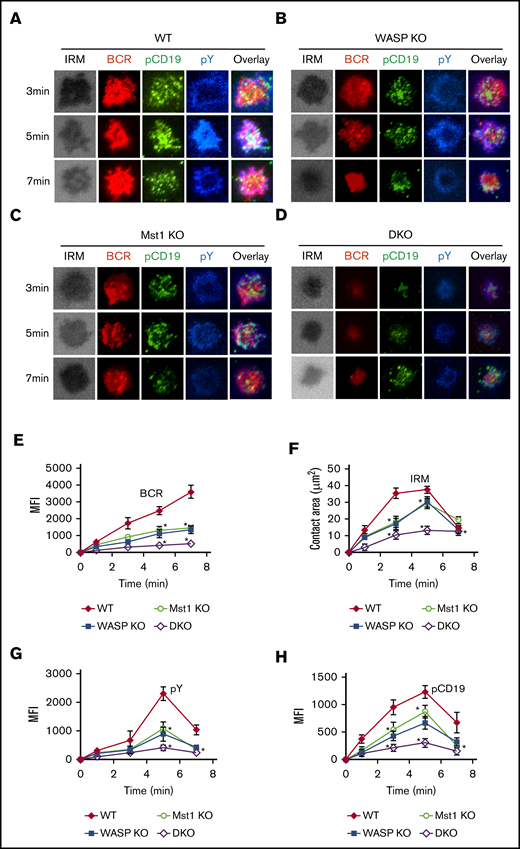
BCR cluster formation, B-cell spreading, and BCR signalosomes are reduced in DKO B cells. Splenic B cells were incubated with AF546-mB-Fab′-anti-Ig tethered to lipid bilayers at 37°C for indicated times (n = 4). Cells were fixed, permeabilized, and stained for pCD19 and pY. Shown are representative images (A-D) and the average values (± standard deviation) of the MFI of the BCR (E), B-cell contact area (F), the MFI of pY (G), and the MFI of pCD19 (H) in the contact zone. The data were generated by using 20 to 90 cells from 3 independent experiments. Scale bars, 2.5 μm. One-way analysis of variance with the Tukey test was used to perform multiple group comparisons; *P < .01.
BCR cluster formation, B-cell spreading, and BCR signalosomes are reduced in DKO B cells. Splenic B cells were incubated with AF546-mB-Fab′-anti-Ig tethered to lipid bilayers at 37°C for indicated times (n = 4). Cells were fixed, permeabilized, and stained for pCD19 and pY. Shown are representative images (A-D) and the average values (± standard deviation) of the MFI of the BCR (E), B-cell contact area (F), the MFI of pY (G), and the MFI of pCD19 (H) in the contact zone. The data were generated by using 20 to 90 cells from 3 independent experiments. Scale bars, 2.5 μm. One-way analysis of variance with the Tukey test was used to perform multiple group comparisons; *P < .01.
WASP and Mst1 reciprocally regulate one another
The mutual compensation between Mst1 and WASP led us to speculate that the 2 molecules may also regulate one another. First, we examined the spatiotemporal location of phosphorylated WASP (pWASP) and BCRs by using confocal microscopy with the specific antibody for pWASP (supplemental Figure 3A,C). The phosphorylated site of WASP as detected is serines 483 and 484, which promotes the actin polymerization by increasing affinity of WASP for Arp3.29 We found that colocalization of pWASP with BCRs was significantly reduced in Mst1 KO B cells compared with WT B cells at 5 and 10 minutes after activation (Figure 6A-C). Furthermore, the level of pWASP in Mst1 KO B cells after 5 minutes of activation was significantly higher in the cytoplasm but significantly decreased in the membrane compared with that of WT B cells (Figure 6D). Phosflow and western blot assays detected a significant increase in pWASP level in Mst1 KO B cells but also a higher total WASP level (Figure 6E-F). Previous studies have reported that WIP can stabilize and promote WASP expression.30,31 First, we examined the spatiotemporal location between WIP and BCRs by using confocal microscopy with the specific antibody for WIP (supplemental Figure 3D) and found that the colocalization of WIP with BCRs was significantly reduced in Mst1 KO B cells compared with WT B cells (Figure 6G-I), and WIP expression was significantly elevated in Mst1 KO B cells according to western blot (Figure 6J). In addition, wasp mRNA level did not change but wip mRNA level increased significantly in Mst1 KO B cells compared with WT B cells (Figure 6K). These results suggest that Mst1 can regulate the expression of WASP by regulating the transcriptional expression level of WIP.
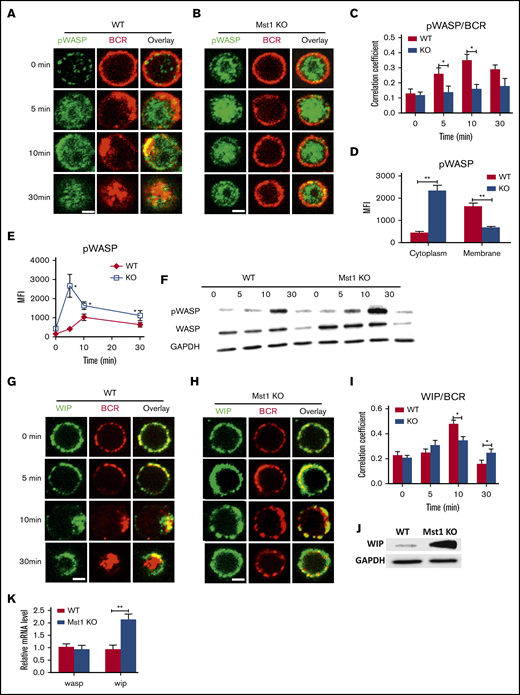
The levels of pWASP are increased in Mst1 KO B cells via promoting the expression of WIP. Splenic B cells were incubated with AF546-mB-Fab′-anti-Ig without (−) or with streptavidin (sAg) at 4°C, washed, and warmed to 37°C for varying lengths of time (n = 4). After fixation and permeabilization, the cells were stained for pWASP and WIP and analyzed by using confocal microscopy (A-B and G-H). The Pearson’s correlation coefficients between BCR and pWASP staining in sAg-stimulated cells were determined by using NIS-Elements AR 3.2 software (C). The levels of pWASP in the cytoplasm and membrane of B cells stimulated with sAg at 5 minutes were quantified by using NIS-Elements AR 3.2 software (D). Flow cytometry or western blot analysis of the WASP and pWASP expression of B cells stimulated with sAg with varying lengths of time (E-F). (I) Pearson’s correlation coefficients between BCR and WIP staining in sAg-stimulated cells were determined by using NIS-Elements AR 3.2 software. (J) Western blot analysis of WIP in WT and Mst1 KO B cells. (K) Real-time polymerase chain reaction analysis of wasp and wip in unstimulated WT and Mst1 KO B cells; the mRNA expression level of wasp and wip from different samples was standardized by glyceraldehyde-3-phosphate dehydrogenase (GAPDH). Shown are the results from 3 independent experiments and representative images at indicated times and the average values (± standard deviation) of ∼50 cells from 3 independent experiments. Scale bars, 2.5 μm. One-way analysis of variance with the Tukey test was used to perform multiple group comparisons; *P < .01, **P < .001.
The levels of pWASP are increased in Mst1 KO B cells via promoting the expression of WIP. Splenic B cells were incubated with AF546-mB-Fab′-anti-Ig without (−) or with streptavidin (sAg) at 4°C, washed, and warmed to 37°C for varying lengths of time (n = 4). After fixation and permeabilization, the cells were stained for pWASP and WIP and analyzed by using confocal microscopy (A-B and G-H). The Pearson’s correlation coefficients between BCR and pWASP staining in sAg-stimulated cells were determined by using NIS-Elements AR 3.2 software (C). The levels of pWASP in the cytoplasm and membrane of B cells stimulated with sAg at 5 minutes were quantified by using NIS-Elements AR 3.2 software (D). Flow cytometry or western blot analysis of the WASP and pWASP expression of B cells stimulated with sAg with varying lengths of time (E-F). (I) Pearson’s correlation coefficients between BCR and WIP staining in sAg-stimulated cells were determined by using NIS-Elements AR 3.2 software. (J) Western blot analysis of WIP in WT and Mst1 KO B cells. (K) Real-time polymerase chain reaction analysis of wasp and wip in unstimulated WT and Mst1 KO B cells; the mRNA expression level of wasp and wip from different samples was standardized by glyceraldehyde-3-phosphate dehydrogenase (GAPDH). Shown are the results from 3 independent experiments and representative images at indicated times and the average values (± standard deviation) of ∼50 cells from 3 independent experiments. Scale bars, 2.5 μm. One-way analysis of variance with the Tukey test was used to perform multiple group comparisons; *P < .01, **P < .001.
We next examined whether WASP regulates Mst1. First, the spatiotemporal location between pMst1 and BCRs was examined by using confocal microscopy with the specific antibody for pMst1 (supplemental Figure 3B). We found that WASP deletion resulted in a significant reduction of colocalization between BCRs and pMst1 (Figure 7A-B,E). Because WASP deficiency leads to the reduction of actin polymerization, we used the actin polymerization inhibitors latrunculin B and cytochalasin D to treat the B cells and then examined the colocalization between BCRs and pMst1. A significant reduction was found in the colocalization between the BCR and pMst1 after treatment with actin inhibitors (Figure 7C,E). No difference was observed in Mst1 expression between WT and WASP KO B cells according to western blot (Figure 7F). It has been reported that Dock8 mediates T-cell receptor–driven WASP activation, and in memory B cells we found that BCR signaling and activation are regulated by Dock8 via WASP.32,33 We therefore examined the effect of Dock8 deficiency on the location of pMst1 with BCRs. Similarly, we found that a reduction in colocalization between pMst1 and BCRs in Dock8 KO B cells after stimulation (Figure 7D-E). Using flow cytometry, the level of pMst1 was examined to accurately determine the effect of Dock8 or WASP/actin deficiency on the levels of pMst1. We found the level of pMst1 was significantly higher in Dock8- or WASP/actin-deficient B cells compared with that of WT B cells after stimulation (Figure 7G).

The levels of pMst1 were increased in WASP KO B cells after sAg stimulation. WT, WASP KO, Dock8 KO, and WT B cells treated with latrunculin B (Lat)or cytochalasin D (CD) were incubated with AF546-mB-Fab′-anti-Ig without (−) or with streptavidin (sAg) at 4°C, washed, and warmed to 37°C for varying lengths of time (n = 4). (A-D) After fixation and permeabilization, the cells were stained for pMst1 and analyzed by using confocal microscopy. (E) The Pearson’s correlation coefficients between BCR and pMst1 staining in sAg-stimulated cells were determined by using NIS-Elements AR 3.2 software. (F) Western blot analysis of the Mst1 in WT and WASP KO B cells. (G) Flow cytometry analysis of pMst1 in WT, WASP KO, Dock8 KO, and WT B cells treated with latrunculin B or cytochalasin D stimulated with sAg. (H) Coimmunoprecipitation was performed with B cells from C57BL/6 WT mice. The splenic B cells were stimulated with sAg, and the cell lysates of these cells were incubated with control immunoglobulin G (IgG; lane 1, serving as negative control) or anti-Mst1 (lanes 2 and 3); the immunoprecipitated (IP) protein complex and the cell lysates were then examined by using western blot. Shown are the results from 3 independent experiments and representative images at indicated times and the average values (± standard deviation) of ∼50 cells from 3 independent experiments. Scale bars, 2.5 μm. One-way analysis of variance with the Tukey test was used to perform multiple group comparisons; *P < .01.
The levels of pMst1 were increased in WASP KO B cells after sAg stimulation. WT, WASP KO, Dock8 KO, and WT B cells treated with latrunculin B (Lat)or cytochalasin D (CD) were incubated with AF546-mB-Fab′-anti-Ig without (−) or with streptavidin (sAg) at 4°C, washed, and warmed to 37°C for varying lengths of time (n = 4). (A-D) After fixation and permeabilization, the cells were stained for pMst1 and analyzed by using confocal microscopy. (E) The Pearson’s correlation coefficients between BCR and pMst1 staining in sAg-stimulated cells were determined by using NIS-Elements AR 3.2 software. (F) Western blot analysis of the Mst1 in WT and WASP KO B cells. (G) Flow cytometry analysis of pMst1 in WT, WASP KO, Dock8 KO, and WT B cells treated with latrunculin B or cytochalasin D stimulated with sAg. (H) Coimmunoprecipitation was performed with B cells from C57BL/6 WT mice. The splenic B cells were stimulated with sAg, and the cell lysates of these cells were incubated with control immunoglobulin G (IgG; lane 1, serving as negative control) or anti-Mst1 (lanes 2 and 3); the immunoprecipitated (IP) protein complex and the cell lysates were then examined by using western blot. Shown are the results from 3 independent experiments and representative images at indicated times and the average values (± standard deviation) of ∼50 cells from 3 independent experiments. Scale bars, 2.5 μm. One-way analysis of variance with the Tukey test was used to perform multiple group comparisons; *P < .01.
We further examined the level of pMst1 in patients with WAS (supplemental Table 2) by using confocal microscopy and flow cytometry. Similarly, we found that the colocalization between pMst1 and BCRs was significantly reduced in the B cells of patients with WAS compared with those of healthy control subjects after stimulation with soluble antigen (sAg) (supplemental Figure 2A-C). The MFI of pMst1 was increased in the B cells of patients with WAS compared with the B cells of healthy control subjects after sAg stimulation (supplemental Figure 2D). These results suggest that the Dock8/WASP–mediated actin signaling pathway also offers a feedback loop to regulate the localization and function of Mst1. To verify the interaction between Mst1, WASP, and Dock8 in vivo, a coimmunoprecipitation assay was performed (Figure 7H). The result indicated that Mst1 associated with Dock8 directly in the B cells, regardless if it was activated with sAg. However, there was no direct interaction between WASP and Mst1. Taken together, these results indicate that Mst1 and WASP can regulate one another through indirect methods.
Discussion
WASP has been extensively studied recently for its function in lymphocytes. WASP deficiency causes a reduction in MZ B cells but has no impact on the development of bone marrow B cells.23,24 Even the deletion of WASP and N-WASP has no effect on the development of bone marrow B cells.34 Therefore, WASP should associate with other factors to affect bone marrow development. Our study is the first, to the best of our knowledge, to find the related protein that affects the bone marrow development with WASP. It would be interesting to analyze the effect of WASP and Mst1 deficiency on hematopoietic stem cell progenitors, such as the common lymphoid progenitor, Lin−Sca-1+c-Kit−, and multipotent progenitor. In addition, WASP associates with Mst1 to promote the differentiation of FO and MZ B cells, BCR signaling, and B-cell early activation.
WASP and Mst1 deficiency in the current study caused severe reduction of FO, MZ, and T1/T2 B cells in the periphery but increased the ratio of GC B cells. The BCR signaling was severely reduced in DKO B cells, and therefore the increase in the generation of GC B cells is not due to the enhanced BCR signaling of themselves. The increased ratio of GC B cells is probably due to the dysfunction of other cells in the environment (eg, the reduced suppressive function of regulatory T cells). Thus, it is urgent to generate chimera mice to confirm whether this phenotype is cell extrinsic.
Our research has established that WASP and Mst1 regulate the localization and function of each other. It would be of interest to explore the deep underlying mechanism of how Mst1 and WASP reciprocally regulate one another. WASP seems to have no DNA binding domain, and it is not possible to be a transcriptional factor to regulate the expression of Mst1. As a cytoskeleton protein, WASP may affect the spatiotemporal organization of other proteins to phosphorylate Mst1. Mst1 is a serine/threonine kinase, and it has the possibility to phosphorylate WASP. However, our coimmunoprecipitation data showed that there was no direct interaction between Mst1 and WASP. In addition, if Mst1 phosphorylates WASP, the absence of Mst1 should have reduced phosphorylation of WASP. The current data have shown the increase in pWASP in the Mst1 KO B cells, and, therefore, Mst1 may regulate the phosphorylation of WASP with other mediates indirectly. Guan’s group has found that Mst1 regulates the transcription of WIP via further downstream transcriptional factor TEAD in drosophila,35 which is consistent with our current model.
Mst1 is a cancer-related gene, and patients with WAS are prone to have lymphoma. The molecular mechanism of tumor susceptibility to WAS is still unknown, although the mutations of WAS affect the tumor susceptibility in the p53+/− murine model.36 The poor cytotoxic T cells in patients with WAS have been suggested to lead to tumor susceptibility,37 whereas Mst1-deficient cytotoxic T cells suppress tumor growth.38 However, whether the dysfunctional B cells in patients with WAS contribute to malignant tumors is still unknown. The current study found that WASP deficiency in patients and mice affects pMst1 localization and function in B cells. The mammalian Hippo signaling pathway has been implicated in oncogenesis in the context of solid tumors; additional study is needed, however, to determine if the impaired pMst1 localization and function in WASP deficiency in B cells play roles in lymphoma susceptibility.
All data requests should be submitted to the corresponding author for consideration (Chaohong Liu; e-mail: chaohongliu80@126.com).
Acknowledgments
This work was supported by the Natural Science Foundation of China (81701628, 81722002, and 81861138002) and Chongqing Science and Technology Commission of China (cstc2017jcyjAX0439).
Authorship
Contribution: L.H. conducted the initial analyses and drafted the initial manuscript; D.Y., X.B., X.S., Y.Z., J.W., and W.L. performed the microscopic and flow cytometry assays; X.D. and P.J. performed the coimmunoprecipitation analysis assay; H.M., B.T., W.S., and X.Z. reviewed and revised the manuscript; C.L. conceptualized and designed the study, and reviewed and revised the manuscript; and all authors approved the final manuscript as submitted and agree to be accountable for all aspects of the work.
Conflict-of-interest disclosure: The authors declare no competing financial interests.
Correspondence: Chaohong Liu, Department of Pathogen Biology, School of Basic Medicine, Huazhong University of Science and Technology, Wuhan 430030, China; e-mail: chaohongliu80@126.com; and Xiaodong Zhao, Chongqing City Key Laboratory of Child Infection and Immunity, Children’s Hospital of Chongqing Medical University, No. 136, Zhongshan 2nd Rd, Yuzhong District, Chongqing, 400014, China; e-mail: zhaoxd530@aliyun.com.

