

Key Points
Tisagenlecleucel mean expansion (lower vs B-ALL; not related to response) and baseline tumor burden in DLBCL correlated with CRS severity.
Impact of dose on estimated probability of severe CRS was not statistically significant after adjusting for baseline tumor burden.

Abstract
The anti-CD19 chimeric antigen receptor (CAR)–T cell therapy tisagenlecleucel was evaluated in the global, phase 2 JULIET study in adult patients with relapsed/refractory diffuse large B-cell lymphoma (DLBCL). We correlated tisagenlecleucel cellular kinetics with clinical/product parameters in 111 patients treated in JULIET. Tisagenlecleucel persistence in responders and nonresponders, respectively, was demonstrated for 554 and 400 days maximum by flow cytometry and for 693 and 374 days maximum by quantitative polymerase chain reaction (qPCR). No relationships were identified between cellular kinetics (qPCR) and product characteristics, intrinsic/extrinsic factors, dose, or immunogenicity. Most patients with 3-month response had detectable transgene at time of response and continued persistence for ≥6 months. Expansion (maximal expansion of transgene/CAR-positive T-cell levels in vivo postinfusion [Cmax]) was potentially associated with response duration but this did not reach statistical significance (hazard ratio for a twofold increase in Cmax, 0.79; 95% confidence interval, 0.61-1.01). Tisagenlecleucel expansion was associated with cytokine-release syndrome (CRS) severity and tocilizumab use; no relationships were observed with neurologic events. Transgene levels were associated with B-cell levels. Dose was associated with CRS severity, but this was not statistically significant after adjusting for baseline tumor burden. In contrast to the results from B-cell precursor acute lymphoblastic leukemia (B-ALL) and chronic lymphocytic leukemia, similar exposure was observed in DLBCL in this study regardless of response and expansion was lower in DLBCL than B-ALL, likely from differences in cancer location and/or T-cell intrinsic factors. Relationships between expansion and CRS severity, and lack of relationships between dose and exposure, were similar between DLBCL and B-ALL. Tisagenlecleucel cellular kinetics in adult relapsed/refractory DLBCL improve current understanding of in vivo expansion and its relationships with safety/efficacy endpoints. This trial was registered at www.clinicaltrials.gov as #NCT02445248.
Introduction
The anti-CD19 chimeric antigen receptor (CAR)–T cell therapy tisagenlecleucel has demonstrated efficacy in the treatment of pediatric/young adult patients with relapsed/refractory B-cell precursor acute lymphoblastic leukemia (B-ALL) and adult patients with relapsed/refractory diffuse large B-cell lymphoma (DLBCL).1-6 JULIET is a global, phase 2 study of tisagenlecleucel that demonstrated durable responses in patients with relapsed/refractory DLBCL.5 Unlike pharmacokinetics for conventional drugs, cellular kinetics describe net kinetics resulting from in vivo proliferation and cell death of the administered modified T-cell product.7 Correlation of CAR-T cellular kinetics with efficacy/safety outcomes is important for improving our understanding of expansion and persistence of this “living drug” with regard to safety/efficacy endpoints and for optimizing a safe and efficacious dose range.8
Tisagenlecleucel cellular kinetics in peripheral blood are well characterized for tumors primarily located in peripheral blood/bone marrow (such as B-ALL).3,7,9 DLBCL is a B-cell malignancy localized primarily in lymph nodes and extranodal/extramedullary sites; it is important to determine if tisagenlecleucel cellular kinetics in peripheral blood correlate with safety/efficacy endpoints (because current understanding of CAR-T cell infiltration in tumor tissue and interaction with the microenvironment is limited). Data from JULIET showed comparable tisagenlecleucel exposure in peripheral blood by quantitative polymerase chain reaction (qPCR; quantification of CAR transgene levels) in responders and nonresponders, with longer persistence in patients with sustained response.5 To improve our understanding of cellular kinetics of CAR-based therapy, especially for tumors in lymph nodes and extranodal/extramedullary sites, we report an analysis of correlations between cellular kinetics and the following parameters in DLBCL in JULIET: product characteristics, intrinsic/extrinsic factors, tumor characteristics (CD19 expression, baseline tumor burden), efficacy/safety, B-cell aplasia (including correlations between B-cell aplasia and baseline rituximab levels), dose (including correlations between dose and efficacy/safety), and immunogenicity (including correlations between immunogenicity and efficacy).
Methods
Study design, patients, and treatment
JULIET (NCT02445248) is a single-arm, open-label, multicenter, global, phase 2 study evaluating tisagenlecleucel efficacy/safety in patients ≥18 years with relapsed/refractory DLBCL (see supplemental Methods for additional information).5 Tisagenlecleucel is manufactured by transduction of patient cells obtained by leukapheresis.10 The study was approved by institutional review boards at participating institutions. Patients provided written informed consent.
Bioanalytical methods
Peripheral blood and bone marrow aspirates were collected from patients for evaluation of postinfusion tisagenlecleucel transgene levels via qPCR and CAR+ viable T cells (percentage of CD3+/CAR+ cells) via flow cytometry. The details related to the analytical methods have been previously published.9 qPCR and flow cytometry measurements were made before lymphodepleting chemotherapy (or within 3 weeks of infusion if no lymphodepleting chemotherapy was given); just after infusion; days 4, 7, 11, 14, 17, 21, and 28; and months 2, 3, 6, 9, 12, 18, and 60. Based on previous experience in ALL, qPCR analyses appeared to be more sensitive than flow cytometry7 ; therefore, additional qPCR measurements were done on day 2 and months 24, 30, 36, 42, 48, and 54. Bone marrow collection occurred at screening, day 28 if the patient was in complete response (CR), and month 3. Partitioning of tisagenlecleucel transgene was assessed by the ratio of bone marrow concentrations to peripheral blood levels.
Cellular kinetics exposure parameters included maximal expansion of transgene/CAR-positive T-cell levels in vivo postinfusion (Cmax), time to maximal expansion (tmax), exposure up to 28 days (area under the curve [AUC]0-28d), and persistence (duration transgene/CAR-T cells are present in peripheral blood and tissues [tlast]). Results are reported as transgene copies/microgram of genomic DNA for qPCR and percent of CAR-positive cells among CD3-positive T cells in blood for flow cytometry. Assuming white blood cell counts of 2000 cells/µL, lymphocyte DNA content of 7 pg/cell,11 and 1 transgene copy/cell (for illustrative purposes; multiple transgene copies/cell have been observed), 1000 copies/µg corresponds to ∼14 CAR-T cells/µL.
Supplemental Figure 1 presents relationships between cellular kinetics and the endpoints analyzed. Associations were made between cellular kinetic parameters and select product characteristics (T cells percentage, cell viability, transduction efficiency, total cell count, interferon-γ release, CD4:CD8 ratio), intrinsic/patient factors (age, race, sex, body weight, prior disease status, disease stage, burden of disease), and extrinsic/treatment factors (prior hematopoietic stem cell transplant status, type of lymphodepleting chemotherapy, number of prior lines of therapy). Quantitative immunofluorescent staining for CD19, assessed by automated quantitative analysis on archival/new biopsies collected before enrollment (supplemental Methods) was used to retrospectively assess influence of CD19 expression on cellular kinetics. Impact of baseline tumor burden, quantified using positron emission tomography (supplemental Methods), on in vivo cellular kinetics was investigated. Total metabolic tumor volume (total volume of all individual nodal/extranodal lesions and focal organ involvement) was selected as an indicator of overall disease burden.12
Associations were evaluated between cellular kinetic parameters and clinical efficacy (3-month response status [an indicator of clinically meaningful benefit],5 duration of response [DOR]), and safety parameters (cytokine-release syndrome [CRS] severity, tocilizumab use for CRS management, neurologic event severity).
CD19+ B-cell levels were evaluated pre-/postinfusion to monitor B-cell aplasia (an on-target/off-tumor effect of CAR-T therapy that can lead to hypogammaglobulinemia and related infections, but can also be used as a pharmacodynamic measure of tisagenlecleucel function).13 Because rituximab can cause long-term B-cell aplasia (lasting approximately 6 to 12 months),14,15 rituximab levels were evaluated at baseline (day −1) and post-tisagenlecleucel infusion (days 7, 21) to distinguish tisagenlecleucel effects on B cells (prolongation of B-cell aplasia) in peripheral blood from that of prior rituximab treatment (supplemental Methods).
Effects of dose on tisagenlecleucel exposure, clinical response, and safety endpoints were assessed to determine the recommended dose range for clinical use. Positive relationships were previously observed between CRS severity and baseline tumor burden in pediatric B-ALL (tumor burden defined by percentage bone marrow blasts)7 and DLBCL (tumor burden defined by active tumor volume or presence of bulky disease).16 Therefore, influence of baseline tumor burden on the dose-CRS relationship was investigated.
Preexisting and postinfusion antibodies (humoral immunogenicity) and T-cell responses (cellular immunogenicity) were summarized, and influence on cellular kinetics and efficacy were analyzed. Methods for assessment of humoral immunogenicity have been published elsewhere (supplemental Methods).9,17 Cellular immunogenicity against tisagenlecleucel was evaluated by measuring CD4+/CD8+ T-cell activation (percentage of interferon γ-positive cells detected by intracellular staining and subsequent flow cytometric analysis) in response to mCAR19-derived peptides. The assay measure is referred to as net responses (mCAR19 peptide pool response−dimethylsulfoxide negative control response) and was calculated for 2 nonidentical mCAR19 peptide pools (pool 1 and pool 2, comprising 60 and 59 overlapping 15-mer peptides derived from the mCAR19 protein sequence, respectively). The maximum net responses were related to the exposure metrics and clinical outcome for both peptide pools.
Statistical analysis
Cellular kinetics exposure parameters were estimated using noncompartmental methods using Phoenix WinNonlin, version 6.4 (Pharsight Corp., St. Louis, MO). Associations between cellular kinetics, select product characteristics, and intrinsic/extrinsic factors were explored using linear models and scatter plots for continuous variables, and summary statistics and box plots for categorical variables. Associations between cellular kinetics, CD19 expression, and baseline tumor burden were assessed using linear regression. Effects of cellular kinetics on 3-month response were evaluated using summary statistics, concentration-time profiles, and logistic regression. Effects on DOR were assessed using the Kaplan-Meier method by median estimate of cellular kinetic parameters and Cox regression. Effects on CRS and neurologic events were explored using box plots and logistic regression. The time course of B-cell levels by presence of baseline rituximab was explored. Additionally, the time course of B-cell levels and tisagenlecleucel transgene levels were plotted. Associations between cellular kinetics and dose were explored using scatter plots. Effects of dose on 3-month response and safety were assessed using logistic regression analysis with associated odds ratios (OR). The influence of baseline tumor burden on the dose-CRS relationship was investigated using an additional logistic regression model including dose, tumor burden, and an interaction between the 2. A multivariate analysis was also performed to evaluate the impact of Cmax, dose, and tumor burden on probability of high-grade CRS and neurologic events. The influence of humoral and cellular immunogenicity on cellular kinetics and efficacy were explored using scatter plots and box plots, respectively, as well as summary statistics. It should be noted that these analyses were exploratory in nature, rather than confirmatory.
Results
Tisagenlecleucel cellular kinetics
Data from 111 patients who received tisagenlecleucel were included in the full, safety, and pharmacokinetics analysis sets, of which 93 patients with ≥3 months of follow-up were included in the efficacy analysis set (supplemental Results).5 Median and maximum follow-up were similar in responders (15.3 and 23.6 months, respectively; n = 35) and nonresponders (14.6 and 26.2 months, respectively; n = 58); 38 nonresponders received additional anticancer therapy following tisagenlecleucel infusion. Tisagenlecleucel cellular kinetics have been previously reported in pediatric B-ALL and in adult DLBCL using qPCR.5,9 Results by flow cytometry are included in Table 1. A moderate correlation was observed between expansion and exposure in transgene levels by qPCR and CAR-positive cells by flow cytometry in DLBCL (Cmax, r2 = 0.47; AUC0-28d, r2 = 0.49; supplemental Figure 2). qPCR was a more sensitive assay than flow cytometry; hence, correlations were performed using qPCR data, unless otherwise specified. Cmax and AUC0-28d by qPCR were observed to be highly correlated (r2 = 0.93). Representative profiles of tisagenlecleucel cellular kinetics in DLBCL and B-ALL (from the ELIANA study3,9 ) are presented in the supplemental Results (see text; supplemental Figure 3). Individual tisagenlecleucel cellular kinetics profiles in DLBCL by response have been previously published.5
Summary of peripheral blood cellular kinetic parameters by flow cytometry for tisagenlecleucel by response at month 3
| Parameter | CR/PR | SD/PD/unknown |
|---|---|---|
| AUC0-28d, %CD3+CAR+cells*× d | n = 35† | n = 44† |
| Geometric mean (% CV) | 36.9 (214.7) | 42.0 (299.3) |
| Cmax, %CD3+CAR+cells* | n = 34 | n = 50 |
| Geometric mean (% CV) | 4.81 (169.7) | 4.18 (232.9) |
| Range | (0.600-40.9) | (0.300-61.5) |
| tmax, d | n = 34 | n = 50 |
| Median (range) | 6.35 (2.91-271) | 7.64 (2.82-25.9) |
| Clast,%CD3+CAR+cells* | n = 35 | n = 50 |
| Geometric mean (% CV) | 0.289 (165.2) | 0.539 (313.2) |
| tlast, d | n = 35 | n = 50 |
| Median (range) | 280 (21-554) | 28.1 (9.01-400) |
CV, coefficient of variation; PR, partial response; SD, stable disease.
Percentage of CAR+ cells among CD3+ T cells.
Patients who had ≥1 sample with evaluable cellular kinetics data were included.
qPCR data from bone marrow biopsy samples were available from a limited number of patients (14 patients at day 28 and 33 patients at month 3) following tisagenlecleucel infusion. Bone marrow transgene levels at day 28 were nearly 70% of that in blood in both responders and nonresponders. At month 3, bone marrow levels were ∼50% of blood levels, demonstrating a high extent of bone marrow persistence.
No apparent relationships were identified between cellular kinetics and select final product characteristics (Figure 1) or baseline intrinsic (Figure 2) or extrinsic (Figure 3) factors. Baseline CD19 expression by quantitative immunofluorescent staining of tumor samples (supplemental Figure 4A) and baseline tumor burden (supplemental Figure 4B) was not associated with in vivo Cmax. Baseline CD19 expression was also not associated with median overall survival (12.5 months; 95% confidence interval [CI], 6.5 to not estimable vs 10.3 months; 95% CI, 4.0 to not estimable).
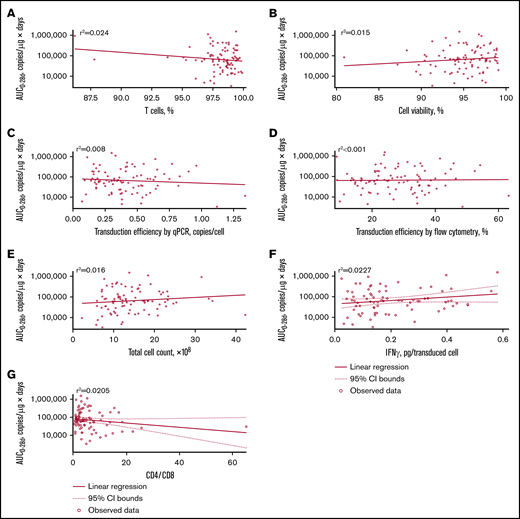
Relationship between product characteristics and tisagenlecleucel cellular kinetics. Relationship between percentage of T cells (A), cell viability (B), transduction efficiency by qPCR (C), transduction efficiency by flow cytometry (D), total cell count (E), interferon-γ (IFN-γ) release (F), and CD4:CD8 ratio vs AUC0-28d (G).
Relationship between product characteristics and tisagenlecleucel cellular kinetics. Relationship between percentage of T cells (A), cell viability (B), transduction efficiency by qPCR (C), transduction efficiency by flow cytometry (D), total cell count (E), interferon-γ (IFN-γ) release (F), and CD4:CD8 ratio vs AUC0-28d (G).
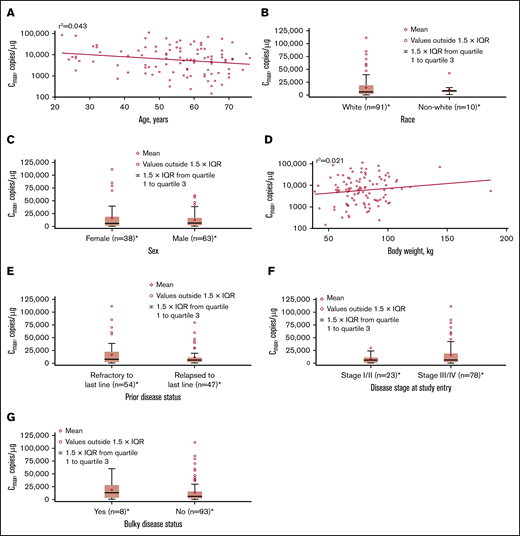
Influence of intrinsic factors on tisagenlecleucel cellular kinetics. Influence of age (A), race (B), sex (C), body weight (D), prior disease status (E), disease stage at study entry (F), and burden of disease (G) on Cmax. *Patients who had ≥1 sample with evaluable cellular kinetics data were included. IQR, interquartile range.
Influence of intrinsic factors on tisagenlecleucel cellular kinetics. Influence of age (A), race (B), sex (C), body weight (D), prior disease status (E), disease stage at study entry (F), and burden of disease (G) on Cmax. *Patients who had ≥1 sample with evaluable cellular kinetics data were included. IQR, interquartile range.
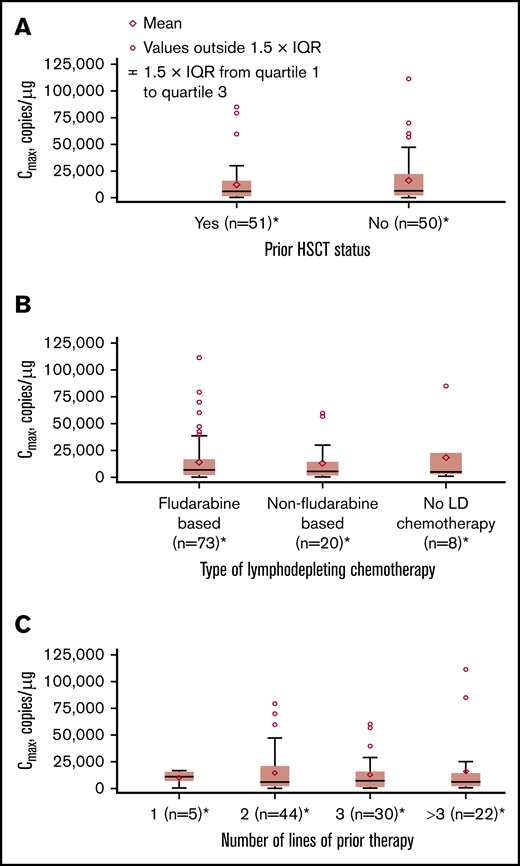
Influence of extrinsic factors on tisagenlecleucel cellular kinetics. Influence of prior hematopoietic stem cell transplant (HSCT) status (A), type of lymphodepleting (LD) chemotherapy (B), and number of lines of prior therapy (C) on Cmax. *Patients who had ≥1 sample with evaluable cellular kinetics data were included.
Influence of extrinsic factors on tisagenlecleucel cellular kinetics. Influence of prior hematopoietic stem cell transplant (HSCT) status (A), type of lymphodepleting (LD) chemotherapy (B), and number of lines of prior therapy (C) on Cmax. *Patients who had ≥1 sample with evaluable cellular kinetics data were included.
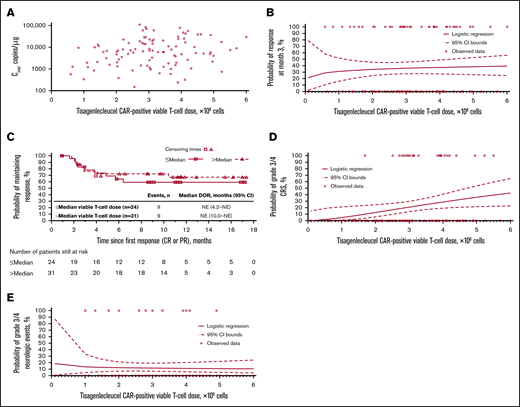
Cellular kinetics (by flow cytometry) were similar between responders and nonresponders (Table 1). Median tlast by flow cytometry was 280 days in responders and 28 days in nonresponders; however, no differences in Cmax were observed between responders and nonresponders. No statistically significant relationship was observed between Cmax and 3-month response (Figure 4A). Patients with higher-than-median Cmax had a potentially longer DOR versus those with lower-than-median Cmax (Figure 4B), but stratification by median Cmax or concentration at month 3 (Figure 4C) did not result in statistically significant differences in DOR.
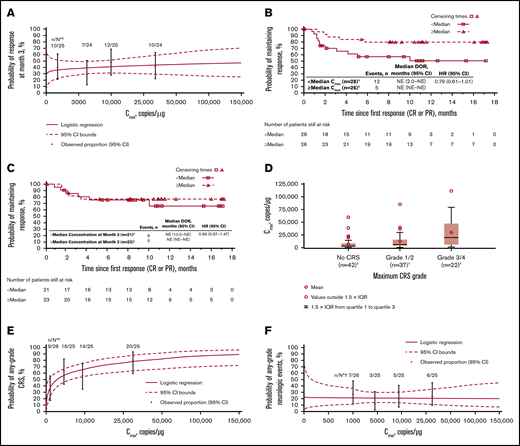
Exposure-efficacy and exposure-safety analyses. (A) Logistic regression of 3-month response vs Cmax overlaid with observed proportions (95% CI) by quartile. The estimated OR for having a 3-month response with a twofold increase in Cmax was 1.09 (95% CI, 0.897-1.321). Kaplan-Meier plots of DOR, based on response at any time, by median Cmax (B) and by median concentration (C) at month 3. Based on the Cox regression model of DOR by log of Cmax (B), the hazard ratio for a twofold increase in Cmax was 0.79 (95% CI, 0.61-1.01). (D) Tisagenlecleucel exposure by CRS grade. Geometric mean Cmax was 3200, 6210, and 16 000 copies/µg in patients with no (n = 42), grade 1/2 (n = 37), and grade 3/4 (n = 22) CRS, respectively. Diamonds represent mean values and circles represent values outside of 1.5 × IQR. Lower and upper whiskers extend to the most extreme points within 1.5 × IQR of quartile 1 and quartile 3, respectively. (E) Logistic regression of any-grade CRS vs Cmax by qPCR, overlaid with observed proportions (95% CI) by quartile. The estimated OR for having any-grade CRS with a twofold increase in Cmax was 1.44 (95% CI, 1.159-1.794). (F) Logistic regression of any-grade neurologic events vs Cmax by qPCR, overlaid with observed proportions (95% CI) by quartile. *n/N is the number of patients with 3-month response/total number of patients in the quartile range. †Patients who had ≥1 sample with evaluable cellular kinetics data were included. NE, not estimable.
Exposure-efficacy and exposure-safety analyses. (A) Logistic regression of 3-month response vs Cmax overlaid with observed proportions (95% CI) by quartile. The estimated OR for having a 3-month response with a twofold increase in Cmax was 1.09 (95% CI, 0.897-1.321). Kaplan-Meier plots of DOR, based on response at any time, by median Cmax (B) and by median concentration (C) at month 3. Based on the Cox regression model of DOR by log of Cmax (B), the hazard ratio for a twofold increase in Cmax was 0.79 (95% CI, 0.61-1.01). (D) Tisagenlecleucel exposure by CRS grade. Geometric mean Cmax was 3200, 6210, and 16 000 copies/µg in patients with no (n = 42), grade 1/2 (n = 37), and grade 3/4 (n = 22) CRS, respectively. Diamonds represent mean values and circles represent values outside of 1.5 × IQR. Lower and upper whiskers extend to the most extreme points within 1.5 × IQR of quartile 1 and quartile 3, respectively. (E) Logistic regression of any-grade CRS vs Cmax by qPCR, overlaid with observed proportions (95% CI) by quartile. The estimated OR for having any-grade CRS with a twofold increase in Cmax was 1.44 (95% CI, 1.159-1.794). (F) Logistic regression of any-grade neurologic events vs Cmax by qPCR, overlaid with observed proportions (95% CI) by quartile. *n/N is the number of patients with 3-month response/total number of patients in the quartile range. †Patients who had ≥1 sample with evaluable cellular kinetics data were included. NE, not estimable.
Grade 3/4 CRS was associated with higher Cmax (Figure 4D; supplemental Table 1) and AUC0-28d (data not shown) vs no/low-grade CRS. Higher Cmax was associated with increased estimated probability of any-grade (Figure 4E) or grade 3/4 CRS (OR with twofold increase in Cmax, 1.70 [95% CI, 1.254-2.294]), based on logistic regression models. Geometric mean Cmax was also higher among patients who received tocilizumab for CRS management (n = 13) vs those who did not (n = 78; 18 700 vs 4840 copies/µg). Higher AUC0-28d was observed in patients treated with corticosteroids (n = 9) than in patients who did not receive corticosteroids (n = 81). Most patients who received tocilizumab also received corticosteroids. No relationship was observed between Cmax and any-grade (Figure 4F) or grade 3/4 neurologic events (supplemental Table 1).
B-cell aplasia
Most patients received rituximab and/or other CD20 antibodies (known to cause long-term B-cell aplasia) as treatment for lymphoma before tisagenlecleucel infusion; 70% received rituximab ≤6 months preinfusion (supplemental Table 2). Most patients had measurable baseline rituximab levels. Rituximab levels at baseline and at 7 and 21 days post-tisagenlecleucel infusion reflected the expected concentrations based on its known half-life (∼22 days14 ). Eight patients received other CD20 antibodies during the bridging therapy phase before tisagenlecleucel infusion (obinutuzumab, n = 7; ofatumumab, n = 1).
Only 1 patient had normal baseline peripheral blood CD19+ B-cell levels (80-616 cells/µL); most patients had levels below the lower limit of quantification (LLOQ; 0.2 cells/µL).5 CD19+ B-cell levels over time versus baseline rituximab are shown in supplemental Figure 5A.
Representative plots for 12 patients with B-cell levels >30 cells/µL indicated a clear trend toward increasing B-cell levels with declining tisagenlecleucel transgene levels (supplemental Figure 5B). Patient 2 experienced a partial response, patients 1 and 5 experienced progressive disease (PD), and the remaining 9 patients experienced CR. At last follow-up, 6 patients had ongoing CR with B-cell recovery in normal range (80-616 cells/µL), 4 of whom also had transgene persistence.
Dose justification
CAR+ viable T-cell doses in this study ranged from 0.089 × 10⁸ to 6.0 × 10⁸, and showed no relationship with Cmax (Figure 5A). Dose-efficacy analyses showed responses across doses from 0.6 × 10⁸ to 6.0 × 10⁸ CAR+ viable T cells, with no apparent effect on 3-month response (Figure 5B). The patient who received a 0.089 × 10⁸ CAR+ viable T-cell dose did not achieve a favorable clinical response. DOR was similar above and below the median dose (3.0 × 10⁸ CAR+ viable T cells; Figure 5C).
Tisagenlecleucel dose-exposure, dose-response, and dose-safety analyses. Dose-exposure analysis: (A) Scatter plot of Cmax vs CAR+ viable T-cell dose. Dose-response analysis: (B) Logistic regression of 3-month response vs CAR+ viable T-cell dose, overlaid with individual data. (C) Kaplan-Meier plot of DOR, based on response at any time, by median CAR+ viable T-cell dose. Dose-safety analysis: (D) Logistic regression of grade 3/4 CRS vs CAR+ viable T-cell dose, overlaid with individual data. The estimated OR for having grade 3/4 CRS with a twofold increase in dose was 2.82 (95% CI, 1.116-7.150). After adjusting for baseline tumor burden, the estimated OR for having grade 3/4 CRS with a twofold increase in dose was 2.246 (95% CI, 0.684-7.375). (E) Logistic regression of grade 3/4 neurologic events vs CAR+ viable T-cell dose, overlaid with individual data. The estimated OR for having grade 3/4 neurologic events with a twofold increase in dose was 0.89 (95% CI, 0.445-1.801).
Tisagenlecleucel dose-exposure, dose-response, and dose-safety analyses. Dose-exposure analysis: (A) Scatter plot of Cmax vs CAR+ viable T-cell dose. Dose-response analysis: (B) Logistic regression of 3-month response vs CAR+ viable T-cell dose, overlaid with individual data. (C) Kaplan-Meier plot of DOR, based on response at any time, by median CAR+ viable T-cell dose. Dose-safety analysis: (D) Logistic regression of grade 3/4 CRS vs CAR+ viable T-cell dose, overlaid with individual data. The estimated OR for having grade 3/4 CRS with a twofold increase in dose was 2.82 (95% CI, 1.116-7.150). After adjusting for baseline tumor burden, the estimated OR for having grade 3/4 CRS with a twofold increase in dose was 2.246 (95% CI, 0.684-7.375). (E) Logistic regression of grade 3/4 neurologic events vs CAR+ viable T-cell dose, overlaid with individual data. The estimated OR for having grade 3/4 neurologic events with a twofold increase in dose was 0.89 (95% CI, 0.445-1.801).
Logistic regression analyses showed increased estimated probability of grade 3/4 CRS with higher tisagenlecleucel dose (Figure 5D). However, after adjusting for baseline tumor burden, there was no significant relationship between dose and grade 3/4 CRS (OR for twofold increase in dose at median tumor volume was 2.246 [95% CI, 0.684-7.375]). The estimated probabilities of grade 3/4 CRS for 5.0 × 10⁸ to 6.0 × 10⁸ CAR+ viable T cells were comparable (0.363 to 0.428, respectively). Multivariate analysis confirmed that dose had no significant impact on the estimated probability of grade 3/4 CRS, whereas tumor burden did have a statistically significant impact (supplemental Table 1). There was no apparent effect of dose on estimated probability of grade 3/4 neurologic events (Figure 5E; supplemental Table 1). Based on all available data, the recommended dose was determined to be 0.6 × 10⁸ to 6.0 × 10⁸ CAR+ viable T cells.
Immunogenicity
Most patients (91.4%) had detectable preexisting anti-mCAR19 antibodies at baseline, which had no effect on Cmax in this study (Figure 6A). Increased titers of treatment-induced anti-mCAR19 antibodies postinfusion occurred in 5% of patients. The maximum fold-change in the anti-mCAR19 antibody response postinfusion relative to baseline had no impact on 3-month response (Figure 6B).18
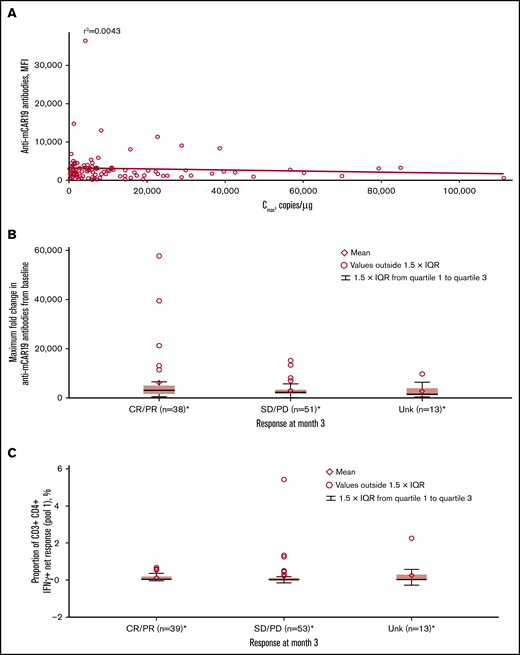
Associations between immunogenicity, cellular kinetics, and response rate. (A) Anti-mCAR19 antibodies at enrollment vs tisagenlecleucel cellular kinetics (Cmax). (B) Maximum fold change from baseline for anti-mCAR19 antibodies by 3-month response. (C) Cellular immunogenicity vs 3-month response. *Patients who had ≥1 sample with evaluable cellular kinetics data were included. mCAR19, murine anti-CD19 chimeric antigen receptor; MFI, mean fluorescence intensity; SD, stable disease; Unk, unknown.
Associations between immunogenicity, cellular kinetics, and response rate. (A) Anti-mCAR19 antibodies at enrollment vs tisagenlecleucel cellular kinetics (Cmax). (B) Maximum fold change from baseline for anti-mCAR19 antibodies by 3-month response. (C) Cellular immunogenicity vs 3-month response. *Patients who had ≥1 sample with evaluable cellular kinetics data were included. mCAR19, murine anti-CD19 chimeric antigen receptor; MFI, mean fluorescence intensity; SD, stable disease; Unk, unknown.
Cellular responses to mCAR19 peptides, determined by percentage of T cells activated at preinfusion and up to 12 months postinfusion, were consistently low (∼1%) over time for individual patients. There was no relationship between cellular immunogenicity and 3-month response for peptide pools 1 (Figure 6C) and 2 (data not shown).
Discussion
In adult patients with relapsed/refractory DLBCL, tisagenlecleucel showed rapid in vivo expansion and persistence for up to 24 months (693 days by qPCR).5 Although similar patterns of expansion and biexponential decline were observed in DLBCL and B-ALL, geometric mean tisagenlecleucel expansion in peripheral blood was nearly sixfold lower in DLBCL vs B-ALL (Cmax by qPCR, 6210 vs 34 700 copies/µg in responders).5,9 Differences in CAR+ cell trafficking to target sites (lymph nodes, bone marrow, other extranodal/extramedullary sites in DLBCL vs blood/marrow in B-ALL) or intrinsic T-cell differences were potentially responsible for the lower tisagenlecleucel Cmax seen in peripheral blood of DLBCL patients. Most patients with 3-month response had detectable transgene at the time of response assessment and continued persistence in peripheral blood ≥6 months postinfusion, and some patients who experienced relapse had detectable transgene at the time of relapse.5 A distinguishing feature in responders with DLBCL was the long terminal clearance phase observed (geometric mean tisagenlecleucel apparent terminal half-life by qPCR, 91.3 days19 vs 16.8 days in pediatric B-ALL).9 In DLBCL, CAR-T cells partition between target tissues (lymph nodes, extranodal/extramedullary sites) and blood; therefore, cell trafficking between these sites may result in a longer half-life compared with B-ALL where the target is predominantly in blood. Maximal expansion by qPCR and flow cytometry were correlated in DLBCL, although the qPCR assay was more sensitive, similar to previously reported results in pediatric B-ALL.7 The shorter persistence detected by flow cytometry (554 days maximum in responders) compared with qPCR (693 days maximum in responders5 ) may be attributed to loss of CAR surface expression, CAR-T cell sequestration from blood into tissues, and/or the relatively lower sensitivity of flow cytometry.
Tisagenlecleucel product characteristics, including CD4:CD8 ratio, did not influence in vivo cellular kinetics, providing clinical justification for the specification range for these characteristics. The intrinsic/extrinsic patient characteristics evaluated in this study and baseline CD19 tumor expression did not influence cellular kinetics. The limitation of assessing CD19 expression based on a single baseline biopsy should be noted and heterogeneity of CD19 expression from different lesions or areas of lymph nodes could exist. As reported previously, baseline CD19 tumor expression did not influence overall response rates (49% [95% CI, 34-64] with CD19+ expression vs 50% [95% CI, 29-71] with CD19-low/− expression),5 and our analysis also found no effect on median overall survival. Based on these exploratory analyses, low/undetectable CD19 expression may be sufficient for tisagenlecleucel efficacy, and there is no lower threshold level of CD19 expression in DLBCL tissue which could be used to exclude DLBCL patients from tisagenlecleucel treatment. Similar response rates between patients with CD19− and CD19+ disease at baseline have been observed in the ZUMA-1 study, which underscores the limitation in CD19 detection.20 Notably, no association was observed between baseline tumor burden and cellular kinetics, perhaps because cellular kinetics measured in peripheral blood may not fully reflect tisagenlecleucel interactions with antigens at tumor sites.
Similar cellular kinetics by flow cytometry in peripheral blood were observed for responders and nonresponders, consistent with qPCR results5 and peak expansion results from a single-center study in relapsed/refractory DLBCL patients.6 In contrast, greater expansion and persistence were seen in responders vs nonresponders in previous studies in chronic lymphocytic leukemia (CLL) and B-ALL.7,21 Most responders demonstrated persistence in this analysis using flow cytometry (median tlast, 280 days) and based on previous qPCR results (median tlast, 289 days),5 an important consideration in this patient population with limited treatment options. Median tlast in nonresponders was 28 days by flow cytometry and 57 days by qPCR.5 It is important to note that persistence can be influenced by data cutoff and length of follow-up, with limited follow-up generally observed in nonresponders; therefore, comparison between responders and nonresponders was possibly confounded. Patients with higher-than-median Cmax had longer DOR vs patients with lower-than-median Cmax; however, the difference was not statistically significant; this should continue to be monitored with additional follow-up. The separation in DOR curves based on Cmax was greater than that observed with stratification by median concentrations at 3 months, suggesting maximal expansion may contribute more to longer DOR in responders than the effect of transgene persistence. It has been previously shown that although persistent transgene has been observed in most responders, some patients maintained response despite loss of transgene.19 Therefore, it seems plausible that the extent of expansion drives durable responses in patients with DLBCL.
CRS, an on-target toxicity that can be managed with the CRS management algorithm,3 is the most commonly observed adverse event related to CAR-T cell therapies.3,22 There were no CRS-related deaths in the study, and CRS was generally manageable using the CRS management algorithm.5 The trend for higher tisagenlecleucel expansion with increasing CRS severity seen in DLBCL patients is consistent with pediatric B-ALL and CLL studies,7 despite lower expansion in DLBCL. This suggests that transgene levels in peripheral blood, irrespective of indication, are related to CRS severity. It is likely that following target engagement, proinflammatory cytokines secreted by CAR-T cells and bystander cells promote expansion.23 Patients who received tocilizumab for CRS management experienced greater tisagenlecleucel expansion. However, patients with higher grade CRS generally have greater expansion and require tocilizumab per the CRS algorithm3 ; hence, the observed effects cannot be attributed to tocilizumab use. Patients treated with corticosteroids had greater tisagenlecleucel exposure. This effect might have been confounded by tocilizumab administration (because most patients who received tocilizumab also received corticosteroids), CRS, or baseline tumor burden. Most patients treated with corticosteroids in JULIET received <2 mg/kg methylprednisolone/day for a short duration and were weaned rapidly, per the CRS management algorithm. The effect of corticosteroids on efficacy could not be determined as only a limited number of patients required intervention with steroids for CRS management. However, previous model-based analyses indicated no effect of tocilizumab or corticosteroids on rate of tisagenlecleucel transgene expansion in pediatric/young adult patients with B-ALL.24 Our analysis found no relationships between exposure and neurologic events, consistent with results reported in patients with B-ALL and CLL.7
Analyses of B-cell aplasia following tisagenlecleucel infusion were confounded because of prior rituximab use. Most patients had baseline B-cell aplasia, which was expected given measurable preinfusion rituximab levels.5 Mean baseline CD19+ B-cell levels were higher in patients with baseline rituximab below the LLOQ compared with those above LLOQ.5 Nevertheless, there was a trend toward increasing B-cell levels with declining transgene levels postinfusion. Additionally, despite transgene persistence, normal B cells often recovered in patients with DLBCL who remained in remission.5 These results differ from those in patients with B-ALL, where transgene persistence and durable clinical responses were more closely related to ongoing B-cell aplasia.3,9
Determination of a safe/efficacious dose range is based on understanding dose-response/exposure/safety analyses. Analyses conducted for dose justification indicated no apparent relationship between tisagenlecleucel dose and exposure. CAR-T cells have demonstrated the ability to undergo a rapid multilog expansion beyond the initial infused dose9 ; therefore, there is no relationship between dose and peak expansion or exposure. In DLBCL, CAR-T cells can further traffic to tumor sites and therefore transgene levels measured in blood may not represent the overall expansion of CAR-T cells. Responses were observed across a wide dose range (0.6 × 10⁸ to 6.0 × 10⁸ CAR+ T cells) and no impact of infused tisagenlecleucel dose on DOR was observed because variation in degree of expansion was greater than variation in infused dose. An association was previously observed between baseline tumor volume and CRS severity.16 The relationship between dose and high-grade CRS in this analysis was not significant after adjusting for baseline tumor burden measured by tumor volume using positron emission tomography, indicating the important effect of baseline disease burden on CRS severity and consistent with observations in pediatric/young adult patients with B-ALL.7 No relationships were found between dose and neurologic events, consistent with results reported in patients with B-ALL with persistence measured beyond 1 year.9 Based on all available data, the recommended dose for tisagenlecleucel in DLBCL patients was determined to be a single intravenous infusion of 0.6 × 10⁸ to 6.0 × 10⁸ CAR+ viable T cells.
Although most patients had detectable preexisting anti-mCAR19 antibodies at baseline, this had no effect on tisagenlecleucel expansion. Similar preexisting antibodies (usually low affinity, low titer) have been detected for a variety of biotherapeutics and generally do not affect efficacy, safety, or risk of posttreatment antidrug antibody development.25 Postinfusion antibodies and cellular immunogenicity did not affect overall responses.
Other studies evaluating anti-CD19 CAR-T cell therapies in patients with non-Hodgkin lymphoma (NHL), including DLBCL, have demonstrated associations between cellular kinetics and clinical outcomes. The ZUMA-1 trial with axicabtagene ciloleucel (CD28 costimulation) in patients with relapsed/refractory NHL found that CAR-T expansion was associated with response, exposure was associated with response, and peak expansion and AUC were associated with neurologic events (grade ≥3).20,26 A phase 1 JCAR017 (4-1BB costimulation) trial in patients with relapsed/refractory aggressive B-NHL demonstrated an association between higher mean peak levels and 3-month durable responses.27 Data on a CAR-T therapy from Fred Hutchinson Cancer Research Center (4-1BB costimulation)28 revealed that higher peak CAR-T cell numbers were associated with high-grade CRS in patients with relapsed/refractory B-ALL, CLL, or NHL,8 similar to our study. In contrast, ZUMA-1 with axicabtagene ciloleucel did not report any associations between peak expansion or AUC and high-grade CRS.20 Relationships between baseline tumor burden and CRS were also not observed with axicabtagene ciloleucel20,29 ; however, the sample size was limited. The discordance between the observations noted in JULIET and other CAR-T studies in DLBCL may be due to differences in costimulatory domains (4-1BB vs CD28), reported units (copies/µg vs cells/µL), or other study or population-related differences.
In summary, tisagenlecleucel demonstrated rapid expansion reaching maximum transgene levels approximately 9 days postinfusion, followed by sustained persistence for up to 24 months in relapsed/refractory DLBCL. Most patients who responded to therapy had tisagenlecleucel persistence in blood >6 months, and those who experienced high-grade CRS were more likely to have greater tisagenlecleucel expansion. This report characterizes tisagenlecleucel cellular kinetics in adult patients with relapsed/refractory DLBCL. Delineating tisagenlecleucel cellular kinetics and its relationship with other endpoints including safety, efficacy, and dose in DLBCL improved our understanding of how cellular kinetics affect efficacy and safety and how various factors affect cellular kinetics. Furthermore, the analyses investigating the effect of dose on in vivo expansion, safety, and efficacy endpoints helped establish the recommended dose for DLBCL.
These data were previously presented in part at the 59th annual meeting of the American Society of Hematology, Atlanta, GA, 9-12 December 2017, and at the annual meeting of the American Association for Cancer Research, Chicago, IL, 14-18 April 2018.
Novartis is committed to sharing with qualified external researchers access to patient-level data and supporting clinical documents from eligible studies. These requests are reviewed and approved by an independent review panel on the basis of scientific merit. All data provided are anonymized to respect the privacy of patients who have participated in the trial in line with applicable laws and regulations. This trial data will remain available indefinitely according to the criteria and process described on www.clinicalstudydatarequest.com.
Acknowledgments
The authors thank all the patients and their families and caregivers for participating in this study, as well as the investigators and site personnel. The authors also thank Jason Hamilton of Legend Biotech, Piscataway, NJ (former employee of Novartis), for his contributions to the analyses and critical review of the manuscript; Feng Tai (former employee of Novartis) for his assistance with the statistical analysis; and Navigate BioPharma Services for the analysis of quantitative polymerase chain reaction and flow samples. The authors also thank the following teams at Novartis Pharmaceuticals Corporation for their assistance: Precision Medicine for CD19 expression data, Analytical Stewardship for analyses related to product characteristics data, and the Bioanalytical team and Sample Management for monitoring of bioanalytical assays.
This study and writing assistance were supported by Novartis Pharmaceuticals Corporation, East Hanover, NJ. Medical writing assistance was provided by Beena John and Rozena Varghese, CMPP, of C4 MedSolutions, LLC (Yardley, PA), a CHC Group company.
M.J.K. participated in this study on behalf of Hemato-Oncologie voor Volwassenen Nederland (HOVON—The Haemato Oncology Foundation for Adults in The Netherlands)/Lunenburg Lymphoma Phase I/II Consortium (LLPC) and on behalf of the Lymphoma and Myeloma CAre and REsearch Center, Amsterdam (LYMMCARE).
Authorship
Contribution: All authors substantially contributed to the conception or design of the work; or the acquisition, analysis, or interpretation of data for the work; and the drafting of the work or revising it critically for important intellectual content; and provided final approval of the version to be published; and agree to be accountable for all aspects of the work in ensuring that questions related to the accuracy or integrity of any part of the work are appropriately investigated and resolved.
Conflict-of-interest disclosure: R.A. is an employee of Novartis Institutes for BioMedical Research and owns stock in Cara Therapeutics, Exelixis, Ultragenyx, Aeterna Zentaris, Celgene, and Novartis Pharmaceuticals. L.P. and E.W. are employees of Novartis Pharmaceuticals Corporation, East Hanover, NJ. C.S.T. has received honoraria from Novartis and personal fees from Janssen and AbbVie. U.J. has received honoraria from AbbVie, Amgen, AOP Orphan, Celgene, Emergent, Gilead, GlaxoSmithKline, Janssen, Mundipharma, Novartis, Roche, and Takeda–Millennium; participated in advisory roles for AbbVie, Millennium, Mundipharma, Novartis, Roche, and Celgene; and received research funding from Celgene, Emergent, Gilead, Infinity, Janssen, Mundipharma, Novartis, Roche, Takeda–Millennium, and TrueNorth Therapeutics. P.B. has received honoraria from Novartis, Takeda, Bristol-Myers Squibb, Roche, Celgene, and MSD; received research funding from Takeda; and served in an advisory or expert testimony role for Novartis, Takeda, Bristol-Myers Squibb, Roche, Amgen, and Celgene. S.J. has received research funding from Novartis and served in a consulting or advisory role for Kite and Juno. S.R.F. has received honoraria from Novartis, Celgene, and Amgen; has received travel/accommodations/expenses from Novartis and Jazz Pharmaceuticals; has served in a consulting or advisory role for Novartis; and has participated in speakers’ bureaus for Celgene and Janssen. K.v.B. has received research funding from Novartis Pharmaceuticals Corporation. N.D.W.-J. has participated in advisory boards for Bayer, Gilead, JUNO, and ADC Therapeutics. M.J.K. has received clinical trial grants/research funding from Roche, Celgene, and Millennium/Takeda and has received honoraria for speaking at satellite symposia and attending advisory boards for Novartis, Celgene, Roche, BMS, Amgen, Janssen, and Kite Pharma/Gilead. S.J.S. has received clinical trial grants/research funding from Novartis Pharmaceuticals Corporation, Celgene, Genentech, and Merck; has served in a consulting role for Novartis Pharmaceuticals Corporation, Celgene, Genentech, and Gilead; has participated in steering committees for Novartis Pharmaceuticals Corporation, Nordic Nanovector, and Celgene; has participated in advisory boards/committees for Celgene, Genentech, Gilead, Merck, Nordic Nanovector, Pfizer, and Pharmacyclics; has given presentations for Dava Oncology, OncLive, i3Health, and Physicians’ Education Resource, LLC; is involved in planned clinical research collaborations with Nordic Nanovector; and serves on the Scientific Board of Advisors (unpaid) for OncoViRx. G.S. has received honoraria from Janssen, Gilead, Celgene, Novartis, Amgen, Servier, BMS, Merck, MOrphosys, Roche, Acerta, Pfizer, Epizyme, and AbbVie; has served in a consulting role for Gilead, Celgene, Novartis, Amgen, Servier, BMS, Merck, MOrphosys, Roche, Acerta, Pfizer, Epizyme, and AbbVie; and serves on steering committees for Novartis. R.T.M. has received honoraria from Incyte, Kite Therapeutics, Novartis Pharmaceuticals Corporation, Juno Therapeutics, and Jazz Pharmaceuticals; has served in a consulting role for Incyte, Athersys, and CRISPR Therapeutics; has received research funding from Novartis Pharmaceuticals Corporation; has served as chair of the Scientific Steering Committee for the JULIET trial; and has a patent “Immunomodulary Properties of Multipotent Adult Progenitor Cells and Uses Thereof (#8,147,824)” with royalties paid to Athersys. Ö.A. is an employee of Novartis Pharma AG. C.d.C., J.C., and I.G. are employees of Novartis Pharmaceuticals Corporation. I.P.-M. and A.C. are employees of Novartis Institutes for BioMedical Research. K.T.M. is an employee of and owns stock in Novartis Pharmaceutical Corporation. E.K.W. is an employee in a leadership position with equity ownership in Cambium Medical Technologies; owns stock in Cerus Corporation and Chimerix; has received research funding from Celldex, Novartis, and Pharmacyclics; has served in a consulting or advisory role for Kalytera and Novartis; has participated in advisory committees for Novartis; and has received travel expenses from Pharmacyclics. In addition, E.K.W. has a patent “Method of allogeneic hematopoietic stem cell transplantation without graft failure or graft vs. host disease” (#5,800,539) licensed to Cerus, a patent “Mouse model with human immune system” (#6,060,643) issued, a patent “Methods for treating cancer using allogeneic lymphocytes without graft versus host disease activity” (#6,213,127) licensed to Cerus, a patent “Compositions and methods for the expression of factor VIII polypeptides and uses therefore” (#6,517,830) issued, a patent “Methods for the treatment of graft-versus-host disease” (#8,486,408) issued, a patent “Methods for managing graft versus host disease” (#9,458,217) licensed to Cambium Oncology, a patent “Antagonism of the VIP signaling pathway” (#9,669,092) licensed to Cambium Oncology, a patent “Managing Graft Versus Host Disease (GvHD) Using Indole Carboxyaldehydes or Derivatives Thereof” (US20170079950A1) issued, a patent “Compositions, uses, and preparation of platelet lysates” (#9,688,959) with royalties paid to Cambium Medical Technologies, a patent “Compositions and Uses of Vasoactive Intestinal Peptide (VIP) Antagonists licensed to Cambium Oncology”, a patent “Methods of treating cancer and infectious diseases using cell based therapies” (PCT/US2017/026222) licensed to Cambium Oncology, a patent “Antagonism of the VIP signaling pathway” (PCT/US2012/023268) licensed to Cambium Oncology, a patent “VIP Antagonists, Nanoparticles, and Uses in Treating Cancer” (#62/661,236) licensed to Cambium Oncology, a patent “Nanoparticles conjugated with an antagonist for VIP” (#62/584,196) licensed to Cambium Oncology, and a patent “VIP and VIP Agonists, Nanoparticles, and Uses in Inflammatory T-Cell Mediated Disease” (#62/661,214) licensed to Cambium Oncology.
Correspondence: Rakesh Awasthi, Novartis Institutes for BioMedical Research, 3540C Building 315, One Health Plaza, East Hanover, NJ 07936; e-mail: rakesh.awasthi@novartis.com.

