

Key Points
Common progenitor cells exist in clonally related concomitant chronic lymphocytic leukemia and acute myeloid leukemias.
CLL cells dedifferentiated to clonally related myeloid cells posttransplantation.
Introduction
B-cell plasticity was recognized clinically and experimentally decades ago.1,2 B-cell neoplasms (eg, chronic lymphocytic leukemia [CLL] and follicular lymphoma) occasionally “transdifferentiate” into clonally related histiocytic sarcoma (a myeloid neoplasm) or acute myeloid leukemia (AML).3-7 These patients often present with advanced disease and have a poor prognosis related to difficulties in making a definitive diagnosis and lack of standard treatment.4,6,8-10 Mechanistically, it has been shown that overexpression of CEBPα and/or deletion of PAX5 can induce B-cell transdifferentiation into myeloid cells.1,11-13 However, the clinical significance of these experimental manipulations is unclear. We recently demonstrated that coactivation of NF-κB and Notch signaling in committed B cells primes them to convert to the myeloid lineage through dedifferentiation after exposure to a permissive microenvironment.14 However, the clinical relevance of our findings and the processes involved in the conversion of human B-cell leukemia to myeloid disorders need to be explored further.
Methods
Flow cytometry
Thawed CLL (n = 4; 3 from peripheral blood and 1 from bone marrow) or CLL/AML (n = 2; case 1 is from peripheral blood; case 2 is from bone marrow) mononuclear cells were washed with ice-cold FACS buffer (phosphate buffered saline with 2% fetal bovine serum) and stained for 20 to 30 minutes at 4°C in FACS buffer containing antibodies against human CD45, CD34, CD19, CD20, CD5, CD11b, CD33, and CD3 (all from BD Biosciences). CLL and/or AML cells were sorted with a FACSAria II (BD Biosciences) and used for sequencing, polymerase chain reaction (PCR) analysis, and/or transplantation. For posttransplantation donor cell (from peripheral blood and bone marrow) analysis and sorting, mouse CD45.1 antibody was added to the above antibody combination. Data were analyzed and prepared using FlowJo software (Becton Dickinson).
Next-generation sequencing
Genomic DNA was extracted using a PureGene kit (Qiagen). For fractions with <20 ng of genomic DNA, whole genome amplification was performed (REPLI-g Minikit; Qiagen). A custom PCR-based panel of 30 genes [ASXL1, BRAF, CBL, CEBPA, DNMT3A, EZH2, FLT3, GATA2, HRAS, IDH1, IDH2, JAK2, KIT, KRAS, KMT2A (MLL), NF1, NPM1, NRAS, PHF6, PTEN, PTPN11, RUNX1, SETBP1, SF3B1, SRSF2, TET2, TP53, U2AF1, WT1, and ZRSR2], designed with AmpliSeq Designer (Ion-Torrent; ThermoFisher) in 2 primer pools, was used for library preparation using an Ion AmpliSeq library kit and a 10-ng template of DNA per primer pool. This generates 458 amplicons per library. Library quality was assessed by measuring concentrations using a fluorometer (Qubit 2.0 fluorometer; ThermoFisher) to determine an optimal range of 100 to 3000 ng/mL. Amplicon libraries were prepared for sequencing using an Ion 520 or Ion 530 Ion Chef Kit (ThermoFisher), which includes the reagents and materials to prepare template-positive Ion Sphere Particles on the Ion Chef instrument and to load Ion 520 or Ion 530 semiconductor chips for sequencing by synthesis on the Ion S5 XL sequencer. Sequence data were processed and mapped to human genome reference GRCh37/hg19, and variant calls were made using Ion Torrent Suite (TS version 5.2) software and further analyzed using a laboratory-developed pipeline.
Statistical analysis
The Student t test was used for all statistical analyses, and significance was set at P < .05. Data are mean ± standard error of the mean.
Results and discussion
Concurrent B and myeloid leukemias share common progenitors
We obtained limited deidentified material from 2 patients with a history of CLL who later developed concurrent CLL and AML. Detailed immunophenotyping did not show expression of the B-cell markers CD19 and CD20 in AML components in either case (supplemental Figure 1A-B). The AML blasts were CD33+CD34− (AML) in the first case (supplemental Figure 1C). Interestingly, a small proportion (2.3%) of leukemia cells expressed B and myeloid markers (CD19+CD33+, transitional) compared with CLL cells (CD19+CD33−) (supplemental Figure 1C). We favor that these cells represent a transition from B to myeloid leukemia, given the fact that the patient had a long history of CLL before the development of AML and the presence of immunoglobulin heavy chain (IgH) gene rearrangement (Figure 1E). We sorted different cell populations using fluorescence-activated cell sorting (FACS), extracted genomic DNA, and performed targeted next-generation sequencing (NGS) (Figure 1A). CBL mutations with variable variant allele frequencies (VAFs) were detected in lymphoid and myeloid leukemia populations (Figure 1A), indicating that they share a common progenitor. In addition, NPM1 and TET2 mutations were only detected in the transitional population (CD19+CD33+) and AML cells (CD19−CD34−CD33+), suggesting that NPM1 and TET2 are possibly involved in myeloid clonal expansion. Interestingly, these mutations were not present in the residual CD34+ progenitor cells (Figure 1A). Limited quantitative PCR analysis showed decreased expression of the B-cell transcription factor PAX5, BACH2 (lymphoma and myeloid gene suppressor), NF-κB2 and RELB (NF-κB components), and NOTCH1 receptor, as well as upregulation of the myeloid transcription factors CEBPα and PU.1 during conversion of CLL cells to transitional and AML cells (supplemental Figure 1D), consistent with the gene-expression changes that we observed in mouse studies.14 AML blasts in the second case were CD19−CD34+CD38+ (supplemental Figure 2A). Targeted NGS using FACS-sorted different cell populations with high purity (supplemental Figure 2B) detected shared NRAS, NF1, U2AF1, and TET2 somatic mutations in CLL cells (CD19+CD34−), AML cells (CD19−CD34+CD38+), and residual CD34+ progenitor cells (CD19−CD34+CD38−) (Figure 1B), further demonstrating the existence of a common progenitor. Given that the same mutations with high VAFs were detected in lymphoid and myeloid leukemias in both cases, it is unlikely that the high VAF of lymphoid leukemia cells was due to a small amount of contaminated AML cells. We noted the report that patient CLL cells are difficult to purify and, even with >99% purity, IgH gene rearrangement could be detected in non-CLL cells.15 However, the published data may be reasonably interpreted differently from the angle that the IgH gene rearrangement in non-CLL cells might reflect the in vivo evidence of B-myeloid conversion.
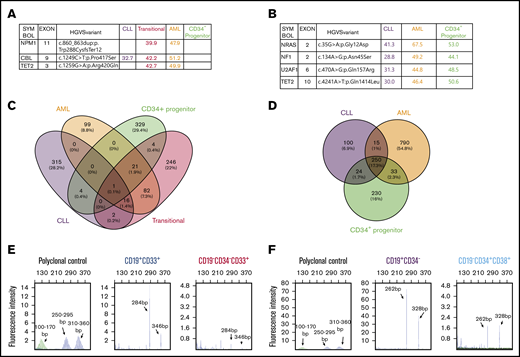
The existence of B and myeloid common progenitors in clonally related CLL and AML. Somatic mutations and VAFs detected in different FACS-sorted cell fractions from the first (A) and second (B) concurrent CLL/AML case. These mutations were confirmed by WES. (C-D) Somatic mutations in the different sorted subpopulations detected by WES. Venn diagrams showing the numbers and percentages of somatic mutations in the first (C) and second (D) cases, respectively. The mutated genes are listed in supplemental Table 1. (E-F) BIOMED-2 genomic PCR for detection of IgH gene rearrangements in different FACS-sorted subpopulations. The range of product sizes in normal polyclonal background are labeled. The detection of positive peaks was expected between the regions of 310 to 360 bp and 250 to 295 bp. Note that the same IgH gene rearrangements were detected in transitional (CD19+CD33+) and AML (CD19−CD33+CD34−) leukemia cells in the first case (E) and in CLL (CD19+CD34−) and AML (CD19−CD34+CD38+) cells in the second case (F). No amplification was detected in other fractions shown in panels A and B because of the limited amount or the quality of genomic DNA.
The existence of B and myeloid common progenitors in clonally related CLL and AML. Somatic mutations and VAFs detected in different FACS-sorted cell fractions from the first (A) and second (B) concurrent CLL/AML case. These mutations were confirmed by WES. (C-D) Somatic mutations in the different sorted subpopulations detected by WES. Venn diagrams showing the numbers and percentages of somatic mutations in the first (C) and second (D) cases, respectively. The mutated genes are listed in supplemental Table 1. (E-F) BIOMED-2 genomic PCR for detection of IgH gene rearrangements in different FACS-sorted subpopulations. The range of product sizes in normal polyclonal background are labeled. The detection of positive peaks was expected between the regions of 310 to 360 bp and 250 to 295 bp. Note that the same IgH gene rearrangements were detected in transitional (CD19+CD33+) and AML (CD19−CD33+CD34−) leukemia cells in the first case (E) and in CLL (CD19+CD34−) and AML (CD19−CD34+CD38+) cells in the second case (F). No amplification was detected in other fractions shown in panels A and B because of the limited amount or the quality of genomic DNA.
To further validate the targeted NGS results and seek more insights into the clonal relationships between different subpopulations in each sample, we performed whole-exome sequencing (WES) using the same genomic DNAs used for targeted NGS. The mutations detected by targeted NGS in both cases were confirmed by WES (supplemental Figure 2C-D). In the first case, there were 16 somatic mutations shared by CLL, transitional, and AML cells, suggesting the existence of common progenitors among different subpopulations. In addition, more shared mutations (120) were identified between transitional and AML cells than between CLL and transitional cells (19), suggesting that the 120 shared mutations (eg, NPM1, TET2, ASXL1, PIM1, and ATM) might be involved in lineage conversion and clonal expansion (Figure 1C; supplemental Table 1). In the second case, there were more shared somatic mutations (250; eg, ATM, ASXL1, WNK1, NRAS, NF1, U2AF1, TET2, and BACH2) among CLL, AML, and progenitor cells (Figure 1D; supplemental Table 1), further suggesting the existence of common progenitors. Note that ATM is frequently mutated in CLL and is also maintained in AML. In addition, BACH2 plays a critical role in B-myeloid conversion, as shown in our previous studies, and is a shared mutation in the second case, even though we do not know the function of this mutation. In contrast to a transitional stage with a gradual increase in the mutation numbers observed in the first case, the CLL to AML conversion seems more direct, given the large number of shared mutations observed in the second case. The unique mutations detected in the CD34+ progenitor cells in both cases do not seem to be directly involved in the development of CLL and AML. Details of the mutated genes in each subpopulation are listed in supplemental Table 1. How these mutations contribute to CLL to AML conversion and expansion is unclear and needs to be investigated further. Interestingly, clonality analysis of both cases demonstrated that the same IgH gene rearrangement was detected in CLL and AML cells but not in the residual progenitor cells (Figure 1E-F; data not shown), strongly supporting B-myeloid conversion in these 2 cases. We validated the above clonality results by regular genomic PCR in combination with gene-expression analysis using the available genomic DNA and messenger RNA from the first case. Our results clearly demonstrated that the expression of CD19 and CD11b messenger RNA was limited in the sorted CLL and AML cells, respectively, whereas IgH gene recombination was detected in CLL and AML cells, providing further evidence that AML cells were unlikely contaminated by CLL cells (supplemental Figure 2E). It is intriguing that, among the shared mutations in both cases, many are not traditional CLL driver mutations, with the exception of ATM (eg, TET2, NF1, NRAS, U2AF1, ASXL1, and CBL mutations, which are rarely detected in CLL).16-19 In contrast, these mutations are more commonly detected in age-related clonal hematopoiesis and myeloid leukemia,20-22 suggesting that there is a specific subgroup of CLL with myeloid-biased somatic mutation that gives them the potential to convert to myeloid leukemia.
CLL cells convert to myeloid lineage in vivo
The above results are consistent with the reported CLL “transdifferentiation” to clonally related AML or histiocytic sarcoma. To directly test whether human CLL has the ability to convert to myeloid lineage, we sorted CLL cells from CLL patient peripheral blood samples and transplanted them into busulfan-conditioned NSGS mice. The sorting purity reached 99%, and the transplanted cells [CD19+CD5+CD20(subset)+] had a typical CLL immunophenotype (supplemental Figure 3A-B). In our pilot experiments, we were unable to detect donor cells in the peripheral blood of all 9 recipient mice at 10 days posttransplantation (4 million cells per recipient; data not shown), but we could detect small numbers of donor cells 4 to 5 days posttransplantation. However, the numbers of B cells detectable among donor cells were decreased, and the majority of transplanted CLL cells (CD19+CD5+CD3−CD34−CD33−) converted to CD19−CD11b− immature cells or CD19−CD11b+ myeloid cells. Intriguingly, we detected CD34+ donor cells among CD19−CD11b− immature cells in some recipient mice (Figure 2A-B; supplemental Figure 3C), indicating that CLL cells transiently dedifferentiated into an immature population. Interestingly, IgH gene rearrangement analysis detected the same IgH rearrangement in the pretransplanted CLL cells (CD45+CD19+CD20dim) and posttransplanted donor-derived immature cells (CD45+CD19−CD11b−) and myeloid cells (CD45+CD19−CD11b+) (Figure 2C). These data clearly demonstrate that CLL cells can convert to myeloid lineage in vivo through dedifferentiation. However, these converted myeloid cells could not survive longer and expand in the recipient mice, because no chimerism was detected 10 days posttransplantation. A more efficient xenograft model is needed to further improve the engraftment efficacy and monitor the fate of these converted myeloid cells.
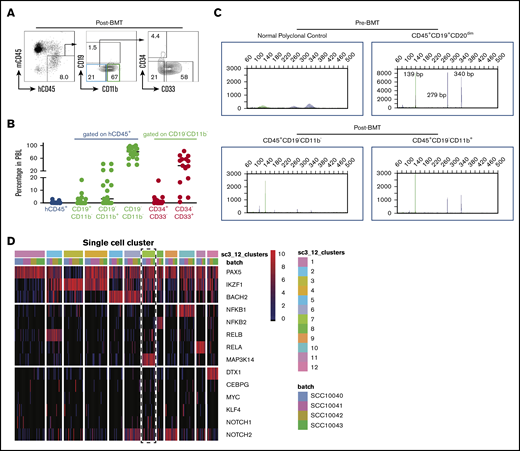
CLL cells convert to myeloid lineage in vivo. (A) Representative FACS plots of donor cells on day 4.5 posttransplantation (n = 15). (B) Percentages of donor peripheral blood engraftment and different subpopulations (n = 15). Donor CLL cells are from 4 deidentified CLL patients. Each circle represents an individual mouse. (C) Representative BIOMED-2 genomic PCR for detection of IgH gene rearrangements in FACS-sorted pretransplanted CLL cells and posttransplanted subpopulations. The detection of positive peaks was expected between the regions of 250 to 295 bp and 310 to 360 bp. Note that the same IgH gene rearrangements were detected in the pretransplanted CLL cells (CD45+CD19+CD20dim) and posttransplanted donor-derived immature cells (CD45+CD19−CD11b−) and myeloid cells (CD45+CD19−CD11b+) cells (n = 2). (D) Twelve distinct clusters were detected in CLL samples by single-cell RNA sequencing. Note the coexpression of Notch1/2 and Map3k14/NIK with lower expression of BACH2 in cluster 7 (dashed rectangle). BMT, bone marrow transplantation; h, human; m, mouse; PBL, peripheral blood leukocytes.
CLL cells convert to myeloid lineage in vivo. (A) Representative FACS plots of donor cells on day 4.5 posttransplantation (n = 15). (B) Percentages of donor peripheral blood engraftment and different subpopulations (n = 15). Donor CLL cells are from 4 deidentified CLL patients. Each circle represents an individual mouse. (C) Representative BIOMED-2 genomic PCR for detection of IgH gene rearrangements in FACS-sorted pretransplanted CLL cells and posttransplanted subpopulations. The detection of positive peaks was expected between the regions of 250 to 295 bp and 310 to 360 bp. Note that the same IgH gene rearrangements were detected in the pretransplanted CLL cells (CD45+CD19+CD20dim) and posttransplanted donor-derived immature cells (CD45+CD19−CD11b−) and myeloid cells (CD45+CD19−CD11b+) cells (n = 2). (D) Twelve distinct clusters were detected in CLL samples by single-cell RNA sequencing. Note the coexpression of Notch1/2 and Map3k14/NIK with lower expression of BACH2 in cluster 7 (dashed rectangle). BMT, bone marrow transplantation; h, human; m, mouse; PBL, peripheral blood leukocytes.
We recently reported that B cells with coactivation of NF-κB and Notch have increased potential to convert to myeloid lineage.14 To determine whether there is a subpopulation of CLL cells with higher NF-κB/Notch activity, we reanalyzed our published single-cell RNA-seq data, which include 384 single CLL cells from 4 patients.17 To achieve robust analysis, we filtered out genes with <4 reads and present in <5 cells. This resulted in 314 single cells for downstream analysis. We first used genes related to both pathways to perform consensus clustering by the SC3 pipeline. To find the optimal number of clusters (k-means), we evaluated 2 to 15 clusters by silhouette and consensus matrix and chose 12 clusters to proceed with marker gene analysis (Figure 2D). Interestingly, within these clusters, we found 1 small cluster of CLL cells (15 cells) with increased expression of NOTCH1/2 and MAP3K14/NIK and decreased expression of BACH2 (Figure 2D), indicating that both pathways were activated in these cells. Because of the limited number of cells that possess these features and the low coverage of genes in the existing data set, we were unable to identify the gene-expression signature of these cells. In addition, we do not know whether they are associated with specific somatic mutations and whether this subpopulation can convert more efficiently to myeloid lineage because we did not have the means to identify and isolate them. It should be noted that the gene-expression analyses using sorted bulk CLL cells did not show significant differences in the expression of BACH2, RELB, NF-κB2, and NOTCH1 between CLL cells from patients with or without concurrent AML (supplemental Figure 3D), suggesting that future studies using combined transcriptomic and gene mutation analysis at the single-cell level are required to further characterize this subpopulation and determine whether they have greater potential to convert to the myeloid lineage. Although our somatic mutational analyses clearly demonstrate the existence of common lymphoid and myeloid leukemia progenitors and are consistent with some previous studies,23,24 we recognize that not all reported cases show a clonal relationship by targeted gene sequencing between concurrent or sequentially developed lymphoid and myeloid tumors.25 However, analysis of these types of cases using WES may be more informative, as evidenced by the cases presented here.
In summary, our studies clearly show the existence of common progenitor cells in at least some concurrent lymphoid/myeloid neoplasms, as well as demonstrate for the first time that CLL cells can dedifferentiate to myeloid cells. Knowledge gained from future studies along this line will be highly relevant to understanding the mechanisms of B-myeloid conversion and further malignant transformation, which will provide more insights to prevent and target these rare, but fatal, tumors. In addition, the knowledge obtained will contribute to understanding of the pathogenesis of Hodgkin lymphoma (expressing myeloid marker CD15 along with defective B-cell programing), mixed phenotype acute leukemia, and therapy-related myeloid neoplasms, for which lymphoma is the second most common underlying disease. We hope that this report will act as a springboard for future mechanistic studies of B-myeloid conversion.
Data sharing requests should be sent to Chen Zhao (cxz545@case.edu).
Acknowledgments
The authors thank Aaron Stence (Molecular Pathology, University of Iowa) for NGS and IgH gene-rearrangement analyses, Heath Vignes and Michael Shey (University of Iowa Flow Cytometry Core facility) for cell sorting, and John C. Byrd (Ohio State University) and Brian Link, George Weiner, and Angela Merriss (University of Iowa) for assistance with human sample collection.
This work was supported by Merit Review Award (I01 BX004255) from the US Department of Veterans Affairs Biomedical Laboratory R&D (BLRD) Service, the National Institutes of Health, National Cancer Institute (R01CA237006) (C.Z.), the National Institutes of Health, National Institute of Arthritis and Musculoskeletal and Skin Diseases (R01 AR043510) and the National Institutes of Health, National Institute on Aging (R01AG049994) (B.B.).
Authorship
Contribution: Q.D., Y.X., A.B., H.W., W.X., and J.Z. performed experiments and analyzed data; L.W., and M.J. analyzed single-cell RNA sequencing and WES data; S.S. assisted with flow cytometry analysis; B.B., Q.L., H.S., and M.Q.A. assisted with data interpretation and revised the manuscript; and C.Z. conceived and supervised the overall study and wrote the manuscript.
Conflict-of-interest disclosure: The authors declare no competing financial interests.
Correspondence: Chen Zhao, Case Western Reserve University, Wolstein Research Building, Room 6523, 2103 Cornell Rd, Cleveland, OH 44106-7288; e-mail: cxz545@case.edu.

