

TO THE EDITOR:
Malcovati et al1 recently proposed SF3B1-mutant (SF3B1MT) myelodysplastic syndrome (MDS) to be a distinct nosologic entity defined by cytopenias, somatic SF3B1 mutation, morphologic dysplasia (with or without ring sideroblasts [RSs]), bone marrow (BM) blasts <5%, and peripheral blood (PB) blasts <1%. Select concomitant genetic exclusion criteria are del(5q), monosomy7, inv(3)/abnormal 3q26, complex karyotype, or mutations involving RUNX1 and/or EZH2. Chronic myelomonocytic leukemia (CMML) is an MDS/myeloproliferative neoplasm (MPN) overlap syndrome characterized by sustained PB monocytosis (≥1 × 10⁹/L, ≥10% of white blood cell count [WBC]) further categorized into proliferative (WBC ≥13 × 109/L) and dysplastic (WBC <13 × 109/L) subtypes on the basis of the presenting WBC count.2 Although mutations involving pre-messenger RNA splicing are seen in ∼70% of CMML patients, these mostly involve SRSF2 (50%), with SF3B1 mutations accounting for <10% with no clear prognostic impact.3 We performed this study to compare and contrast SF3B1MT CMML with SF3B1-wild-type (SF3B1WT) CMML and SF3B1MT MDS-RS, focusing on prevalence, phenotypic correlates, epistasis with other mutations or splicing mutations, and survival outcomes.
After approval by the Mayo Clinic (Rochester, MN) and the Moffitt Cancer Center (Tampa, FL) institutional review boards, adult patients with World Health Organization (WHO)–defined CMML and MDS-RS (Mayo Clinic only) were included in the study.2 BM morphology, percentage of RSs, cytogenetics, and 2016 WHO diagnoses were retrospectively reviewed, and all patients underwent targeted next-generation sequencing for myeloid-relevant genes, which were obtained on BM mononuclear cells at diagnosis by previously described methods.4 CMML prognostication was performed by the Mayo Molecular Model and the Groupe Francophone des Myelodyplasies (GFM) model, and MDS-RS prognostication was performed by using the Revised International Prognostic Scoring System (IPSS-R).5-7 The Clinical/Molecular CMML-Specific Prognostic Scoring System (CPSS-Mol) scores could not be calculated because of incomplete data with regard to transfusion dependency. Statistical analyses considered clinical and laboratory parameters obtained at the time of diagnosis or first referral (usually within 6 months of diagnosis). Median time from diagnosis to molecular testing in the Mayo Clinic cohort was 4 months (range, 0-7 months). The Mann-Whitney U test and Fisher’s exact test were used to compare quantitative and qualitative data in subgroups. Kaplan-Meier overall survival (OS) and AML-free survival (AML-FS) estimates and Cox regression models were used for survival analysis. The Benjamini-Hochberg controlling method was used for multiple hypothesis testing.
In all, 819 patients with CMML (40 [5%] with SF3B1MT]) and 83 with SF3B1MT MDS-RS were included in the study (Table 1; supplemental Table 1). Patients with SF3B1MT CMML compared with their WT counterparts were more likely to have lower hemoglobin levels (P = .01), lower WBC counts (P = .009), lower absolute monocyte counts (AMC; P = .007), and higher platelet counts (P = .006). They were also more likely to have BM RSs (P < .001) and JAK2V617F mutations (P = .03) (Figure 1A) and less likely to have ASXL1 (P = .03) and SRSF2 (P = .02) mutations. Thirty SF3B1MT CMML patients (75%) were classified as having a dysplastic CMML subtype compared with 399 SF3B1WT patients (49%) (P = .04). Although there were fewer high-risk karyotypic abnormalities in SF3B1MT CMML patients, there was no difference between the 2 groups with regard to WHO CMML subtypes. In the Mayo Clinic cohort, 68 SF3B1WT CMML patients (14%) had BM RSs (>5%). Compared with SF3B1MT MDS-RS patients, SF3B1MT CMML patients were more likely to have higher WBC (P = .007), higher AMC (P = .005), lower platelet counts (P = .03), higher PB blast percent (P = .009), and higher BM blast percent (P = .004) and were more likely to have RUNX1 (P = .007) and JAK2V617F (P = .01) mutations (Figure 1B).
Clinical and laboratory features and subsequent events in SF3B1MT CMML, SF3B1WT CMML, and SF3B1MT MDS-RS patients
| Variable | CMML with SF3B1MT (n = 40) | CMML without SF3B1MT (n = 819) | P (CMML with vs without SF3B1MT) | SF3B1MT MDS-RS (n = 83) | P (CMML with SF3B1MT vs SF3B1MT MDS-RS |
|---|---|---|---|---|---|
| Median age (range), y | 74.5 (43-95) | 71.0 (2-95) | .07 | 74 (42-94) | .98 |
| Male sex | 26 (61.9) | 556 (67.9) | .44 | 53 (63.9) | 1.00 |
| Median hemoglobin (range), g/dL | 9.4 (6.8-13.5) | 10.9 (1.4-16.9) | .01 | 9.5 (7-13.5) | 1.00 |
| Median WBC (range), × 109/L | 8.0 (2.5-96.1) | 13.3 (1.3-288.6) | .009 | 5 (1.5-13.1) | .007 |
| Median ANC (range), × 109/L | 3.3 (0.4-54.7) | 6.5 (0.0-155.6) | .009 | 2.7 (0.4-9.4) | .14 |
| Median AMC (range), × 109/L | 1.6 (1.2-11.5) | 2.7 (1-84.0) | .007 | 0.4 (0-1.0) | .005 |
| Median platelets (range), × 109/L | 138.0 (12-840) | 98.0 (2-1945) | .006 | 259.0 (13-599) | .03 |
| Presence of IMCs | 16 (41.0) | 478 (60.4) | .06 | NA | .005 |
| Median PB blast (range), % | 0 (0-3) | 0 (0-19) | .07 | 0 (0-0) | .009 |
| Median BM blast (range), % | 3 (0-16) | 3 (0-19) | .9 | 1 (0-4) | .004 |
| Presence of RSs* | 15/17 (88) | 68/482 (14) | <.001 | 83 (100) | 1.00 |
| Median VAF SF3B1 (range), % | 40.5 (8-48) | NA | NA | 41 (9-49) | 1.00 |
| Total no. of evaluable patients with FAB CMML subtypes | 40 | 817 | .04 | NA | NA |
| dCMML | 30 (75) | 399 (48.8) | NA | ||
| pCMML | 10 (25) | 418 (51.2) | NA | ||
| Total no. of evaluable patients with WHO 2016 CMML subtypes | 39 | 778 | .25 | NA | NA |
| CMML-0 | 29 (74.4) | 461 (59.3) | NA | ||
| CMML-1 | 7 (17.9) | 184 (23.7) | NA | ||
| CMML-2 | 3 (7.7) | 133 (17.1) | NA | ||
| Total no. of evaluable patients with CPSS-Mol cytogenetic risk stratification | 39 | 752 | .03 | 83 | 1.00 |
| Low | 29 (74.4) | 555 (73.8) | 66 (79.5) | ||
| Intermediate | 9 (23.1) | 85 (11.3) | 13 (15.7) | ||
| High | 1 (2.6) | 112 (14.9) | 4 (4.8) | ||
| Total no. of evaluable patients with NGS analysis | 40 | 567 | 83 | ||
| Epigenetic regulators | |||||
| TET2 | 17 (42.5) | 295 (52.0) | .39 | 21 (25.6) | .15 |
| IDH1 | 2 (5.0) | 5 (0.9) | .14 | 0 (0) | .23 |
| IDH2 | 2 (5.0) | 29 (5.1) | 1.00 | 1 (1.2) | .50 |
| DNMT3A | 7 (17.5) | 34 (6.0) | .05 | 16 (19.3) | 1.00 |
| Chromatin regulators | |||||
| ASXL1 | 4 (10.0) | 277 (48.9) | .03 | 11 (13.3) | 1.00 |
| EZH2 | 1 (2.5) | 45 (7.9) | .50 | 2 (2.4) | 1.00 |
| Transcription factor | |||||
| RUNX1 | 8 (20.0) | 78 (13.8) | .41 | 2 (2.4) | .007 |
| Spliceosome component genes | |||||
| SRSF2 | 5 (12.5) | 253 (44.6) | .02 | 2 (2.4) | .09 |
| U2AF1 | 0 (0) | 42 (7.4) | .18 | 0 (0) | 1.00 |
| ZRSR2 | 1 (2.5) | 36 (6.3) | .66 | NA | NA |
| Cell signaling | |||||
| NRAS | 5 (12.5) | 90 (15.9) | .72 | NA | NA |
| KRAS | 0/17 (0) | 19/313 (6.1) | .75 | NA | NA |
| CBL | 3 (7.5) | 88 (15.5) | .28 | 2 (2.4) | .62 |
| PTPN11 | 0/17 (0) | 9/313 (2.9) | .66 | NA | NA |
| JAK2 | 7 (17.5) | 40 (7.1) | .03 | 1 (1.2) | .01 |
| CSF3R | 0/17 (0) | 4/313 (1.3) | .76 | 3 (3.6) | 1.00 |
| KIT | 1 (2.5) | 24 (4.2) | .90 | NA | NA |
| MPL | 0 (0) | 5 (0.9) | .92 | NA | NA |
| CALR | 0/17 (0) | 1/313 (0.3) | .92 | NA | NA |
| Tumor suppressor gene | |||||
| TP53 | 1 (2.5) | 16 (2.8) | 1.00 | 3 (3.6) | 1.00 |
| Other | |||||
| SETBP1 | 0 (0) | 62 (10.9) | .10 | 2 (2.4) | 1.00 |
| No. of assessable patients for stratification by the Mayo Molecular Model | 40 | 809 | .02 | NA | NA |
| Low risk | 6 (15.0) | 93 (11.5) | NA | ||
| Intermediate-1 risk | 20 (50.0) | 265 (32.8) | NA | ||
| Intermediate-2 risk | 12 (30.0) | 237 (29.3) | NA | ||
| High risk | 2 (5.0) | 214 (26.5) | NA | ||
| No. of assessable patients for stratification by the GFM Model | 40 | 809 | .04 | NA | NA |
| Low risk | 27 (67.5) | 358 (44.3) | NA | ||
| Intermediate risk | 11 (27.5) | 320 (39.6) | NA | ||
| High risk | 2 (5.0) | 131 (16.2) | NA | ||
| No. of assessable patients for stratification by the IPSS-R | 40 | 748 | .14 | 83 | .43 |
| Very low | 7 (17.5) | 171 (22.9) | 26 (31.3) | ||
| Low | 23 (57.5) | 274 (36.6) | 46 (55.4) | ||
| Intermediate | 5 (12.5) | 174 (23.3) | 7 (8.4) | ||
| High | 5 (12.5) | 88 (11.8) | 4 (4.8) | ||
| Very high | 0 (0.0) | 41 (5.5) | 0 (0.0) | ||
| Deaths | 18 (45.0) | 461 (56.2) | — | 56 (67.5) | — |
| Leukemic transformation | 6 (15.0) | 159 (19.4) | — | 2 (2.4) | — |
All data are no. (%) unless otherwise specified. Bold indicates statistically significant P values (P < .05) provided only if data are available for all 3 cohorts.
AMC, absolute monocyte count; ANC, absolute neutrophil count; CPSS-Mol, Clinical/Molecular CMML-Specific Prognostic Scoring System; dCMML, dysplastic CMML; FAB, French-American-British; GFM, Groupe Francophone des Myelodyplasies; IMC, immature myeloid cell; IPSS-R, Revised International Prognostic Scoring System; NA, not available; pCMML, proliferative CMML.
Sideroblasts were evaluable in 17 SF3B1 mutant CMML patients and 482 SF3B1 wildtype CMML patients, of whom, 15 and 68 had RS, respectively.
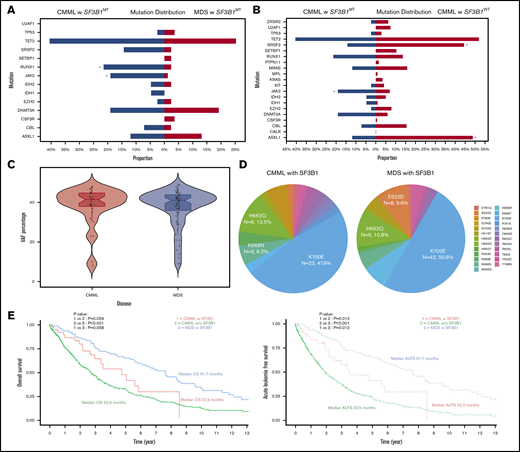
Phenotypic correlates, molecular features, and survival outcomes of SF3B1MTCMML, SF3B1WTCMML, and SF3B1MTMDS-RS. (A-B) Mutational distribution of myeloid-relevant mutations in SF3B1MT CMML and SF3B1WT CMML (A) and SF3B1MT CMML and SF3B1MT MDS-RS (B). Asterisks denote statistically significant differences between the 2 groups. (C) Median VAF burdens of SF3B1 mutations in SF3B1MT CMML and SF3B1MT MDS-RS. (D) Amino acid changes in SF3B1 secondary to SF3B1 mutations in CMML and MDS-RS. (E) Pertinent outcomes including OS and acute leukemia–free survival (ALFS) among SF3B1MT CMML, SF3B1WT CMML, and SF3B1MT MDS-RS patients.
Phenotypic correlates, molecular features, and survival outcomes of SF3B1MTCMML, SF3B1WTCMML, and SF3B1MTMDS-RS. (A-B) Mutational distribution of myeloid-relevant mutations in SF3B1MT CMML and SF3B1WT CMML (A) and SF3B1MT CMML and SF3B1MT MDS-RS (B). Asterisks denote statistically significant differences between the 2 groups. (C) Median VAF burdens of SF3B1 mutations in SF3B1MT CMML and SF3B1MT MDS-RS. (D) Amino acid changes in SF3B1 secondary to SF3B1 mutations in CMML and MDS-RS. (E) Pertinent outcomes including OS and acute leukemia–free survival (ALFS) among SF3B1MT CMML, SF3B1WT CMML, and SF3B1MT MDS-RS patients.
The median age for SF3B1MT CMML patients was 74.5 years, and 62% were males. The median SF3B1MT variant allele frequency (VAF) burden in SF3B1MT CMML was 40.5% compared with 41% for SF3B1MT MDS-RS (Figure 1C). Mutant SF3B1-associated amino acid changes included 23 (48%) K700E, 6 (12.5%) H662Q, 3 (6.2%) K666N, 2 (4%) G740E, 2 (4%) K554E, and 1 each (2%) for K669N, K741E, E622D, Y623C, Y768N, E283K, H516Y, Y623C, Y625H/L, N626S, and Y765N (3 patients had 2 SF3B1 mutations) (Figure 1D). Nine SF3B1MT CMML patients (22.5%) had >1 splicing mutation (supplemental Table 2): 5 SRSF2P95H/L, 3 SF3B1, and 1 ZRSR2. The VAFs of concurrent splicing mutations were similar (codominant) in 2 patients (SF3B1K700E 42%/SRSF2P95H 45% and SF3B1G669Q 43%/SRSF2P95L 42%). In 5 patients, the SF3B1 mutations were dominant, and the second splicing mutation represented subclones (VAFs not available in 2 patients). In 3 SF3B1MT CMML patients, no other driver mutations were identified. Common concurrent mutations included 17 (42.5%) TET2, 8 (20%) RUNX1, 7 (17.5%) DNMT3A, 7 (17.5%) JAK2V617F, and 5 (12.5%) SRSF2 (supplemental Figure 1); 10 patients (25%) had clonal cytogenetic abnormalities. U2AF1 mutations were not seen in either SF3B1MT CMML or in SF3B1MT MDS-RS patients. Seven SF3B1MT CMML patients had concurrent JAK2V617F mutations, with 4 (57%) having a proliferative CMML subtype. None of these patients had ASXL1 or oncogenic RAS pathway mutations, and the median VAF for JAK2V617F was 20% (range, 5%-52%). Within the limitations of a smaller data set, JAK2V617F and SF3B1 co-mutated CMML patients had a trend toward higher WBC and higher platelet counts without any significant differences in OS and AML-FS compared with SF3B1MT CMML patients. In SF3B1MT MDS-RS, frequencies of common hotspot amino acid changes included K700E, 50.6%; H662Q, 10.8%; E662D, 9.6%; and K666N, 4.8% (Figure 1D), with common concurrent mutations being TET2 (25%), DNMT3A (20%), and ASXL1 (13%).
At the last follow-up, among SF3B1MT CMML, SF3B1WT CMML, and SF3B1MT MDS-RS patients, 18 (45%), 461 (56%), and 56 (68%) deaths and 6 (14%), 159 (18%), and 2 (2.4%) leukemic transformations were documented, respectively. The median OS for SF3B1MT CMML patients was 57.3 months (95% confidence interval [CI], 35.8 months to not reached) compared with 32.9 months for SF3B1WT CMML patients (95% CI, 30-37.3 months; P = .059). SF3B1MT MDS-RS patients had a trend toward a better median OS (median OS, 91.7 months; 95% CI, 69.8-115.6 months; P = .058) compared with SF3B1MT CMML patients and a clear survival advantage over SF3B1WT CMML patients (P < .001; Figure 1E). The median AML-FS for SF3B1MT CMML patients was 42.3 months (95% CI, 30.5 months to not reached) compared with 23.5 months (95% CI, 20.8-26.4 months; P = .012) for SF3B1WT CMML patients Figure 1E). SF3B1MT MDS-RS patients had a better AML-FS than CMML patients in both categories (91.7 months; 95% CI, 69.8-115.6 months; P = .012 for both categories).
By using this large molecularly annotated cohort of CMML and SF3B1MT MDS-RS patients, we defined SF3B1MT CMML to be an infrequent (5%) but unique CMML category predominantly composed of dysplastic CMML subtypes, with similarities to MDS-RS in the form of median SF3B1 VAFs, frequencies of SF3B1 mutational hotspots (K700E was the most common) and IPSS-R risk stratification. As seen in MDS-RS, SF3B1 mutations were also found to occur alone in SF3B1MT CMML and seemed to be secondary to other oncogenic mutations in a minority of cases. Although there was a higher frequency of JAK2V617F and RUNX1 mutations in SF3B1MT CMML compared with SF3B1MT MDS-RS, these mutations are not enough to fully explain biological and phenotypic differences between the 2 entities. In addition, although there was a numeric trend toward a higher frequency of TET2 and SRSF2 mutations (known to skew hematopoiesis toward monocytosis) in SF3B1MT CMML, this did not reach statistical significance.
SF3B1MT CMML patients had a significant AML-FS advantage compared with their WT patient counterparts, with a trend toward a better OS. SF3B1MT MDS-RS patients had a better OS compared with SF3B1WT CMML patients and had a clear AML-FS advantage compared with both CMML subtypes. Conversely, SF3B1MT CMML demonstrated key differences from SF3B1WT CMML and from CMML in general by having a lower-than-expected frequency of ASXL1 mutations and a higher-than-expected frequency of JAK2V61F mutations and by demonstrating frequent concurrent splicing mutations. Truncating ASXL1 mutations are seen in 40% of CMML patients and in 10% to 15% of SF3B1MT MDS-RS patients, and they had a negative impact on survival.1,6,7 Only 4 (10%) of 40 SF3B1MT CMML patients in our cohort had an ASXL1 mutation, suggestive of less aggressive disease biology. The association of SF3B1MT CMML with a higher-than-expected frequency of JAK2V617F mutations remains to be elucidated but is reminiscent of MDS-RS, in which subsequent acquisition of JAK2V617F confers proliferative features resulting in MDS/MPN-RS thrombocytosis.8 Mutational co-expression of JAK2V617F and SF3B1 in CMML confers proliferative features to what is otherwise a predominantly dysplastic CMML subtype. Splicing mutations are frequent in myeloid neoplasms and, in general, are mutually exclusive secondary to their synthetic lethal interactions and convergent effects.9 We recently documented a prevalence of 0.85% for ≥2 splicing mutations in 4231 patients with myeloid neoplasms, with ∼50% being in the same cell; the distribution of double mutants deviated from the single mutants with selection against the most common alleles, SF3B1K700E and SRSF2P95H/L.10 In our study, 9 (22.5%) of 40 SF3B1MT CMML patients had concurrent splicing mutations, and 5 patients had coexisting SF3B1 and SRSF2 mutations, with 3 (75%) demonstrating involvement of the most common alleles, SF3B1K700E and SRSF2P95H/L (K700E 23%/P95H 45%, K700E 32%/P95L 16%, and K700E 48%/P95H 2.8%). This unique epistatic interaction deserves further exploration.
In summary, we define SF3B1MT CMML as a CMML subtype with predominant dysplastic features, with a low frequency of ASXL1 mutations, higher frequency of JAK2V61F mutations, concurrent splicing mutations, and a superior AML-FS. Given its infrequent occurrence, unlike in SF3B1MT MDS-RS because of the lack of a clear impact on OS, further validation is needed in a larger cohort of patients before this is recognized as an independent nosological entity.
Requests for data sharing may be submitted to the corresponding author (Mrinal M. Patnaik; e-mail: patnaik.mrinal@mayo.edu).
Acknowledgment:
The authors acknowledge the Henry Predolin Leukemia Foundation, Mayo Clinic, Rochester, MN.
Contribution: M.M.P., K.W., A.A.M., R.C., N.G., A.T., E.P., R. Komrokji, N.A., A.A.-K., and M.B. helped design the study and analyze the data; S.L., K.R., and M.H. helped with hematopathologic input and review; R. Ketterling helped with cytogenetic studies; T.L. and C.F. helped with next-generation sequencing studies and interpretation; M.B. helped with biostatistics; and all authors helped with the final draft of the manuscript.
Conflict-of-interest disclosure: M.M.P. has served on the advisory board of StemLine Pharmaceuticals. E.P. has received research funding from Kura Oncology, Incyte, and Bristol Myers Squibb and honoraria from Novartis and Taiho. The remaining authors declare no competing financial interests.
Correspondence: Mrinal M. Patnaik, Mayo Clinic, 200 First St SW, Rochester, MN 55901; e-mail: patnaik.mrinal@mayo.edu.

