

Key Points
We describe the first case of SAA progressing to CNL.
SAA-CNL and SCN-AML show mutational and transcriptional profiles that resemble.

Abstract
Acquired aplastic anemia and severe congenital neutropenia (SCN) are bone marrow (BM) failure syndromes of different origin, however, they share a common risk for secondary leukemic transformation. Here, we present a patient with severe aplastic anemia (SAA) evolving to secondary chronic neutrophilic leukemia (CNL; SAA-CNL). We show that SAA-CNL shares multiple somatic driver mutations in CSF3R, RUNX1, and EZH2/SUZ12 with cases of SCN that transformed to myelodysplastic syndrome or acute myeloid leukemia (AML). This molecular connection between SAA-CNL and SCN progressing to AML (SCN-AML) prompted us to perform a comparative transcriptome analysis on nonleukemic CD34high hematopoietic stem and progenitor cells, which showed transcriptional profiles that resemble indicative of interferon-driven proinflammatory responses. These findings provide further insights in the mechanisms underlying leukemic transformation in BM failure syndromes.
Introduction
We recently treated a patient with chronic neutrophilic leukemia (CNL) evolving from severe aplastic anemia (SAA). Both CNL and aplastic anemia (AA) are very rare hematological diseases. In western countries, the incidence of AA is 2 to 3 per 106 persons per year; however, only ∼200 CNL cases have been reported in the first 15 years after its formal recognition in 2001 as a distinct entity in the classification system of the World Health Organization (WHO).1,2 The genetic hallmarks of CNL are mutations in the colony-stimulating factor 3 (CSF3) receptor gene (CSF3R), which permit augmented and/or autonomous signaling and are detected in >80% of CNL patients.3-5 These CSF3R mutations were recently integrated in the WHO classification.5 The most commonly found CSF3R mutation in CNL is the CSF3R-T618I alteration, which provides autonomous signaling, supporting hyperproliferation of mature neutrophil progenitors.5 Severe congenital neutropenia (SCN), a bone marrow (BM) failure with a high risk of progression to myelodysplastic syndrome (MDS) and acute myeloid leukemia (AML),6,7 is another hematological entity in which CSF3R mutations are detected in 70% to 80% of patients during the course of leukemic transformation. The CSF3R mutations found in SCN are mostly truncating the cytoplasmic tail of the receptor, which is critical for receptor endocytosis and lysosomal routing.8 Interestingly, an autoactivating CSF3R mutation identical to those found in CNL patients was present in a case of SCN that progressed to AML (SCN-AML).9 Moreover, combinations of truncating and autoactivating CSF3R mutations have also been reported in cases of CNL,5 fueling the concept that CNL might be preceded by a premalignant state characterized by CSF3 hyporesponsiveness, which in analogy to SCN can be overcome by the acquisition of CSF3R mutations.10 Given the molecular link between SCN-AML and CNL, we conducted a comparative analysis of the present patient with SAA evolving to secondary CNL (SAA-CNL) and the previously described SCN-AML patient,9 aiming to interrogate clonal evolution and uncover possible common disease mechanisms underlying the malignant transformation of these cases.
Methods
Patient samples
Ficoll density gradient separated BM and peripheral blood (PB) cells were obtained from healthy donors, the SCN-AML patient (SCN phase), and the SAA-CNL patient (CNL phase) and frozen according to established procedures for viable cell cryopreservation. BM aspirate smear samples served as the DNA source of the SAA phase in the SAA-CNL patient. The study was performed under the permission of the institutional review boards of the University Hospital Basel (Basel, Switzerland; registration number Req-2019-00126) and the Erasmus MC (Rotterdam, The Netherlands; registration number MEC-2008-387 for biobanking and MEC-2012-030 for the genetic analysis of leukemic progression in SCN patients).
Microscopy
BM aspirate and PB smears were fixed in formalin solution containing 4% paraformaldehyde followed by a subsequent May-Grünwald-Giemsa staining. Images were captured by a Leica DM4B widefield microscope (Leica Microsystems GmbH, Wetzlar, Germany) equipped with an Olympus UC90 camera (Shinjuku, Tokyo, Japan). For acquisition, Olympus Cell sense Entry software was used and images were annotated using ImageJ (ImageJ2; Fiji).11
Flow cytometry and cell sorting
Hematopoietic stem and progenitor cells (HSPCs) were stained using CD34-phycoerythrin (clone 8G12; BD Biosciences) and neutrophils were stained using CD11b-BV510 (clone ICRF44; BioLegend); dead cells were excluded by using 4′,6-diamidino-2-phenylindole (Fisher Scientific). The cells were sorted with a FACSAria cell sorter (BD Biosciences).
DNA isolation and DNA sequencing
DNA was extracted from BM samples using a QiaSymphony (Qiagen). Next-generation sequencing (NGS) libraries were prepared with the IonTorrent Library Kit using the Oncomine myeloid research gene panel (supplemental Table 3) and sequenced with an IonGeneStudio S5 instrument (Thermo Fisher Scientific). The coverage of the samples was >3000-fold with all exons being covered. The sequencing data were analyzed using the Oncomine workflow on an IonReporter server with a variant detection limit set to 5%. The Illumina TruSight Myeloid panel (Illumina; supplemental Table 4) was used to detect mutations in the sorted populations, whereas BM failure–associated genes were analyzed by a custom-designed Illumina panel focusing on genes indicating a predisposition for progression to leukemia when mutated (supplemental Table 2). The Illumina NGS libraries (San Diego, CA) were paired-end sequenced (2 × 221 bp) on an Illumina HiSeq 2500 system in rapid run mode and variant calling was performed as described previously.12 Variants with a minor allele frequency of <0.1% were automatically selected, and variants causing an amino acid change or splice site base change were reported.
RNA isolation and RNA sequencing
RNA was isolated from sorted human CD34high cells from the BM (SCN phase, 1992 and 3 healthy controls) or PB (SAA-CNL patient pretransplant). Complementary DNA was generated using the SMARTer Ultra Low Input RNA Kit for sequencing (version 4; Clontech) and libraries were generated using the TruSeq Nano DNA Sample Preparation Kit (Illumina), according to the low sample protocol, and run on a Novaseq 6000 instrument (Illumina). Demultiplexing was performed using the Casava software (Illumina) allowing for 1 mismatch in the bar codes. Subsequently, quality metrics were estimated for all of the resulting fastq files (FastQC, Babraham bioinformatics, and MultiQC; http://multiqc.info). Afterward, trimmed reads were aligned against the human transcriptome (Gencode v19)/Genome (hg19) using the STAR aligner.13 Abundance estimation was performed using Cufflinks (refSeq14 ) and raw counts were measured with the HTSeq-count software set in union mode.15 Next, the measured raw counts were used to create clustering and principal component plots and to perform differential expression analysis using both DESeq2 (after ASHR shrinkage) and R (https://www.r-project.org/).16 Finally, gene-set enrichment analysis (GSEA) with the hallmark pathway H (https://www.gsea-msigdb.org/gsea/msigdb/genesets.jsp?collection=H) was done using the GSEA software based on the preranked log2 fold change ASHR shrunken DESeq2 data.17-19
Results
Case history
The SAA-CNL patient was referred to the clinic at the age of 42 years for evaluation of BM transplantation. He was diagnosed with SAA at the age of 22 years, for which he was treated with intensive immunosuppressive therapy (IST; 2× antilymphocyte globulin and 1× antithymocyte globulin together with cyclosporine A [CsA]) over a period of 18 years with initial response to IST but subsequent relapse. The IST at the age of 23 years and 31 years resulted in partial remission for almost 9 years and 3 years, respectively. After the third cycle at the age of 34 years, the patient depended on a maintenance therapy with CsA (350 mg per day) for 6 years. At the age of 41 years, that is, 19 years after the initial SAA diagnosis, increasing neutrophil counts up to 39 g/L were observed in PB in the absence of infection, inflammation, or solid tumor. The patient also never received any treatment with granulocyte stimulation factor. BM examination revealed hypercellularity with excess mature neutrophils without an increase in myeloblasts (Figure 1). Discrete reactive dysplastic changes were observed, which did not classify for diagnosis of MDS. Cytogenetic analysis showed a normal karyotype (46, XY) and a normal array comparative genomic hybridization profile. Together with the findings in PB and BM, and the presence of a CSF3R-T618I mutation, the criteria of the WHO classification for the diagnosis of CNL were fulfilled (supplemental Table 1). Therapy with ruxolitinib was initiated based on previous data showing spontaneous JAK-mediated signaling in CSF3R-T618I mutants and the possible therapeutic potential of ruxolitinib in CNL.5 Upon normalization of neutrophil counts, ruxolitinib was tapered after 4 months and stopped after 5 months due to progressive thrombocytopenia (Figure 2). Because thrombocytopenia and elevated neutrophil counts persisted (Figure 2), the patient underwent allogeneic hematopoietic stem cell transplantation from a 12 of 12 HLA identical unrelated donor after myeloablative conditioning with cyclophosphamide and pharmacokinetics-guided busulfan. Graft-versus-host disease prophylaxis consisted of antithymocyte globulin, methotrexate, and CsA. To date, almost 4 years posttransplant, the patient remains in complete hematological, morphological, and molecular remission with 100% donor chimerism in BM as well as in the CD3+ and CD66+ leukocyte fraction in PB. Mild chronic graft-versus-host disease developed but immunosuppressive treatment could be stopped 1 year posttransplant.
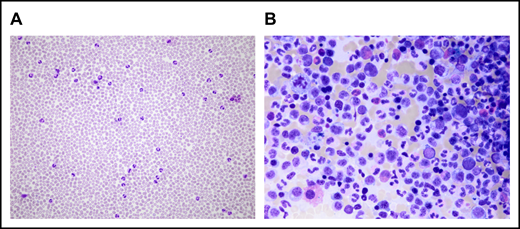
Microscopical analysis of PB and BM at CNL diagnosis. (A) Neutrophilia in PB. (B) BM examination shows hypercellularity resulting from proliferation of the myeloid lineage without an increase in myeloblasts. The pictures were acquired by a Leica DM4B widefield microscope equipped with an Olympus UC90 camera: original magnification ×20 (A) and ×50 (B), respectively; May-Grünwald-Giemsa stain. The images were taken at room temperature using immersion oil. For acquisition, Cell sense Entry software was used; the images were subsequently annotated using ImageJ.
Microscopical analysis of PB and BM at CNL diagnosis. (A) Neutrophilia in PB. (B) BM examination shows hypercellularity resulting from proliferation of the myeloid lineage without an increase in myeloblasts. The pictures were acquired by a Leica DM4B widefield microscope equipped with an Olympus UC90 camera: original magnification ×20 (A) and ×50 (B), respectively; May-Grünwald-Giemsa stain. The images were taken at room temperature using immersion oil. For acquisition, Cell sense Entry software was used; the images were subsequently annotated using ImageJ.
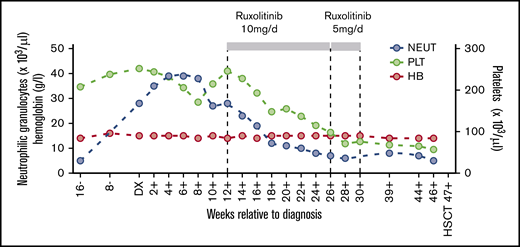
PB cell counts in relation to CNL diagnosis. Hemoglobin levels (HB) and neutrophil granulocyte (NEUT) and platelet (PLT) cell counts are depicted before, during, and after treatment with ruxolitinib at the indicated dosage. DX, diagnosis; HSCT, hematopoietic stem cell transplantation.
PB cell counts in relation to CNL diagnosis. Hemoglobin levels (HB) and neutrophil granulocyte (NEUT) and platelet (PLT) cell counts are depicted before, during, and after treatment with ruxolitinib at the indicated dosage. DX, diagnosis; HSCT, hematopoietic stem cell transplantation.
Genetic analysis
NGS of BM cells from the SAA-CNL patient with the IonTorrent Oncomine Myeloid research gene panel uncovered, in addition to the CSF3R-T618I mutation (variant allele frequency [VAF], 29%), mutations in SETBP1 (VAF, 42%), EZH2 (VAF, 40%), and RUNX1 (VAF, 5%) (supplemental Table 3; Figure 3). The patient did not carry mutations in genes associated with BM failure syndromes, for example, ELANE, HAX1, SBDS, SRP54, and GATA2 (supplemental Table 2). Retrospective analysis of a BM sample taken 7 years before CNL diagnosis revealed no specific mutation, implying the acquisition of these mutations particularly during the last years of the disease course.
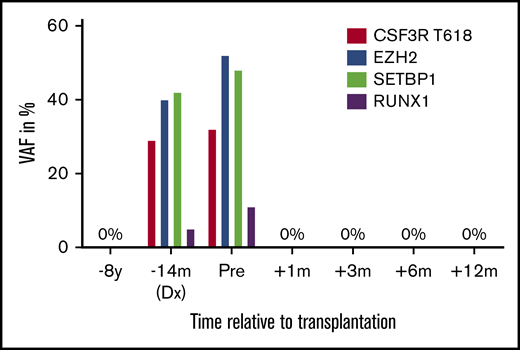
VAFs of mutations during evolution from SAA to CNL. VAF 8 years before transplantation, at diagnosis of CNL, pretransplant, and 1, 3, 6, and 12 months after allogeneic hematopoietic stem cell transplantation.
VAFs of mutations during evolution from SAA to CNL. VAF 8 years before transplantation, at diagnosis of CNL, pretransplant, and 1, 3, 6, and 12 months after allogeneic hematopoietic stem cell transplantation.
Flow cytometric analysis of a PB sample taken from the SAA-CNL patient just before transplantation showed the presence of CD34high cells, raising the possibility that a further evolution step toward a more blast-like phenotype might have been in progress. To further investigate the clonal cellular hierarchy at this stage, we performed Illumina TruSight myeloid panel sequencing (supplemental Table 4) on fluorescence-activated cell sorter–purified CD34highCD11b− hematopoietic stem and progenitor cells (HSPCs), CD34dimCD11b+ myeloid precursor cells, and CD34−CD11b− cells from cryopreserved PB. This analysis revealed that the SETBP1, EZH2, CSF3R, and RUNX1 mutations were only present in the CD34dimCD11b+ myeloid progenitors cells with VAFs that were grossly similar to the noncryopreserved unsorted CNL sample (Table 1). On the other hand, none of these mutations were detected in the CD34highCD11b− HSPC fraction, indicating that these phenotypically immature cells were not derived from a SETBP1/EZH2/CSF3R/RUNX1 mutant ancestor, but represent SAA-derived nonleukemic progenitors.
CSF3R, EZH2, SETBP1, and RUNX1 mutation status per sorted population
| Gene | Mutation | VAF, % | ||
|---|---|---|---|---|
| CD34dimCD11b+ | CD34highCD11b− | CD34−CD11b− | ||
| CSF3R | T618I | 6.8 | — | — |
| EZH2 | Y663C | 38.8 | — | — |
| SETBP1 | G870S | 28.8 | — | — |
| RUNX1 | V164fs | 7.3 | — | — |
| Gene | Mutation | VAF, % | ||
|---|---|---|---|---|
| CD34dimCD11b+ | CD34highCD11b− | CD34−CD11b− | ||
| CSF3R | T618I | 6.8 | — | — |
| EZH2 | Y663C | 38.8 | — | — |
| SETBP1 | G870S | 28.8 | — | — |
| RUNX1 | V164fs | 7.3 | — | — |
—, 0%; VAF, variant allele frequency.
Comparative transcriptome analysis of SCN and SAA HSPCs
Based on the clonal evolution patterns that SCN-AML and SAA-CNL have in common, we asked if, and to what extent, comparable regulatory pathways might be affected in the nonleukemic CD34high HSPCs in this SAA-CNL patient compared with SCN. To investigate this, we made use of material from a previously described ELANE-mutant SCN patient who later on progressed to AML.9 As shown in Figure 4A, besides the CSF3R-T618I mutation, both patients show mutations in RUNX1 and in SUZ12 or EZH2, encoding proteins of the polycomb-repressive complex (PRC2), upon leukemic progression. We performed whole-transcriptome analysis on the CD34high HSPCs from the pretransplant sample of the SAA-CNL patient that lacked SETBP1/EZH2/CSF3R/RUNX1 mutations and compared these with CD34high cells from healthy donors (n = 3). The same analysis was done on CD34high cells from the ELANE-mutant SCN patient, which at the time of analysis during the neutropenic phase had a minor (<10%) clone with a CSF3R-truncating mutation.9 GSEA indicated upregulation of several overlapping pathways in both the SAA-CNL and the SCN patient compared with healthy controls, among which were induction of apoptosis, activation of the p53 pathway, mTORC1 signaling, and responses to reactive oxygen species (supplemental Figure 1). Most strikingly, the CD34high HSPCs from the SAA-CNL and the SCN patient displayed transcriptional profiles characterized by upregulation of inflammatory-related signatures, in particular type I (interferon α [IFN-α]) and type II (IFN-γ) IFN responses (Figure 4B-C). A selection of IFN-response genes that were most strongly upregulated in both the SAA-CNL and SCN HSPCs is shown in Figure 4D and includes PML and PARP9, genes involved in oxidative stress and DNA-damage responses, respectively, possibly linking the induction of apoptosis– and reactive oxygen species–induced signatures to increased interferon signaling.20,21 Taken together, these results suggest that IFN-driven proinflammatory responses represent a feature of SAA and SCN CD34high HSPCs that may contribute to the preleukemic state of these cells.
![Comparative analysis between the SAA-CNL and SCN-AML patients regarding mutations and transcriptional profile. (A) Mutational spectrum observed in the SCN-AML patient and the SAA-CNL patient. The bold genes are overlapping (SUZ12 and EZH2 together form the polycomb-repressive complex 2). (B-C) GSEA comparing nonleukemic CD34high cells from 3 healthy controls with CD34high cells obtained from the SAA-CNL patient (B), CD34high cells from 3 healthy controls with CD34high cells obtained from the SCN patient (SCN phase before AML became clinically overt) (C), both showing increased IFN-related signaling. (D) Expression levels (in transcript per million [TPM]) of various IFN-inducible genes, which are significantly increased in both the SAA-CNL and the SCN stage. *P < .05. ES, enrichment score; FDR, false discovery rate; NES, normalized enrichment score.](https://ash.silverchair-cdn.com/ash/content_public/journal/bloodadvances/4/21/10.1182_bloodadvances.2020001541/2/m_advancesadv2020001541f4.png?Expires=1769198712&Signature=2QrmAPDrGqKckjZWZHq6-AyX9MgTHcPu8P6SW1ekIEk-AvQdAlrr1VmiZAHwiCWy82yGxrRHR~CbJkBm1BRb6qIGlotQLLon7Su5U9lZCq3NIMJt5SRTiFNVJMj0TkAAE1lsvK-qUuHl5LaqlhhrYanvk4nwABW~iwZ7zyngS-a7Dg2z3A0MaiDRFeuG7wF~FKSjaQxk90AhYDKMAmjgj7gClSqTe2HTI9yKwMpKXajDUx~M0GUtCU8C2XhItIzYWfIcRVPVAxRiKgFrLAj5AZJJfeI3H3-vXjbOD7rwRQ~i6SZZaRwir7qEJLnifTn4oZOeTLh-l1BcQ77prZ6lDA__&Key-Pair-Id=APKAIE5G5CRDK6RD3PGA)
Comparative analysis between the SAA-CNL and SCN-AML patients regarding mutations and transcriptional profile. (A) Mutational spectrum observed in the SCN-AML patient and the SAA-CNL patient. The bold genes are overlapping (SUZ12 and EZH2 together form the polycomb-repressive complex 2). (B-C) GSEA comparing nonleukemic CD34high cells from 3 healthy controls with CD34high cells obtained from the SAA-CNL patient (B), CD34high cells from 3 healthy controls with CD34high cells obtained from the SCN patient (SCN phase before AML became clinically overt) (C), both showing increased IFN-related signaling. (D) Expression levels (in transcript per million [TPM]) of various IFN-inducible genes, which are significantly increased in both the SAA-CNL and the SCN stage. *P < .05. ES, enrichment score; FDR, false discovery rate; NES, normalized enrichment score.
Comparative analysis between the SAA-CNL and SCN-AML patients regarding mutations and transcriptional profile. (A) Mutational spectrum observed in the SCN-AML patient and the SAA-CNL patient. The bold genes are overlapping (SUZ12 and EZH2 together form the polycomb-repressive complex 2). (B-C) GSEA comparing nonleukemic CD34high cells from 3 healthy controls with CD34high cells obtained from the SAA-CNL patient (B), CD34high cells from 3 healthy controls with CD34high cells obtained from the SCN patient (SCN phase before AML became clinically overt) (C), both showing increased IFN-related signaling. (D) Expression levels (in transcript per million [TPM]) of various IFN-inducible genes, which are significantly increased in both the SAA-CNL and the SCN stage. *P < .05. ES, enrichment score; FDR, false discovery rate; NES, normalized enrichment score.
Discussion
The low probability of an unrelated, sequential occurrence of CNL after SAA in the same patient prompted the question of a causal link and possible mechanisms underlying the leukemic transformation to CNL. Per se, the course of AA can be complicated by the development of clonal disorders such as MDS and AML, in particular after IST as it was repeatedly given to our reported SAA-CNL patient.22-25 Recent analyses of myeloid precursor cells of AA patients demonstrated recurrent somatic mutations in a defined spectrum of genes with a low VAF and certain founder mutations with the potential to initiate the progression to MDS.26,27
In comparison with genetic alterations found in MDS or age-related clonal hematopoiesis, certain sets of mutations are overrepresented (BCOR, BCORL1, PIGA) in AA, whereas other mutations (TET2, JAK2) occur less frequently, suggesting distinct clonal selection mechanisms in the aplastic BM environment. Interestingly, CSF3R mutations have not been reported in AA so far, but are linked to leukemic transformation in SCN. Sequential myeloid colony assays during the development from SCN to secondary AML revealed that CSF3R-truncating mutations occur early and are disease driving9 whereas RUNX1 and CSF3R-T618I mutations appear shortly before MDS/AML becomes clinically overt.28 The specific CSF3R mutation (T618I) in the present case was previously shown to enable myeloid colony formation in the absence of CSF3, thereby suggesting a constitutive ligand-independent activation of the receptor.5
A molecular connection between the pathogenesis of SCN-AML and CNL has been suggested before because HSPCs in these malignancies acquire truncating and/or autoactivating mutations in CSF3R at an increased frequency.5,29 Although the exact time point at which CSF3R mutations are acquired during CNL development remains unknown, a possible explanation is that CNL is preceded by a CSF3-hyporesponsive preleukemic state, from which HSPC clones escape through the acquisition of CSF3R mutations.29 The SAA-CNL patient reported here could serve as a unique clinical case to support this hypothesis. Comparative gene-expression analysis of the nonleukemic CD34high HSPCs in the SCN and the SAA-CNL patient revealed strikingly similar transcriptional profiles, characterized by upregulation of type I (IFN-α) and type II (IFN-γ) IFN responses (Figure 4). These results corroborate the important role of inflammatory signaling pathways in preleukemic stem cells, particularly in the context of secondary leukemia,30,31 and may suggest that an inflammatory BM environment in which the SAA- and SCN-mutant CD34high HSPCs reside contribute to a permissive condition for the development of leukemic cells.32,33
In summary, this patient with CNL evolving from SAA provides unique insights into potentially important mechanisms of leukemic transformation of BM failure syndromes. The molecular similarities with SCN and the resembling transcriptional profiles corroborate the role of inflammatory signaling pathways in preleukemic and leukemic stem cells, particularly in the context of secondary leukemia.
Data-sharing requests may be e-mailed to corresponding author, Beatrice Drexler, at beatrice.drexler@usb.ch.
Acknowledgments
The authors thank Paulina M. H. van Strien and Remco M. Hoogenboezem for technical assistance, as well the Swiss Transplant Cohort Study for providing a pretransplant sample of the SAA-CNL patient.
This work was supported by a grant from KWF Kankerbestrijding (EMCR 2013-5755).
Authorship
Contribution: L.S., P.A.O., P.L., I.P.T., and B.D. designed and performed the research, analyzed the data, and wrote the manuscript; and A.T., M.K., J.H., M.U., P.J.M.V., and J.P. analyzed the data and wrote the manuscript.
Conflict-of-interest disclosure: The authors declare no competing financial interests.
Correspondence: Beatrice Drexler, Division of Hematology, University Hospital Basel, Petersgraben 4, CH-4031 Basel, Switzerland; e-mail: beatrice.drexler@usb.ch; and Laurent Schmied, Division of Hematology, University Hospital Basel, Petersgraben 4, CH-4031 Basel, Switzerland; e-mail: laurent.schmied@usb.ch.

