

Key Points
The CD34+ compartment of human cord blood contains a range of HSPC immunophenotypes, among which the Lin−CD34+CD38+CD127+ CLP is rare.
There is no correlation between the frequencies of CD34+ cells and immunophenotypic HSC in umbilical cord blood products.

Introduction
Since the seminal studies by Till and McCulloch that first characterized the self-renewing, multipotent hematopoietic stem cell (HSC) in a murine model,1-5 the understanding of human hematopoiesis has accelerated through the delineation of human HSC and progenitor subsets by the expression of cell surface antigens.6,7 Although the differentiation capacities of hematopoietic stem and progenitor cells (HSPCs) and their corresponding immunophenotypes have been extensively studied, little is known about the relative distribution of HSPC subsets between individuals. Here, we characterize the heterogeneity of the CD34+ compartment within human umbilical cord blood (UCB) and note a lack of correlation between the frequencies of CD34+ cells and progenitor subtypes. Additionally, we identified common lymphoid progenitors (CLPs) as a particularly rare population.
Methods
Study design
Immunophenotyping of CD34-enriched cord blood products was performed on 50 samples. As this is a pilot study, the lack of comparable analyses in the existing literature precludes calculation of ideal sample size and predicted power a priori. Resource availability (antibodies, time, and laboratory space) was the primary determinant of sample size.
Isolation of CD34+ HSPCs
HSPCs were isolated from the UCB of term deliveries (≥34 weeks of gestation) at Lucile Packard Children’s Hospital-Stanford. UCB collections were performed through the Binns Program for Cord Blood Research with donor consent and institutional review board approval. Within 24 to 48 hours of collection, mononuclear cells obtained by density gradient separation of whole blood (Ficoll Paque Plus, GE Healthcare; 400g, room temperature, 30 minutes, deceleration off) were labeled with the human CD34 Microbead Kit Ultrapure for positive selection of CD34+ HSPCs according to the manufacturer’s protocol (Miltenyi Biotec, San Diego, CA).
Immunophenotyping of CD34+ HSPCs
Following positive selection, 100 000 CD34+ cells per sample were stained with antibodies against markers of HSPC differentiation at optimal concentrations (supplemental Table 1). At least 30 000 live events (propidium iodide negative) were acquired on a BD FACS Aria II flow cytometer and analyzed using FlowJo software (version 9).
Statistics
Data are reported in the text as median (interquartile range [IQR]). The relationship between CD34+ expression and progenitor subtypes was assessed using nonparametric Spearman correlation and simple linear regression (supplemental Table 2).
Results and discussion
We analyzed the distribution of immunophenotypes within UCB-derived CD34+ HSPCs harvested 24 to 48 hours after delivery (n = 50). All populations were identified as previously described (supplemental Figures 1 and 2).8-13
Multipotent cell types: HSCs and MPPs
Lin− CD34+ CD38- CD45RA- CD90+ HSCs comprised 6.7% (median, IQR 3.4%) of all CD34+ cells (Table 1). However, their frequency was highly variable between donors, spanning a range of 0.1% to 17.3% of CD34+ cells (a >2-log variability) (Figure 1B and Table 1). We also observed high interdonor variability in phenotypic MPPs (>1-log variability), which accounted for 10.6% (IQR 3.9%) of CD34+ cells. We quantified the relationship between the frequencies of CD34+ cells and both multipotent lineages and found no evidence of predictability between CD34+ cells and either HSCs or MPPs by immunophenotype (Spearman r −0.009 and 0.069, respectively) (Figure 1A,B,F; supplemental Table 2). Total number of CD34+ cells and both multipotent subpopulations exhibited a >1-log variability (Figure 1E; supplemental Figure 4). The Spearman coefficients correlating CD34+ cell number with number of HSCs and MPPs are high (0.94 and 0.943, respectively), suggesting a strong predictability between these populations on first glance (Figure 1F; supplemental Figure 4; supplemental Table 2). However, interpretation of correlative analysis using absolute cell counts is prone to error and bias for the following reasons: (1) the manipulation of CD34-enriched samples prior to analysis by flow cytometry, including sample dilution, centrifugation, and overall handling, results in cell loss and changes in volume that affect the calculation of cell number; (2) correlation and linear regression are not suitable methods of analysis in circumstances when one variable is used to define the other (here, the number of CD34+ cells is required to calculate the number of progenitor cells); and most importantly, (3) unlike HSPC subpopulation frequency, subpopulation cell counts are directly affected by the total number of cells in a given sample (ie, a sample with a low frequency of HSCs may contain a greater number of HSCs than a sample with a high frequency of HSCs by virtue of a greater number of cells overall). Consequently, the interpretation of any correlation between absolute number of cells in the context of this study is inconclusive.
Distribution of HSPC subpopulations by immunophenotype, percentage, and absolute cell count
| Cell type | Immunophenotype | Percentage | Absolute no. |
|---|---|---|---|
| HSC | Lin−34+38−45RA−90+ | 6.7 (0.1-17.3) | 5.8 × 10⁴ (3.9 × 10²-9.4 × 10⁵) |
| MPP | Lin−34+38−45RA−90− | 10.6 (1.1-37.5) | 7.9 × 10⁴ (1.4 × 10³-2.5 × 10⁶) |
| CMP | Lin−34+38+45RA−123+ | 33.6 (3.2-45.8) | 3 × 10⁵ (4.1 × 10³-1.9 × 10⁶) |
| GMP | Lin−34+38+45RA+123+ | 20.8 (7.1-51.9) | 1.9 × 10⁵ (1.8 × 10³-2 × 10⁶) |
| MEP | Lin−34+38+45RA−123− | 11.4 (3.8-22.9) | 8.9 × 10⁴ (1.4 × 10³-6.8 × 10⁵) |
| CLP | Lin−34+38+127+ | 0.0071 (0-0.064) | 5.6 × 101 (0-7.8 × 10²) |
| Pro-B/NK | Lin−34+38+45RA+10+ | 1.2 (0.2-4.4) | 1.1 × 10⁴ (1.5 × 10²-2 × 10⁵) |
| MLP | Lin−34+38−45RA+10+ | 1.1 (0.3-4.6) | 9 × 10³ (4.4 × 10²-1.1 × 10⁵) |
| LMPP | Lin−34+38−45RA+90v | 3.3 (0.9-16.5) | 3.1 × 10⁴ (3.9 × 10²-1.1 × 10⁶) |
Data are shown as median (range). Percentages are among live CD34+ cells.
CMP, common myeloid progenitor; GMP, granulocyte/monocyte progenitor; LMPP, lymphoid-primed multipotent progenitor; MEP, megakaryocyte/erythrocyte progenitor; MLP, multipotent lymphoid progenitor; MPP, multipotent progenitor; pro-B/NK, B/natural killer cell progenitor.
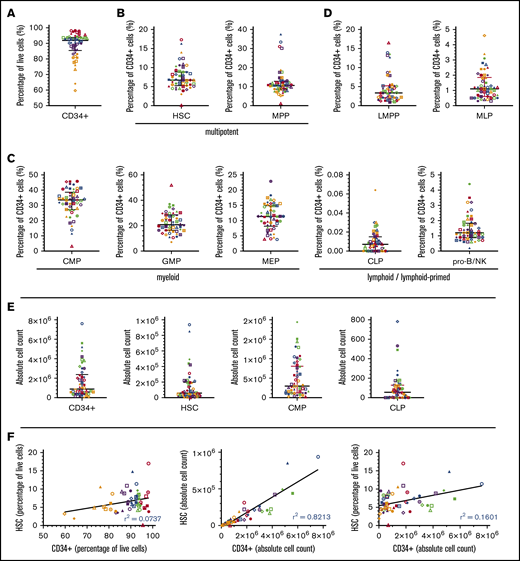
Heterogeneity of HSPC populations in CD34-selected cord blood products by percentage and absolute number. Distribution of multipotent, myeloid-, and lymphoid-primed cell types as a percentage of CD34+ HSPCs (n = 50). (A) CD34+ cells. (B) HSCs and MPPs. (C) CMPs, GMPs, and MEPs. (D) LMPPs, MLPs, CLPs, and pro-B/NKs. (E) Distribution of total CD34+ cells, HSCs, CMPs, and CLPs by absolute number. (F) Linear regression plots to assess the putative relationship between total CD34+ cells and HSCs by percentage and absolute number (further addressed in the discussion). Immunophenotypes used to identify HSPC subtypes are defined in Table 1 and supplemental Figures 1 and 2. Each scatterplot contains 50 data points corresponding to 50 individual samples. Each data point is further indicated by a unique color and shape that remains consistent across all plots for sample tracing, with red points corresponding to 10 samples with the highest percentage of a given cell type (first quintile) and orange points corresponding to 10 samples with the lowest percentage of a given cell type (fifth quintile). Bars depict median and IQR.
Heterogeneity of HSPC populations in CD34-selected cord blood products by percentage and absolute number. Distribution of multipotent, myeloid-, and lymphoid-primed cell types as a percentage of CD34+ HSPCs (n = 50). (A) CD34+ cells. (B) HSCs and MPPs. (C) CMPs, GMPs, and MEPs. (D) LMPPs, MLPs, CLPs, and pro-B/NKs. (E) Distribution of total CD34+ cells, HSCs, CMPs, and CLPs by absolute number. (F) Linear regression plots to assess the putative relationship between total CD34+ cells and HSCs by percentage and absolute number (further addressed in the discussion). Immunophenotypes used to identify HSPC subtypes are defined in Table 1 and supplemental Figures 1 and 2. Each scatterplot contains 50 data points corresponding to 50 individual samples. Each data point is further indicated by a unique color and shape that remains consistent across all plots for sample tracing, with red points corresponding to 10 samples with the highest percentage of a given cell type (first quintile) and orange points corresponding to 10 samples with the lowest percentage of a given cell type (fifth quintile). Bars depict median and IQR.
Myeloid progenitors: CMPs, GMPs, and MEPs
Myeloid precursors within the Lin−CD34+CD38+ compartment comprised the overwhelming majority of HSPCs (supplemental Figure 3). We observed that 33.6% (IQR 10.8%) of the CD34+ cells isolated from cord blood express the CMP immunophenotype (Figure 1C, Table 1), suggesting a bias toward the myeloid lineage. Although the heterogeneity and differentiation capacity of HSCs are well studied,14-16 the challenge of classifying populations within a fluid hematopoietic model solely by immunophenotype and the resulting paucity of comparable data makes it difficult to compare our data with existing literature. The Spearman correlation between the frequencies of total CD34+ cells and phenotypic myeloid cells is weak, ranging from −0.196 to 0.331, indicating low predictability between these populations (supplemental Table 2).
Lymphoid and lymphoid-primed progenitors: LMPPs, MLPs, CLPs, and pro-B/NKs
Phenotypic lymphoid cells in these UCB samples were notably less prevalent than their myeloid counterparts (Figure 1D; supplemental Figure 3). MLPs accounted for only 1.1% (IQR 1.2%) of CD34+ cells. Similarly, B/natural killer (NK)-cell progenitors comprised 1.2% (IQR 1%) of CD34+ cells. Our analysis revealed no relationship between the frequencies of CD34+ cells and lymphoid progenitors, only a weakly negative correlation (supplemental Table 2).
While a consensus on the immunophenotypic definition of the CLP is yet to be reached,17-21 this population was recently identified within the Lin−CD34+CD38+ compartment of bone marrow with acquired expression of CD127.12 By this definition, CLPs consistently formed less than 0.1% of CD34+ cells (range, 0% to 0.06%) in all 50 UCB samples. A previous study by Hao et al demonstrated CD7+ and CD10+ progenitors with B-cell and NK-cell developmental potential in UCB, but not CD127+ lymphoid progenitors.11 This finding, consistent with our own observation of rare CD127+ phenotypic CLPs, is paradoxical considering the known lymphoid potential of young HSCs. The low frequency of CLPs in the bulk UCB CD34+ population may (1) suggest that lymphoid progenitors do not traffic in the fetal environment as HSCs and myeloid progenitors and (2) provide an additional mechanism for the delayed immune reconstitution seen following UCB transplants beyond the known naive phenotype of the T-cell compartment.22 Based on the unexpected high variability in UCB, a comparable analysis of the CD34+ compartment of marrow products is indicated.
The interdonor variability of UCB HSPCs is demonstrated by 5 samples, selected to represent a broad range of HSCs (supplemental Figure 3). While the overall proportion of myeloid cells consistently exceeded that of lymphoid lineages, there was a high degree of variation between the relative proportions of individual subpopulations. Interestingly, in 1 sample, HSCs accounted for only 0.1% of CD34+ cells. These results support the conclusion that the CD34+ compartment of human UCB, though often regarded as a single population for research and clinical applications, is a heterogeneous pool of stem and progenitor cells of varying immunophenotypic prevalence. In conjunction with the high variability of phenotypic HSCs, these data may have important implications in experimental and clinical contexts that rely on the functional properties of self-renewal and long-term engraftment.
In the clinical context, this study addresses the assumption that CD34+ cell composition is an accurate and adequate measure of stem cell and progenitor content. Currently accepted metrics of UCB graft potency include total nucleated cell count, CD34+ cell count, and colony-forming unit assays.23,24 However, most graft composition data are obtained after cryopreservation or after transplantation, which may have direct implications in measurable clinical outcomes such as immune reconstitution and engraftment of stem cells, neutrophils, and platelets. To this end, we propose that grafts be subjected to quantification of progenitors in addition to total CD34+ cells. Our antibody panel and staining protocol would address the need for real-time potency quantification at the time of transplant in 2 important ways. First, with a short time for execution, it would provide rapid turnaround. Secondly, the results would provide a baseline for assessing the aforementioned cell-dependent clinical outcomes. It may be that the time to neutrophil engraftment or immune reconstitution is explained by the frequency of committed progenitors (eg, CMPs and CLPs), which have no phenotypic correlation with the total CD34+ cell content. Such immunophenotyping data would not supplant the utility of existing measures such as the functional colony-forming unit assay but would serve as a complement to better understand UCB biology and transplantation.
In conclusion, our data provide a thorough map of the immunophenotypic heterogeneity of human cord blood and lay the foundation for clinical analyses of the cellular composition therein. We hope these results support future research endeavors and advance efforts to further optimize graft selection and prediction of hematologic recovery in HSC transplantation.
The authors agree to make renewable materials, data sets, and protocols available to other investigators without unreasonable restrictions. Requests can be directed to the corresponding author by e-mail at sruthim@stanford.edu.
Acknowledgments
The authors are grateful to the Binns Program for Cord Blood Research for the provision of cord blood CD34+ HSPCs. S.M. gratefully acknowledges Johan Jeong, former Basic Life Research Scientist in the laboratory of Michael Cleary (Stanford University School of Medicine), for advising on content, as well as the laboratory of Matthew Porteus (Stanford University School of Medicine) for providing instrumental feedback during manuscript preparation.
Authorship
Contribution: R.M. and A.R. provided the antibody panel and staining protocol; B.T.D. and K.I.W. provided instrumental guidance on immunophenotypic classification, especially of CLPs; B.T.D., R.A.-H., M.H.P., and K.I.W. contributed to data analysis; and all authors contributed to manuscript drafting and revision.
Conflict-of-interest disclosure: The authors declare no competing financial interests.
Correspondence: Sruthi Mantri, Stanford University School of Medicine, 1000 Welch Rd, Suite 301, Palo Alto, CA 94304; e-mail: sruthim@stanford.edu.

