

Key Points
Residual disease status by ΔN after first induction is the best predictor of OS in childhood AML.
Lack of morphologic remission is a “false-positive” one-third of the time compared to ΔN residual disease status.

Abstract
Risk stratification for acute myeloid leukemia (AML) uses molecular and cytogenetic abnormalities identified at diagnosis. Response to therapy informs risk, and morphology continues to be used more frequently than flow cytometry. Herein, the largest cohort of pediatric patients prospectively assessed for measurable residual disease (MRD) by flow cytometry (N = 784) is reported. The “difference from normal” (ΔN) technique was applied: 31% of all patients tested positive (AML range, 0.02% to 91%) after the first course of treatment on Children’s Oncology Group study AAML0531. Detection of MRD following initial chemotherapy proved the strongest predicator of overall survival (OS) in univariable and multivariable analyses, and was predictive of relapse risk, disease-free survival, and treatment-related mortality. Clearance of MRD after a second round of chemotherapy did not improve survival. The morphologic definition of persistent disease (>15% AML) failed 27% of the time; those identified as MRD− had superior outcomes. Similarly, for patients not achieving morphologic remission (>5% blasts), 36% of patients were MRD− and had favorable outcomes compared with those who were MRD+ (P < .001); hence an increase in myeloid progenitor cells can be favorable when ΔN classifies them as phenotypically normal. Furthermore, ΔN reclassified 20% of patients in morphologic remission as having detectable MRD with comparable poor outcomes. Retrospective analysis using the relapse phenotype as a template demonstrated that 96% of MRD− patients had <0.02% of the relapse immunophenotype in their end of induction 1 marrow. Thus, the detection of abnormal myeloid progenitor cells by ΔN is both specific and sensitive, with a high predictive signal identifiable early in treatment. This trial was registered at www.clinicaltrials.gov as #NCT00372593.
Introduction
Treatment strategies in acute myeloid leukemia (AML) depend upon identification of relative risk for specific therapies. Cytogenetic and molecular assays determine risk at diagnosis.1-4 Although assessment of response to therapy using morphology is standard of practice, only high levels of blasts, persistent disease (PD), are used in risk stratification,5,6 and although molecular and cytogenetic analyses are also monitoring tools, these approaches are limited to specific genetic abnormalities not universally detected in AML. Although flow cytometry has been used to detect measurable residual disease (MRD) based on the detection of phenotypically aberrant cells,6-11 this technique lacks sufficient consistency in application to compare results obtained between laboratories.12-14
Herein, “difference from normal” (ΔN) flow cytometry is used to determine MRD in a large phase 3 childhood AML clinical trial. ΔN utilizes a standardized panel of monoclonal antibodies, quantitative immunofluorescence, and multidimensional data analysis to define the composition of bone marrow specimens.6,7,15-17 This approach can identify all lineages and maturational stages of normal cells resident in a stressed bone marrow. The relationships and absolute amounts of each gene product identified by a select panel of monoclonal antibodies are invariant from individual to individual with assay stability demonstrated across thousands of samples over 15 years.16,17 With the understanding that the amounts and timing of expression of gene products during hematopoiesis are biologic constants, all of the normal cellular components within a specimen can be recognized and quantified, permitting this approach for all patients,6,7,16,17 and can be used to monitor AML treatment as well as to predict risk in myelodysplastic syndromes.17-19 Unlike the leukemia-associated immunophenotype technique,20-23 ΔN does not require access to the diagnostic specimen and is not impacted by changes in phenotype that can occur following therapy.24-26
The current study examines the utility of measuring response to therapy by ΔN with a comparison with risk stratification by other techniques. The detection of residual AML down to levels of 0.02% at the end of the first course of chemotherapy (end of induction 1 [EOI1]) identifies those with poor clinical outcomes, despite subsequent use of aggressive chemotherapy, and frequently, hematopoietic stem cell transplant (HSCT).
Methods
Patient eligibility and study protocol
Between August 2006 and June 2010, 1022 newly diagnosed pediatric patients with de novo AML enrolled in the phase 3 AAML0531, which studied, using a randomized approach, the value of adding gemtuzumab ozogamicin to a conventional chemotherapy backbone. Full details of the AAML0531 protocol have been published.5 To qualify for this correlative study, 784 patients satisfied 2 criteria: (1) submitting a bone marrow aspirate for multidimensional flow cytometry after initial induction chemotherapy and (2) providing consent for correlative biology studies. Patients with acute promyelocytic leukemia were not enrolled in AAML0531 and those with Down syndrome were excluded from this analysis. When available, specimens submitted at EOI2 (N = 665) were analyzed. The study was approved by the institutional review board (IRB) at the National Cancer Institute and IRBs at each 184 enrolling centers. Patients and their families provided informed consent or assent. The trial was conducted in accordance with the Declaration of Helsinki.
Risk stratification determined allocation to HSCT based on diagnostic risk and morphologic response. Low-risk patients were not allocated to HSCT, whereas all high-risk patients received an allogeneic HSCT using the best available donor. Standard-risk patients only received a matched family-donor HSCT if available.
Risk stratification
AAML0531 defined diagnostic risk first by cytogenetic or molecular markers. Patients with monosomy 7, deletion 5q, monosomy 5, or FLT3-ITD with a high allelic ratio (HAR; >0.4) were classified as high risk (N = 94). Patients who had inv(16) (including t(16;16) variants), t(8;21), a CEBPA mutation, or an NPM1 mutation were classified as low risk (N = 273). All other patients with known cytogenetics were allocated to the standard-risk group (N = 404). Patients with PD (>15% blasts), as identified by morphologic assessment at EOI1, were also stratified to the high-risk group if they did not have low-risk cytogenetic or molecular markers. Thirteen patients had unknown risk. Cytogenetic/molecular status outweighed response in risk classification, whereas FLT3-ITD HAR outweighed favorable cytogenetics.
Flow cytometric analysis
Bone marrow aspirates drawn in heparin (preferred) or EDTA were submitted for MRD assessment. Flow cytometry was performed centrally at Hematologics with a standardized panel of monoclonal antibodies (CD45 [2D1 (BD), peridinin chlorophyll protein], CD34 [8G12 (BD), allophycocyanin], CD11b [D12 (BD), phycoerythrin (PE)], HLA-DR [L243 (BD), fluorescein isothiocyanate (FITC)], CD36 [FA6.152 (BD), FITC], CD38 [HB7 (BD), FITC], CD15 [MCS-1 (Ex-A), FITC], CD13 [L138 (BD), PE], CD14 [Mϕ/P9 (BD), FITC], CD33 [P67.6 (BD), PE], CD7 [4H9 (BD), FITC], CD56 [MY31 (BD), PE], CD117 [104D2 (BD), PE], CD49d [L25(BD), PE]) designed to detect MRD by using a ΔN.7 Specimens were processed as previously described.6,7 A total of 200 000 events were collected and data analysis was performed with WinList software (Verity Software House) using Boolean gating to identify normal and aberrant cell populations. Detection of residual disease required a cluster of 40 cells with at least 2 phenotypic abnormalities >0.5 decades (log10 U) disparate from the nearest normal counterpart, allowing for the detection of leukemia down to ≥0.02% of total nucleated cells, in a specimen of adequate quality.6,7 The data were analyzed by 2 independent analysts, blinded to patient information, who agreed on MRD status. Results were reported even when specimen quality was poor, unless a call at 0.1% sensitivity was not possible. This occurred in ≤5% of samples evaluated. As a biological correlative study, the results were not shared with the sending institution but were submitted to Children’s Oncology Group (COG) statisticians for analysis.
A retrospective, in silico analysis was completed among patients who submitted a sample at relapse, and were MRD− after EOI1 (N = 60). With the relapse phenotype as a template, reassessment of the EOI1 sample was completed. Furthermore, a comparison of specimens submitted at diagnosis and at relapse (N = 64), with adequate quality, was identified to assess: (1) proximity of the relapse phenotype to regenerating, normal myeloid progenitor cells, and (2) phenotypic evolution from diagnosis to relapse, to quantify the degree that phenotypic changes occurred. From this analysis, patients were grouped into 3 categories: those with no phenotypic changes from diagnosis to relapse, those with minor changes, and those with major changes. Major phenotypic changes were defined as either (1) a change from positive to negative CD34 expression; (2) 2 or more antigens change from positive to negative; or (3) 3 or more changes in antigen intensity >0.5 decades (log10 U). Minor phenotypic changes were defined as 2 changes in antigen intensity >0.5 decades (log10 U). Patients classified with no changes did not meet major or minor criteria.
Mutation screening
Genomic DNA was extracted from diagnostic bone marrow by the Puregene protocol (Gentra Systems, Inc). CEBPA, FLT3-ITD, WT1, and NPM1 mutations were screened as previously described.3,27,28 Patients with inv(16) or t(8;21) were further analyzed for coinciding c-KIT mutations. Cytogenetic karyotyping was completed with standard G-banding techniques.5
Morphologic assessment
The initial diagnosis of AML was made at each contributing institution, and concurrence of the diagnostic morphologic assessment was centrally reviewed. Detection of morphologic complete remission (mCR) in this study was performed by the standard morphologic assessment of bone marrow aspirates counting the proportion of blasts. These data were not centrally reviewed. A cutoff of 5% blasts was used to determine mCR. Patients with PD were defined as having ≥15% blasts.
Statistical analysis
Data were frozen as of 31 December 2017 for analysis. Median follow-up time for all patients alive at last contact was 7.6 years (range, 0-10.9 years). The significance of observed differences in proportions was tested using the Pearson χ2 test and Fisher exact test when data were sparse. The Kaplan-Meier method was used to estimate overall survival (OS) and disease-free survival (DFS).29 OS was defined as time from EOI1 until death. DFS was defined at the time from EOI1 until relapse or death. Estimates of relapse risk (RR) and treatment related mortality (TRM) were obtained by methods that account for competing events.30 RR was defined as the time from EOI1to relapse, where deaths without a relapse were considered competing events. TRM was defined as the time from EOI1 to deaths without a relapse with relapses considered as competing events. Differences between groups of patients for OS and DFS were tested by the log-rank test. The Grays test was used for RR and TRM comparisons. The Cox proportional-hazard model31 was used for multivariable analyses of OS and DFS, whereas a competing risk regression model32 was used for RR and TRM. Children lost to follow-up were censored at their date of last known contact. Five-year estimates were summarized with their corresponding log-log 95% confidence intervals (CIs). An α level of 0.05 was used for P-value significance.
Results
Detection of MRD by ΔN: prevalence, demographics, and correlation with other prognostic features
At EOI1, MRD was detected in 31% of evaluable patients (240 of 784 at levels ranging from 0.02% to 91%; median, 3.9%). The demographic, laboratory, and clinical characteristics of patients with or without MRD at the EOI1 were compared (Table 1). Those with and without MRD had similar age and sex distributions, whereas those with MRD were associated with other high-risk features at diagnosis such as high WBC, increased marrow blasts, and high-risk cytogenetic and/or molecular features. Detection of MRD was decreased in cytogenetic/molecular good risk groups.
Demographic, laboratory, and clinical characteristics of patients with or without MRD at the EOI1
| Characteristic | EOI1 MRD status | ||||
|---|---|---|---|---|---|
| MRD− at EOI1, N = 544 | MRD+ at EOI1, N = 240 | P | |||
| n | % or range | n | % or range | ||
| Total | 544 | 240 | |||
| Sex | |||||
| Male | 274 | 50.4 | 119 | 49.6 | .840 |
| Female | 270 | 49.6 | 121 | 50.4 | |
| Age group, y | |||||
| 0-1 | 107 | 19.7 | 49 | 20.4 | .809 |
| 2-10 | 194 | 35.7 | 82 | 34.2 | .686 |
| >11 | 243 | 44.7 | 109 | 45.4 | .846 |
| Cytogenetics | |||||
| Normal | 102 | 19.3 | 75 | 32.1 | <.001 |
| t(8;21) | 87 | 16.4 | 19 | 8.1 | .002 |
| inv(16) | 78 | 14.7 | 7 | 3.0 | <.001 |
| t(9;11)/11q23 | 129 | 24.4 | 31 | 13.2 | .001 |
| t(6;9) | 7 | 1.3 | 6 | 2.6 | .234 |
| Monosomy 7 | 3 | 0.6 | 14 | 6.0 | <.001 |
| Del(7q) | 3 | 0.6 | 8 | 3.4 | .005 |
| −5/5q | 7 | 1.3 | 5 | 2.1 | .528 |
| +8 | 25 | 4.7 | 26 | 11.1 | .001 |
| Other | 88 | 16.6 | 43 | 18.4 | .557 |
| Unknown | 15 | 6 | |||
| ITD status | |||||
| Negative | 459 | 87.6 | 168 | 74.3 | <.001 |
| Positive | 65 | 12.4 | 58 | 25.7 | |
| HAR | 34 | 6.5 | 32 | 14.2 | |
| Low allelic ratio | 31 | 5.9 | 26 | 11.5 | |
| Unknown | 20 | 14 | |||
| CEBPA status | |||||
| Negative | 491 | 94.4 | 214 | 95.1 | .702 |
| Positive | 29 | 5.6 | 11 | 4.9 | |
| Unknown | 24 | 15 | |||
| NPM1 status | |||||
| Negative | 475 | 91.2 | 209 | 92.9 | .435 |
| Positive | 46 | 8.8 | 16 | 7.1 | |
| Unknown | 23 | 15 | |||
| Risk group, cyto/mutation | |||||
| Standard | 267 | 50.0 | 137 | 57.8 | .045 |
| Low | 224 | 41.9 | 49 | 20.7 | <.001 |
| High | 43 | 8.1 | 51 | 21.5 | <.001 |
| Unknown | 10 | 3 | |||
| Risk group, cytogenetic only | |||||
| Standard | 354 | 66.9 | 189 | 80.8 | <.001 |
| Low | 165 | 31.2 | 26 | 11.1 | <.001 |
| High | 10 | 1.9 | 19 | 8.1 | <.001 |
| Unknown | 15 | 6 | |||
| Response by end of course 1 | |||||
| CR | 463 | 86.2 | 113 | 47.3 | <.001 |
| Partial remission, >5% to 15% | 42 | 7.8 | 52 | 21.8 | <.001 |
| PD, >15% | 25 | 4.7 | 66 | 27.6 | <.001 |
| CNS refractory, declared off therapy | 7 | 1.3 | 7 | 2.9 | .144 |
| Death | 0 | 0.0 | 1 | 0.4 | .308 |
| Not evaluable | 7 | 1 | |||
| Response by end of course 2 | |||||
| CR | 510 | 95.1 | 159 | 71.3 | <.001 |
| Refractory disease | 6 | 1.1 | 51 | 22.9 | <.001 |
| Relapse | 18 | 3.4 | 10 | 4.5 | .453 |
| Death | 2 | 0.4 | 3 | 1.3 | .154 |
| Not evaluable | 8 | 17 | |||
| Age, y | |||||
| Median (range) | 9.6 | (0.02-23.8) | 10.1 | (0.003-29.8) | .978 |
| WBC, ×103/µL | |||||
| Median (range) | 21.35 | (0.2-827.2) | 31.65 | (0.6-447.3) | .014 |
| BM blasts, % | |||||
| Median (range) | 65 | (0.4-100) | 74.75 | (0-99) | .031 |
| Protocol SCT received? | |||||
| Yes | 70 | 12.9 | 52 | 21.7 | .002 |
| No | 474 | 87.1 | 188 | 78.3 | |
Table 1 shows N = 200 (74 + 126) not in CR. The N = 185 in the text of the results consists of patients with partial remission or PD without a CNS relapse. The N = 15 difference consists of patients who had a CNS relapse or who died during induction 1. Bold values in the table body represent statistically significant P values.
The 5-year DFS among MRD+ patients (EOI1) was 30% (CI, 25% to 36%), compared with 57% for MRD− patients (CI, 53% to 61%; P < .001). 5-year OS among MRD+ patients was 48% (CI, 42% to 54%) compared with MRD− patients with 73% (CI, 69% to 76%; P < .001) (Figure 1). MRD was found to be a strong independent prognostic indicator of poor outcome in a univariable analysis for OS, DFS, RR, and TRM (Table 2; supplemental Table 1) when compared to age, diagnostic white blood cell count (WBC), cytogenetic/molecular risk group, and morphologic response. Similarly, detection of MRD at EOI1 remained the strongest predictor of OS in a multivariable Cox analysis (Table 2), and remained an independent prognostic predictor of DFS, RR, and TRM. MRD after EOI2 was also prognostic for 5-year OS, DFS, and RR (supplemental Tables 1 and 2). Therefore, initial response to chemotherapy plays an important role in determining the eventual course and outcome of pediatric AML patients.
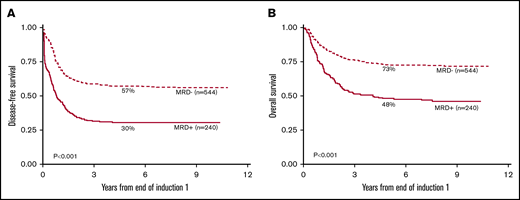
Patients with MRD after EOI1 have significantly worse 5-year DFS and 5-year OS than those who are MRD−by Kaplan-Meier analysis. The 5-year DFS (A) and the 5-year OS (B) from 784 patients enrolled in AAML0531 with MRD+ (N = 240) or MRD− (N = 544) status at EOI1 are shown.
Patients with MRD after EOI1 have significantly worse 5-year DFS and 5-year OS than those who are MRD−by Kaplan-Meier analysis. The 5-year DFS (A) and the 5-year OS (B) from 784 patients enrolled in AAML0531 with MRD+ (N = 240) or MRD− (N = 544) status at EOI1 are shown.
Univariable and multivariable analysis of risk
| OS from EOI1 | DFS from EOI1 | RR from EOI1 | TRM from EOI1 | ||||||||||
|---|---|---|---|---|---|---|---|---|---|---|---|---|---|
| n | HR | 95% Cl | P | HR | 95% CI | P | HR | 95% CI | P | HR | 95% Cl | P | |
| Univariable | |||||||||||||
| MRD at EOI1 | |||||||||||||
| Negative | 544 | 1 | 1 | 1 | 1 | ||||||||
| Positive | 240 | 2.35 | 1.84-2.98 | <.001 | 2.27 | 1.86-2.78 | <.001 | 2.10 | 1.69-2.60 | <.001 | 1.95 | 1.06-3.58 | .031 |
| Age, y | |||||||||||||
| 2-10 | 276 | 1 | 1 | 1 | 1 | ||||||||
| 0-1 | 156 | 1.09 | 0.77-1.54 | .616 | 1.18 | 0.90-1.56 | .231 | 1.17 | 0.87-1.57 | .292 | 1.19 | 0.34-4.22 | .787 |
| ≥11 | 352 | 1.29 | 0.98-1.69 | .068 | 1.09 | 0.87-1.36 | .456 | 0.88 | 0.70-1.11 | .287 | 4.42 | 1.85-10.5 | .001 |
| WBC, ×103/µL | |||||||||||||
| <100 | 625 | 1 | 1 | 1 | 1 | ||||||||
| ≥100 | 159 | 1.22 | 0.92-1.63 | .163 | 1.58 | 1.26-1.98 | <.001 | 1.78 | 1.40-2.25 | <.001 | 0.41 | 0.15-1.15 | .089 |
| Race | |||||||||||||
| Non–African American | 622 | 1 | 1 | 1 | 1 | ||||||||
| African American | 87 | 1.77 | 1.27-2.45 | .001 | 1.32 | 0.98-1.77 | .067 | 1.16 | 0.85-1.59 | .345 | 1.92 | 0.88-4.19 | .101 |
| Risk group, cyto/mutation | |||||||||||||
| Standard | 404 | 1 | 1 | 1 | 1 | ||||||||
| Low | 273 | 0.32 | 0.23-0.44 | <.001 | 0.41 | 0.32-0.52 | <.001 | 0.37 | 0.29-0.48 | <.001 | 1.13 | 0.56-2.25 | .736 |
| High | 94 | 1.23 | 0.89-1.70 | .205 | 1.22 | 0.92-1.62 | .163 | 1.08 | 0.79-1.49 | .629 | 2.14 | 0.97-4.69 | .059 |
| Induction 1 response by morphology | |||||||||||||
| CR | 576 | 1 | 1 | 1 | 1 | ||||||||
| Not in CR | 200 | 1.60 | 1.23-2.06 | <.001 | 2.38 | 1.93-2.93 | <.001 | 2.35 | 1.86-2.98 | <.001 | 1.12 | 0.56-2.25 | .744 |
| Multivariable | |||||||||||||
| MRD at EOI1 | |||||||||||||
| Negative | 476 | 1 | 1 | 1 | 1 | ||||||||
| Positive | 214 | 1.82 | 1.36-2.44 | <.001 | 1.49 | 1.18-1.90 | .001 | 1.35 | 1.04-1.76 | .023 | 2.20 | 1.01-4.76 | .046 |
| Age, y | |||||||||||||
| 2-10 | 246 | 1 | 1 | 1 | 1 | ||||||||
| 0-1 | 133 | 0.85 | 0.58-1.24 | .400 | 0.89 | 0.65-1.20 | .436 | 0.83 | 0.59-1.17 | .292 | 2.03 | 0.49-8.39 | .327 |
| ≥11 | 311 | 1.44 | 1.08-1.92 | .012 | 1.22 | 0.96-1.54 | .105 | 0.96 | 0.74-1.24 | .766 | 5.67 | 1.98-16.2 | .001 |
| WBC, ×103/µL | |||||||||||||
| <100 | 550 | 1 | 1 | 1 | 1 | ||||||||
| ≥100 | 140 | 1.24 | 0.91-1.68 | .171 | 1.52 | 1.19-1.95 | .001 | 1.74 | 1.32-2.30 | <.001 | 0.46 | 0.16-1.30 | .143 |
| Race | |||||||||||||
| Non–African American | 603 | 1 | 1 | 1 | 1 | ||||||||
| African American | 87 | 1.76 | 1.26-2.47 | .001 | 1.32 | 0.98-1.78 | .067 | 1.19 | 0.87-1.64 | .284 | 1.82 | 0.81-4.09 | .147 |
| Risk group, cyto/mutation | |||||||||||||
| Standard | 367 | 1 | 1 | 1 | 1 | ||||||||
| Low | 240 | 0.31 | 0.21-0.44 | <.001 | 0.42 | 0.32-0.55 | <.001 | 0.39 | 0.29-0.52 | <.001 | 1.09 | 0.50-2.38 | .826 |
| High | 83 | 0.92 | 0.64-1.32 | .646 | 0.96 | 0.70-1.32 | .803 | 0.91 | 0.63-1.33 | .639 | 1.25 | 0.47-3.28 | .657 |
| Induction 1 response by morphology | |||||||||||||
| CR | 516 | 1 | 1 | 1 | 1 | ||||||||
| Not in CR | 174 | 1.11 | 0.82-1.50 | .519 | 2.06 | 1.62-2.63 | <.001 | 2.05 | 1.56-2.68 | <.001 | 0.91 | 0.40-2.07 | .827 |
Bold values in the table body represent statistically significant P values.
ΔN response is more sensitive and specific than morphologic response
Response to therapy based on morphologic examination of bone marrow aspirate specimens continues to be an important response determinant,33 and the vast majority of studies that report MRD status as prognostic focus on patients who have achieved mCR. Herein, we present data on patients who did not achieve mCR. Standard morphologic assessment with a cutoff of >5% blasts used to determine mCR; 76% of patients (576) achieved mCR, whereas 24% (185) did not (see Table 1 legend for more details).
Patients who achieved mCR had 55% (CI, 51% to 59%) 5-year DFS (Figure 2A) compared with 34% (CI, 27% to 41%) for those who did not (P < .001). However, of those who achieved mCR, 20% (113 of 576) were MRD+ by flow cytometry with a 5-year DFS of 38% (CI, 29% to 47%) compared with 59% (CI, 55% to 64%) for the mCR/MRD− patients (P < .001) (Figure 2B). Therefore, ΔN identified that 1 in 5 patients with an mCR were actually harboring AML at levels undetected by morphology (ie, morphologic false-negative).
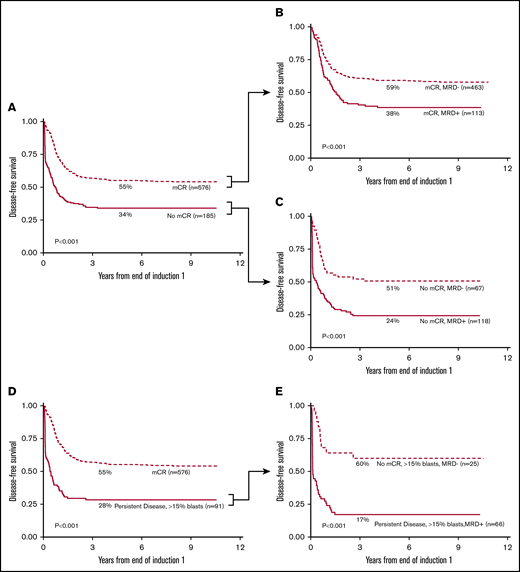
MRD status stratifies morphologic response by Kaplan-Meier analysis. Patients achieving mCR showed a 55% 5-year DFS (A); 20% of these patients (113 of 576 patients) had detectable MRD with 38% 5-year DFS (B). Patients with >5% morphologic blasts (no mCR) had a 5-year DFS of 34% (A); however, in 36% of these patients (67 of 185 patients), the myeloid progenitor cells were phenotypically normal (C) with a 5-year DFS of 52%. Patients with >15% morphologic blasts (D) showed a similar pattern; 27% of patients (25 of 91 patients) were phenotypically normal with a 5-year DFS of 60% (E). (E) Patients with increased phenotypically abnormal blasts at EOI1 (66 of 91 patients) exhibited a dismal 5-year DFS of 17%.
MRD status stratifies morphologic response by Kaplan-Meier analysis. Patients achieving mCR showed a 55% 5-year DFS (A); 20% of these patients (113 of 576 patients) had detectable MRD with 38% 5-year DFS (B). Patients with >5% morphologic blasts (no mCR) had a 5-year DFS of 34% (A); however, in 36% of these patients (67 of 185 patients), the myeloid progenitor cells were phenotypically normal (C) with a 5-year DFS of 52%. Patients with >15% morphologic blasts (D) showed a similar pattern; 27% of patients (25 of 91 patients) were phenotypically normal with a 5-year DFS of 60% (E). (E) Patients with increased phenotypically abnormal blasts at EOI1 (66 of 91 patients) exhibited a dismal 5-year DFS of 17%.
The difference between morphology and ΔN in detecting therapy response was striking among patients who were classified as not achieving mCR. When patients not achieving mCR were considered by MRD status, 36% (67 of 185) were MRD− (ie, morphologic false-positive) whereas 64% (118 of 185) were MRD+. The 5-year DFS of the patients with high blast counts (non-mCR) but normal phenotype was 51% (CI, 38% to 62%) as compared with those with increased blasts with phenotypic abnormalities (non-mCR/MRD positive) with a DFS of 24% (CI, 17% to 33%; P < .001) (Figure 2C).
PD by morphology was defined as ≥15% blasts.; among these, 27% were MRD−. Despite having high blasts counts, these patients had normal hematopoiesis by ΔN and the 5-year DFS of these patients was 60% (CI, 38% to 76%) (Figure 2D-E), as compared with 17% (CI, 9% to 28%; P < .001) for those who had >15% blasts that were phenotypically abnormal (ie, MRD+). These data suggest that in more than one-third of cases, pediatric patients with increased myeloblasts who are assessed by morphology have normal regenerating hematopoietic cells, and not leukemia, and that a higher blast percentage does not necessarily increase sensitivity of the morphological assessment.
The results of the multivariable analysis show that when MRD is compared to morphology, MRD is a stronger predictor of OS and TRM but not of DFS or RR. This demonstrates that morphology showed a higher RR, whereas MRD shows a higher RR and TRM risk. To pursue this further, we examined the mCR/MRD+ patients at EOI1 (N = 113) (Figure 2B) because this group was most likely to be the source of high TRM. Among this group, 29.2% (N = 33 of 113) received a transplant, as opposed to 57 of 463 (12.3%) from the mCR/MRD− group (P < .001). Five-year TRM was also significantly higher for the mCR/MRD+ (N = 113) group with 9.1% (±5.5 vs 4.1% ± 2.0%; P = .040). Of patients with TRM events in the mCR/MRD+ group, 70% were ≥11years of age.
MRD detection improves cytogenetic and molecular risk stratification
Cytogenetic and mutational risk was determined at diagnosis whereas MRD detection measured response to therapy after initial induction. As expected, the prevalence of MRD+ patients (Figure 3A) was highest in the high-risk group (54%), followed by intermediate-risk (34%) and low-risk groups (18%). For patients who were high risk, MRD is able to predict less favorable outcomes (Figure 3B). MRD+ (cytogenetic/molecular) high-risk patients had a 5-year RR of 68% (CI, 52% to 79%) whereas MRD− (cytogenetic/molecular) high-risk patients had a 5-year RR of 40% (CI, 25% to 55%; P < .001). Similarly, MRD+ patients in the standard-risk group (Figure 3B), had a much higher 5-year RR (71%, CI, 63% to 78%) compared with those who were MRD− (49%, CI, 43% to 55%; P < .001). In contrast, MRD status made no difference in outcome for cytogenetic and molecular low-risk patients (Figure 3D).
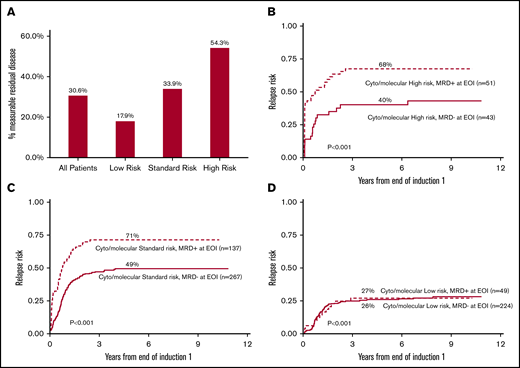
Frequency of patients with MRD after EOI1 correlates with cytogenetic and molecular risk status and MRD status stratifies high- and standard-risk patient RR. (A) Frequency of MRD after EOI1 among all patients, and distribution among low-, intermediate-, and high-risk groups. Presence of MRD after EOI1 stratifies RR of patients with cytogenetic/molecular high-risk (B) and standard-risk (C), but not those with low-risk status (D). The details of cytogenetic and molecular risk stratification were described in “Methods.”
Frequency of patients with MRD after EOI1 correlates with cytogenetic and molecular risk status and MRD status stratifies high- and standard-risk patient RR. (A) Frequency of MRD after EOI1 among all patients, and distribution among low-, intermediate-, and high-risk groups. Presence of MRD after EOI1 stratifies RR of patients with cytogenetic/molecular high-risk (B) and standard-risk (C), but not those with low-risk status (D). The details of cytogenetic and molecular risk stratification were described in “Methods.”
Clinical outcome is independent of leukemia burden
The detectable disease burden at EOI1 ranged from 0.02% to 91% with fewer patients identified at lower, rather than higher, levels (Figure 4A). The patients with >5% MRD had a 5-year DFS of 24% (CI, 16% to 33%) whereas those identified as having 0.02% to 0.1% had a similar DFS of 28% (CI, 12% to 46%) (Figure 4B). Patients with 0.1% to 1% or 1% to 5% also showed little difference in DFS (Figure 4B). When detected, lower and higher levels of MRD are associated with similar DFS, demonstrating specificity at both high and low detection levels. The time to median DFS was considered for each category: MRD ≥5% was 40 days, 1% to 5% was 222.5 days, and MRD 0.02% to 0.1% was 246 days. The 0.1% to 1% range, at 185 days, broke the trend of patients with lower levels of disease taking longer to have a refractory or relapse event. The 5-year TRM was similar between lower and higher levels of MRD (P = .1) (supplemental Figure 1).
![Prevalence of MRD by leukemia burden and 5-year DFS subdivided by EOI1 leukemia burden. MRD prevalence was subdivided by proportion of MRD after EOI1 (A) (0.02%∼0.1% [25 patients], 0.1%∼1% [52 patients], 1%∼5% [79 patients], and ≥5% [107 patients]) among 263 MRD+ patients enrolled in AAML0531. (B) The correlation of 5-year DFS and the amount of MRD at EOI1 is shown. A total of 521 patients enrolled in AAML0531 were MRD− at EOI1. The time to median DFS was considered for each category: ≥5% was 40 days, 1% to 5% was 222.5 days, 0.1% to 1% was 185 days, and MRD 0.02% to 0.1% was 246 days.](https://ash.silverchair-cdn.com/ash/content_public/journal/bloodadvances/4/20/10.1182_bloodadvances.2020002070/1/m_advancesadv2020002070f4.png?Expires=1769097878&Signature=J5k3MDZJ1EPX2cRuv9BCwJAbVxTzZeHkIwSuIdZEj69ECRiZ6l7oNKFAFnwj7cRbmu6gI6x3hdJUmOgoHJwQuxFIRmKSD6-dXGtwkD7M6SWFstcQsu~V6BjkhowHQ3mVgvq4fdlSdMTc7JX5~nUFRRUxJTDLN3oA3Ul13fFnUKGF1LfrIhcsjt3WKMaoJU7lhxHSPK6PeOepNlqpqL8LJfa2BLs9xXypN4bBqNUChk~6u7PPYSBGPJ~VXDs4j6wLDJT5aa4kh8908qEdAZ8bdXeY4tja8m-ATSU46vnZi6YYZEOUZrCyiJZ7ryEijfRsO7Vp4og74ev~IDMdpQsCFw__&Key-Pair-Id=APKAIE5G5CRDK6RD3PGA)
Prevalence of MRD by leukemia burden and 5-year DFS subdivided by EOI1 leukemia burden. MRD prevalence was subdivided by proportion of MRD after EOI1 (A) (0.02%∼0.1% [25 patients], 0.1%∼1% [52 patients], 1%∼5% [79 patients], and ≥5% [107 patients]) among 263 MRD+ patients enrolled in AAML0531. (B) The correlation of 5-year DFS and the amount of MRD at EOI1 is shown. A total of 521 patients enrolled in AAML0531 were MRD− at EOI1. The time to median DFS was considered for each category: ≥5% was 40 days, 1% to 5% was 222.5 days, 0.1% to 1% was 185 days, and MRD 0.02% to 0.1% was 246 days.
Prevalence of MRD by leukemia burden and 5-year DFS subdivided by EOI1 leukemia burden. MRD prevalence was subdivided by proportion of MRD after EOI1 (A) (0.02%∼0.1% [25 patients], 0.1%∼1% [52 patients], 1%∼5% [79 patients], and ≥5% [107 patients]) among 263 MRD+ patients enrolled in AAML0531. (B) The correlation of 5-year DFS and the amount of MRD at EOI1 is shown. A total of 521 patients enrolled in AAML0531 were MRD− at EOI1. The time to median DFS was considered for each category: ≥5% was 40 days, 1% to 5% was 222.5 days, 0.1% to 1% was 185 days, and MRD 0.02% to 0.1% was 246 days.
Retrospective analysis using relapse immunophenotype
Patients who relapsed (or failed induction therapy if death as a first event is not included) who were MRD−, underwent retrospective, in silico, verification of MRD− status using the relapse phenotype as a template. Bone marrow (or peripheral blood) specimens (N = 56) that were submitted at the time of relapse were evaluated for patients with negative EOI1 specimens to evaluate possible reasons why MRD did not predict relapse among these patients. Of the 56, 4 patients had no evidence of relapse in the marrow by ΔN, and were subsequently confirmed as extramedullary relapse. In only 2 cases out of 56 could the relapse phenotype be identified in the EOI1 specimen. One patient was identified as having 0.06% residual disease upon reanalysis. Another patient was found to have abnormal cells in only 1 combination of reagents at 0.04%, not meeting the criteria for a positive result.
A comparison of paired specimens submitted at diagnosis and at relapse (N = 60), with adequate quality for evaluation at both time points, was identified to assess the frequency of phenotypic evolution. All diagnostic patient samples had evidence of AML. Among relapse samples, 56 of 60 had evidence of AML, but 4 did not; all of these were confirmed as extramedullary relapse (these were the same 4 patients mentioned in the prior paragraph with no evidence of relapse in the marrow). Essentially no phenotypic evolution was observed in 28 of 56 patients (50%). Minor phenotypic evolution was observed in 16 of 56 (28.6%) patients. Major phenotypic evolution was observed in 12 of 56 patients (21.1%).
The 56 patients from the paired sample analysis, with evidence of AML at relapse, were also analyzed to determine whether the phenotype of the relapse leukemia shared similar data space to those from the phenotype of regenerating normal cells. The relapse phenotype of 14 patients had significant overlap with the phenotype of normal myeloid progenitor cells, but were detectable by assay criteria. It can be difficult to distinguish these phenotypes down to the 0.02% level, suggesting the lower level of detection of ΔN requires both a frequency limit and an antigen intensity difference. Therefore, most AML relapse phenotypes were sufficiently different from normal to be detected down to 0.02% if the specimen quality was adequate.
Clearance of leukemia
The impact of leukemia clearance on patients receiving subsequent chemotherapy was examined by comparing MRD status after EOI2 and assessing 5-year OS and DFS. The outcome of patients with no MRD after either EOI1 or EOI2 were compared with patients with MRD after EOI1 who either had detectable disease or clearance of disease after second induction (Figure 5).
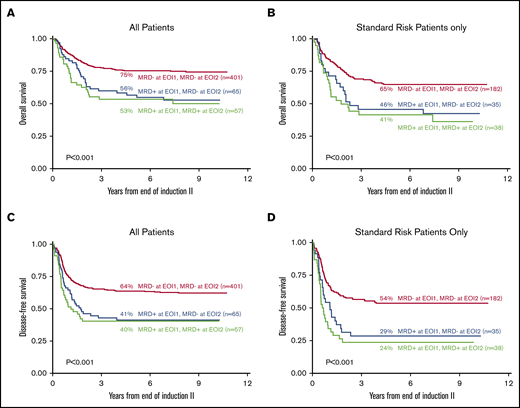
Clinical implications of clearance of MRD from all patients and adjusted for standard-risk patients after EOI2 by 5-year DFS and OS. Five-year OS based on the clearance of MRD at EOI1 and EOI2 of all 523 patients with data at both time points (A) and adjusted for those with standard risk (N = 225) (B) are shown. Five-year DFS based on the clearance of MRD at EOI1 and EOI2 of all 523 patients with data at both time points (C) and adjusted for those with standard risk (N = 225) (D) are shown.
Clinical implications of clearance of MRD from all patients and adjusted for standard-risk patients after EOI2 by 5-year DFS and OS. Five-year OS based on the clearance of MRD at EOI1 and EOI2 of all 523 patients with data at both time points (A) and adjusted for those with standard risk (N = 225) (B) are shown. Five-year DFS based on the clearance of MRD at EOI1 and EOI2 of all 523 patients with data at both time points (C) and adjusted for those with standard risk (N = 225) (D) are shown.
Among all patients, those who were negative after both EOI1 and EOI2, had markedly better 5-year OS and DFS (75%, CI, 71% to 79%; 64% CI, 59% to 68%) than those with disease at EOI1 (P < .001). Notably, those patients who were MRD+ at EOI1 who cleared their leukemia after EOI2 did not have significantly better 5-year OS or DFS (OS, 57%; CI, 44% to 68%; DFS 41% CI, 29% to 53%) as compared with those who remained MRD+ (OS 53% CI, 40% to 65%, P = .571; DFS 40% CI, 28% to 53%). When only standard-risk patients were considered (Figure 5B), those who cleared their disease (5 year-OS 46%, CI, 29% to 61%; 5-year DFS 28% CI, 15% to 44%) showed no significant difference from those who had detectable disease at both time points (5-year OS 41% CI, 26% to 57%, P = .514; 5-year DFS 24%, CI, 12% to 38%, P = .343). HSCT status of each reported subgroup in Figure 5 is listed in supplemental Table 3, demonstrating that HSCT was not imbalanced between groups.
Discussion
The current study, with the largest cohort of pediatric patients yet, demonstrates the prognostic significance of MRD after induction chemotherapy, and that MRD+ status translates to poor outcomes regardless of downstream interventions. The assessment of initial response to chemotherapy by ΔN flow cytometry was the strongest independent predictor of OS. Although both ΔN flow cytometry and morphologic response was independently predictive of DFS and RR, ΔN had the additional power to predict TRM that was not observed by any other laboratory parameter. The limitations of a 5% morphologic blast cutoff to define remission, is clearly evident when compared to ΔN flow cytometry assessment of the cellular composition of a bone marrow aspirate.6-8,11 Historically, similar studies have focused on the ability of flow cytometry MRD to further risk stratify patients whom have achieved CR8,11,13,34,35 ; however, the COG predecessor study, AAML03p1 (N = 203), and results from the AML02 study (N = 216), examined a very small number of patients (N = 6 and N = 7, respectively) that had >15% morphologic blasts, yet no evidence of immunophenotypic abnormal myeloid progenitor cells. These patients had excellent outcomes.6,36
In the current study, 36% of patients with more than 5% morphologic blasts exhibited normal phenotypes on the myeloid progenitor cells with a corresponding better long-term outcome as compared to those who were MRD+ (Figure 2). In patients with PD when ΔN showed a normal phenotype, superior survival was observed 27% of the time, indicating a robust, normal, hematopoietic rebound for these patients. Therefore, simply counting morphologic blasts results in a false positive assessment of leukemia more than one-third of the time. This is the first examination of MRD status among patients not achieving mCR, although it is noted that Inaba et al demonstrated in a smaller cohort that MRD+ status could not be further stratified by morphology.36
The AAML031p1 study, which also used ΔN for MRD assessment showed an identical positive rate of 31% as that observed for AAML0531. The AML02 study showed a similar MRD+ rate (37%), and MRD status was an independent predictor of OS and EFS survival in a multivariable analysis.36 In comparison, results from the AML-BFM (64% MRD+),37 DUTCH/UK (66% MRD+),35 AIEOP (49% MRD+)9 have reported markedly higher MRD+ rates. The NOPHO report38 distinguish a set of patients who have uninformative phenotypes for monitoring, due to using the leukemia-associated immunophenotype approach. When these patients are inclusive of the cohort, the positive rate is 36%, but 47% of those patients are discarded. It is difficult to compare RR, EFS/DFS, and OS between these studies, due to variability in length of follow-up, reporting outcome for all patients versus only those whom achieved morphologic remission, and time points at which MRD is assessed; the European protocols often assess EOI1 at day 14 or 15, whereas in North America day 22-28 is typical.
Most childhood AML studies applied 0.1% as a cutoff, and although 0.1% is also supported by adult data,13 there are studies that show promise below in the 0.1% to 0.02% range.6,12,39,40 The outcome data of variable MRD levels herein (Figure 4B) demonstrate that patients with high levels of disease (>5%) and low levels of disease (0.1% to 0.02%) have nearly identical DFS (24% vs 28%). Patients with disease burdens from 0.1% to 1% and 1% to 5% have slightly better DFS (37% and 35%), but the range of DFS is narrow between all disease levels. Similar findings were reported by Buldini et al.9 What differs here from other studies, is the poor outcomes of patients with MRD from 0.02% to 0.1%. Patients who were MRD− at EOI1 and relapsed underwent retrospective reanalysis using the relapse phenotype as a template; greater than 96% patients defined as MRD negative at EOI1 who eventually relapsed had disease below 0.02%. This suggests that the residual AML among these relapse patients was either present below 0.02% or not in the marrow, possibly in other reticuloendothelial spaces.
AAML03p1 and AAML0531 considered how ΔN adds to molecular/cytogenetic risk status, and both studies showed MRD stratified HR and SR patients. AML02 considered how flow cytometric assessment of MRD compared to fusion transcripts, showing good correlation between PCR−/flow-negative results. Discrepancies between flow cytometry and PCR were primarily among low risk core binding factor AMLs. These findings are consistent with those from AAML0531 that assessed immunophenotypes of childhood AML at diagnosis41 ; the predominant immunophenotypes of the core binding factor AMLs occupied data space near that of normal myeloid progenitor cells, indicating MRD assessment of these phenotypes could be challenging. However, we could not address this directly for AAML0531 due to limited availability of RT-PCR of fusion transcripts.
That MRD− status does not demonstrate much improved outcome compared to mCR threshold alone has been noted. To date, good risk molecular/cytogenetic status have been the only reproducible way to predict good responders42 and the number of good risk markers has not increased dramatically as compared to the number of high-risk markers.42 The fact that in the current study MRD-status did not stratify cytogenetic/molecular/good-risk patients further supports this. What this study demonstrates is the ability of ΔN to identify poor risk patients, who need alternative therapeutic interventions, and good risk patients among those previously thought to be poor responders, which is a significant advancement.
When used to monitor response to therapy, the ΔN algorithm is both sensitive and specific for the detection of MRD after the first course of chemotherapy, conferring a poor outcome for patients who do not reduce their leukemia burden below 0.02%. The reproducibility in MRD+ rates and predictive power of patient outcomes between AAML03p1 (N = 203) in and AAML0531 (N = 784), demonstrates the first set of large, paired studies to accomplish this. Hence, patients with MRD+ status were stratified as high-risk42 in the subsequent COG AAML1031, with intensified chemotherapy and allocation to HSCT.43 These COG reports, along with those from other childhood AML study groups, strongly support the end of morphologic remission as the primary response criteria for childhood AML, similar to the COG ALL protocols.44
A preliminary portion of this work was presented in poster format at the 54th annual meeting of the American Society of Hematology, Atlanta, GA, 8-11 December 2012.
To request data, please e-mail the corresponding author, Lisa Eidenschink Brodersen, at lisa@hematologics.com. AAML0531 clinical trial data have been published in several manuscripts.
Acknowledgments
The authors thank the patients and families for participating in AAML0531.
This work was supported by National Institutes of Health, National Cancer Institute grants U10CA098543 (Chair’s grant), U10CA098413 (the Statistical Center Grant), U10CA180886 (NCTN Operations Center Grant), and U10CA180899 (NCTN Statistics & Data Center Grant).
Authorship
Contribution: L.E.B., M.R.L., and S.M. designed and performed research, analyzed data, and wrote the manuscript; D.P., W.F., F.-C.H., and D.W. performed research, analyzed data, and edited the manuscript; T.A.A. and R.B.G. designed research, performed statistical analyses, and edited the manuscript; M.L.P., S.B.K., B.H., and S.R. performed research and edited the manuscript; and J.A.P., R.A., E.A.K., and A.S.G. designed the research, analyzed data, and edited the manuscript.
Conflict-of-interest disclosure: M.R.L. and D.W. are equity owners of Hematologics, Inc. L.E.B., M.L.P., W.F., D.P., and F.-C.H. are employed by Hematologics, Inc. The remaining authors declare no competing financial interests.
Correspondence: Lisa Eidenschink Brodersen, Hematologics, Inc, 3161 Elliott Ave, Suite 200, Seattle, WA 98121; e-mail: lisa@hematologics.com.

