

Key Points
Long-term survival in MM patients treated with ASCT has improved with the introduction of novel therapeutics.
Outcomes for older patients and those with low-risk disease improved, but those with high-risk disease still experience poor survival.

Abstract
As multiple myeloma (MM) treatments evolve, frequent updates are required to monitor the long-term effect of changes in approach. Traditionally, MM is considered an incurable disease, with most patients eventually relapsing. However, improvements in treatments has raised the possibility that MM might be functionally curable. To examine improvements in long-term survival, we followed 4329 patients with newly diagnosed MM treated with autologous stem cell transplantation (ASCT) at the University of Arkansas for Medical Sciences from 1989 through 2018. Overall survival (OS) and progression-free survival (PFS) were evaluated using Kaplan-Meier analysis, Cox proportional hazards models, relative survival analysis, and cure modeling among different time periods, risk groups, and demographic traits. Steady improvements in OS were found, with patients treated in 2014 or later having superior OS (hazard ratio, 0.35; 95% confidence interval [CI], 0.27-0.45) and reduced excess risk for MM death (relative excess risk, 0.30; 95% CI, 0.22-0.41) compared with patients treated in 1997 or earlier. Patients treated during intervening time periods often had intermediate survival, but trends in OS, PFS, and landmarked analyses were inconsistent. Cure models support the potential for cure, ranging from 6.3% to 31.3%, depending on the year of treatment, with 10.0% to 18.6% of patients achieving their normal life expectancy across multiple periods. There was some evidence of reductions in early mortality within 3 years of diagnosis, longer complete response (CR) duration, and reductions in relapse after achieving CR. However, results differed depending on age, risk group, and cytogenetic characteristics.
Introduction
Since the introduction of novel therapies approximately 2 decades ago, we have seen substantial improvements in the outcomes of patients with newly diagnosed multiple myeloma (MM).1 A Surveillance, Epidemiology, and End Results (SEER)–based analysis of long-term survival in MM patients reported steady improvements over time, with 5-year relative survival peaking at 34.7% in 2002 through 2004, and at 56.7% among patients younger than 50 years of age.2 Despite these highly compelling improvements, the current disease model generally assumes universal fatality with multiple relapses that occur at increasingly short intervals.
Autologous stem cell transplantation (ASCT) is an important component of modern therapy, and a number of studies have compared survival for newly diagnosed MM patients treated with ASCT and novel agents to novel agent combinations alone. These studies reported better complete response (CR), increased rates of minimal residual disease (MRD) negativity, and improved progression-free survival (PFS) for the patients receiving the combinations.3-9 Consistent with improved outcomes and therapeutic advancements, the therapeutic goal has also changed, with a major emphasis on maximizing the depth of response to delay relapse and achieve long-term disease control. The increased likelihood of patients successfully achieving MRD-negative status raises the question of whether MM patients receiving optimized treatment could attain “functional” or “operational” cure,10-12 which contrary to eradication cure, is defined as the adequate suppression of residual malignant cells to achieve sustained disease control.
To estimate the rates of functional cure after treatment with combined novel agents and ASCT, we studied a group of patients treated in a uniform fashion who have undergone long-term follow-up. The total therapy (TT) approach13 followed a strategy based on the use of induction therapy, ASCT, consolidation, and maintenance, and incorporated novel agents as they become available. This consistent approach to therapy, together with the continuous follow-up of patients over time, has provided the unique ability to evaluate improvements in long-term survival and to investigate the possibility of functional cure among patients who received ASCT.
Patients and methods
Patients eligible for inclusion in this study presented at the University of Arkansas for Medical Sciences (UAMS) Myeloma Center with newly diagnosed MM and received ASCT between 1989 and 2018 as part of their first-line therapy. Novel agents were introduced into the TT clinical trials as they became available and were integrated with standard treatments for off-trial patients when medically appropriate (supplemental Figure 1). To determine if survival has improved over time, patients were grouped into 5 time periods that roughly corresponded to the TT trials when novel agents were introduced, and the dates when patients on those trials were receiving their ASCT: 1997 or earlier (reference group), 1998 through 2003, 2004 through 2008, 2009 through 2013, and 2014 or later. Metaphase cytogenetic analysis was attempted on all patients at diagnosis, and patients were assigned to risk classification groups when possible. The translocation cyclin D (TC6) classifications were used to group patients into relevant molecular subgroups.14,15 The Gene Expressing Profiling 70 (GEP70) score was used to define risk status.16 Staging using the International Staging System (ISS) was determined based on the 2005 International Myeloma Working Group definition.17 Given that some patients, especially in the earlier studies, did not have fluorescence in situ hybridization or lactate dehydrogenase measurements, revised-ISS was not determined.
Differences in demographic and disease-related traits were assessed using Kruskal-Wallis 1-way analysis of variance tests to compare medians of continuous variables, and χ2 tests for comparing proportions of categorical variables. Median overall survival (OS) and PFS was calculated using the Kaplan-Meier method,18 considering the date of the first ASCT as the start of the follow-up time. Five-year survival rates were compared using log-rank tests. Analyses were conducted pooled and stratified by age (<65, ≥65) or GEP70 (high or low risk). Subgroup analyses by molecular subtype were executed for some analyses, depending on the sample size. Landmarked analyses were used to assess patients who survived a minimum of 3 years after their first ASCT, and conditional survival analysis was used to estimate the percent surviving an additional 2 years, given that a patient has already survived 3 years following the first ASCT. Pairwise comparisons between specific categories were conducted using the log-rank test. Cox proportional hazards models adjusted by age, sex, race/ethnicity, and clinical trial participation were used to test for trends in long-term survival across the different time periods.
Because the demographics of patients have changed over time, with the proportion of older and nonwhite patients increasing in recent years, a relative survival analysis was conducted that aimed to estimate the excess mortality among TT patients in comparison with a similar control population matched on key demographic traits. Publicly available SEER life tables19 were used to account for the baseline mortality in the general cancer-free US population, matched by age, year, sex, and race/ethnicity. Because SEER data were only available through 2014 at the time of analysis, the 2014 expected mortality values were carried forward for each year through 2018. Relative survival was estimated using a generalized linear model with exact survival times, where the observed number of deaths was assumed to have a Poisson distribution, as described previously.20
To determine if a statistical cure fraction exists within the study population, a PFS parametric mixture cure model13 was used to estimate the proportion of patients achieving long-term survival without MM progression or relapse. This approach assumes that the study population includes a mixture of “cured” patients who will never experience progression or relapse and “uncured” patients who will experience progression or relapse.21 The proportion cured is denoted by p, and contributes to the combined survival curve, S(t), such that S(t) = p + (1-p) × S1(t), where S1(t) is the survival curve for the uncured individuals and was assumed to follow a Weibull distribution. This analysis was restricted to patients enrolled on a TT protocol, where progression/relapse dates were more stringently monitored and reported. For each patient, we also estimated the remaining years of life starting at the date of the first ASCT using the SEER life tables to determine the life expectancy of non-MM individuals with similar demographic characteristics.
All statistical tests were 2-sided, with P < .05 considered statistically significant. Analyses were done using the SAS statistical software package (SAS Institute, Cary, NC) or R (R Foundation for Statistical Computing, Vienna, Austria). All participants provided consent to use their medical records, and study approval from the UAMS institutional review board was obtained.
Results
A total of 4329 MM patients were included, with 43.0% (n = 1861) patients having been enrolled in a TT clinical trial (Table 1). The median age at diagnosis was 58.9 years (range, 17.4-84.8), with 61.1% of patients being male (n = 2646) and 86.0% being white (n = 3723). The median follow-up was 10.5 years (range, 0.01-26.4), with a median OS of 6.9 years. After 3 years of follow-up, 71.6% of patients had not progressed. Across the different time periods, there was no difference in the ratio of males to females; however, there were changes in the age, race/ethnicity, and the proportion of genetic subtypes.
Patient characteristics
| Year of first ASCT | |||||||
|---|---|---|---|---|---|---|---|
| All patients | <1997 | 1998-2003 | 2004-2008 | 2009-2013 | ≥2014 | P* | |
| Sample size | 4329 | 661 | 1002 | 1294 | 837 | 535 | |
| Median follow-up time [range], y | 10.5 [0.01-26.4] | 21.5 [0.02-26.4] | 15.3 [0.01-20.0] | 11.0 [0.01-14.6] | 6.5 [0.02-9.5] | 2.5 [0.01-4.5] | — |
| Age, y | <.0001 | ||||||
| Median [range] | 58.9 [17.4-84.8] | 53.0 [27.1-77.0] | 57.4 [25.1-84.8] | 59.7 [30.3-84.5] | 61.7 [17.4-82.5] | 63.0 [32.9-79.3] | |
| <65 | 3123 (72.1) | 599 (90.6) | 773 (77.2) | 910 (70.3) | 533 (63.7) | 308 (57.6) | |
| ≥65 | 1206 (27.9) | 62 (9.4) | 229 (22.9) | 384 (29.7) | 304 (36.3) | 227 (42.4) | |
| Sex | .88 | ||||||
| Male | 2646 (61.1) | 399 (60.4) | 620 (61.9) | 800 (61.8) | 507 (60.6) | 320 (59.8) | |
| Female | 1683 (38.9) | 262 (39.6) | 382 (38.1) | 494 (38.2) | 330 (39.4) | 215 (40.2) | |
| Race/ethnicity | <.0001 | ||||||
| White | 3723 (86.0) | 610 (92.3) | 894 (98.2) | 1108 (85.6) | 680 (81.2) | 431 (80.6) | |
| African American | 440 (10.2) | 40 (6.1) | 81 (8.1) | 128 (9.9) | 117 (13.8) | 74 (13.8) | |
| Other | 166 (3.8) | 11 (1.7) | 27 (2.7) | 58 (4.5) | 40 (4.8) | 30 (5.6) | |
| On a TT clinical trial | <.0001 | ||||||
| Yes | 1861 (43.0) | 204 (30.9) | 517 (51.6) | 558 (43.1) | 463 (55.3) | 119 (22.2) | |
| No | 2468 (57.0) | 457 (69.1) | 485 (48.4) | 736 (56.9) | 374 (44.7) | 416 (77.8) | |
| TC6 classification | <.0001 | ||||||
| CCND1 | 434 (10.0) | 0 (0.0) | 33 (3.3) | 175 (13.4) | 150 (17.9) | 76 (14.2) | |
| CCND3 | 43 (1.0) | 0 (0.0) | 5 (0.5) | 12 (0.9) | 19 (2.3) | 7 (1.3) | |
| D1 | 650 (15.0) | 0 (0.0) | 56 (5.6) | 255 (19.7) | 221 (26.4) | 118 (22.1) | |
| D2 | 605 (14.0) | 0 (0.0) | 48 (4.8) | 246 (19.0) | 192 (22.2) | 119 (22.2) | |
| MAF/MAFB | 157 (3.6) | 0 (0.0) | 6 (0.6) | 69 (5.3) | 44 (5.3) | 38 (7.1) | |
| MMSET | 274 (6.3) | 0 (0.0) | 29 (2.9) | 112 (8.7) | 92 (11.0) | 41 (7.7) | |
| No data | 2166 (50.0) | 661 (100) | 825 (82.3) | 425 (32.8) | 119 (14.2) | 136 (25.4) | |
| GEP70 | <.0001 | ||||||
| Low risk | 1838 (42.5) | 0 (0.0) | 230 (23.0) | 706 (54.6) | 591 (70.6) | 311 (58.1) | |
| High risk | 397 (9.2) | 0 (0.0) | 33 (3.3) | 170 (13.1) | 124 (14.8) | 71 (13.3) | |
| No data | 2093 (48.3) | 661 (100) | 739 (73.8) | 418 (32.3) | 122 (14.6) | 153 (28.6) | |
| Any chromosomal abnormality | <.0001 | ||||||
| Yes | 1641 (37.9) | 451 (68.2) | 630 (62.9) | 834 (64.5) | 440 (52.6) | 288 (53.8) | |
| No | 2643 (61.1) | 189 (28.6) | 361 (36.0) | 451 (34.9) | 394 (47.1) | 246 (46.0) | |
| No data | 45 (1.0) | 21 (3.2) | 11 (1.1) | 9 (0.7) | 3 (0.4) | 1 (0.2) | |
| Tandem transplant | <.0001 | ||||||
| No | 1648 (38.1) | 247 (37.4) | 392 (39.1) | 335 (25.9) | 386 (46.1) | 288 (53.8) | |
| Yes | 2681 (61.9) | 414 (62.6) | 610 (60.9) | 959 (74.1) | 451 (53.9) | 247 (46.2) | |
| ISS† | <.0001 | ||||||
| I | 1844 (42.6) | 290 (43.9) | 542 (54.1) | 523 (40.4) | 270 (32.3) | 191 (39.0) | |
| II | 1453 (33.6) | 187 (28.3) | 261 (26.1) | 487 (37.6) | 340 (40.6) | 167 (34.1) | |
| III | 792 (18.3) | 73 (11.0) | 186 (18.6) | 263 (20.3) | 204 (24.4) | 60 (12.2) | |
| No data | 240 (5.5) | 111 (16.8) | 13 (1.3) | 21 (1.6) | 21 (1.6) | 72 (14.7) | |
Unless otherwise indicated, values are n (%).
P value from Kruskal-Wallis 1-way analysis of variance test (for comparing medians of continuous variables) and χ2 test (for comparing proportions of categorical variables).
For TT patients, ISS is based on the most recent albumin and β2-M measurement taken between study enrollment and induction therapy. For non-TT patients, ISS is based on the most recent albumin and β2-M measurement taken before the date of the first ASCT.
Time trends in survival
Kaplan-Meier analysis showed a 5-year OS estimate that improved over time: 47% (ASCT in 1997 or earlier), 58% (1998-2003), 62% (2004-2008), 61% (2009-2013), and 70% (2014 or later) (Figure 1A). All periods had better survival when compared with the reference group (1997 or earlier). Although the pairwise comparisons of OS between the 1998 through 2003, 2004 through 2008, and 2009 through 2013 groups were not statistically significant, the 2014 or later group consistently had superior survival when compared with all earlier time periods. Conditional analyses restricting the dataset to patients with a minimum of 3 years of survival showed that the OS trends were similar but many of the pairwise comparisons were no longer statistically significant, including those seen in the 2014 or later group (Figure 1B). For this subset of patients who did not experience early mortality, the range of 5-year survival estimates was much narrower, spanning from 74% to 87% with the slopes of the more recent survival curves being superimposable suggesting that survival remained unchanged since the 1997 or earlier time period. These findings could indicate that the statistically significant differences seen in the nonlandmarked analysis may have been due in part to improvements in preventing early treatment-related deaths. Early mortality was defined as the proportion of patients who died within 3 years of the first ASCT, and is shown in Table 2. After excluding patients who were censored within 3 years of the first ASCT, 30.1% of patients had early mortality. When stratifying by time periods, the proportion of patients with early mortality ranged from 27.5% to 36.4%, and aside from the 2014 or later group, the rate of early mortality appeared to decrease with each subsequent period. Patients who were older, GEP70 high risk, and with chromosomal abnormalities had higher proportions of early mortality (37.2%, 61.4%, and 41.7%, respectively). Although we could not evaluate conditions that may have contributed to reductions in early mortality, this could be related to a number of factors, including the achievement of deeper responses that delay or prevent relapse, better management of frail patients with comorbidities, or improvements in supportive care.

OS and PFS in transplant-eligible patients. (A) OS Kaplan-Meier stratified by time period. (B) Three-year OS landmark Kaplan-Meier stratified by time period. (C) PFS Kaplan-Meier stratified by time period, restricted to patients on a TT protocol. (D) Three-year PFS landmark Kaplan-Meier stratified by time period, restricted to patients on a TT protocol. (E) OS Kaplan-Meier restricted to older patients. (F) OS Kaplan-Meier restricted to younger patients.
OS and PFS in transplant-eligible patients. (A) OS Kaplan-Meier stratified by time period. (B) Three-year OS landmark Kaplan-Meier stratified by time period. (C) PFS Kaplan-Meier stratified by time period, restricted to patients on a TT protocol. (D) Three-year PFS landmark Kaplan-Meier stratified by time period, restricted to patients on a TT protocol. (E) OS Kaplan-Meier restricted to older patients. (F) OS Kaplan-Meier restricted to younger patients.
Percent of patients with early mortality
| Early mortality, n/N (%) | P* | |
|---|---|---|
| All HDTX patients | 1187/3939 (30.1) | — |
| Year of first transplant | .002 | |
| <1997 | 238/654 (36.4) | |
| 1998-2003 | 299/997 (30.0) | |
| 2004-2008 | 362/1276 (28.4) | |
| 2009-2013 | 223/811 (27.5) | |
| ≥2014 | 65/201 (32.3) | |
| Age, y | <.0001 | |
| <65 | 798/2892 (27.6) | |
| ≥65 | 389/1047 (37.2) | |
| Sex | .92 | |
| Female | 460/1522 (30.2) | |
| Male | 727/2417 (30.1) | |
| Race/ethnicity | .30 | |
| White | 1012/3407 (29.7) | |
| African American | 130/389 (33.4) | |
| Other | 45/143 (31.5) | |
| GEP70 | <.0001 | |
| Low risk | 283/1620 (17.5) | |
| High risk | 216/352 (61.4) | |
| Any chromosomal abnormality† | <.0001 | |
| No | 550/2418 (22.8) | |
| Yes | 616/1478 (41.7) | |
| TC6 classification† | <.0001 | |
| CCND1 | 83/390 (21.3) | |
| CCND3 | 6/39 (15.4) | |
| D1 | 106/565 (18.8) | |
| D2 | 129/513 (25.2) | |
| MAF/MAFB | 63/134 (47.0) | |
| MMSET | 94/244 (38.5) | |
| On a TT protocol | <.0001 | |
| No | 810/2138 (37.9) | |
| Yes | 377/1801 (20.9) |
Early mortality defined as death within 3 years of first ASCT, patients who were censored before 3 years of follow-up were excluded from the denominator because their true length of survival is unknown resulting from loss to follow-up.
χ2P value.
Excludes patients with missing data.
Among patients with accurate dates of progression or relapse (those on a TT protocol), the PFS trends were similar though more pronounced compared with OS (Figure 1C-D). In subgroup analyses restricted to older (≥65) or younger (<65) patients, gradual improvements in survival in both groups were seen over time, though survival fractions were always worse in the older patients (Figure 1E-F). We conducted stratified analyses among patients who began treatment before or after 2014 (supplemental Figure 2) and among patients who began treatment before 2014; the older patients had significantly worse 5-year survival. Among patients who began treatment after 2014, there was no statistical difference in the 5-year survival between older and younger patients, suggesting that we have improved our capacity to manage toxicity in older patients. Kaplan-Meier analysis of OS restricted to patients who were older or younger showed similar trends of improvements, with noteworthy improvements in OS in patients treated in 2014 or later (Figure 1E-F).
The impact of cytogenetic and tandem transplantation
Because 1 element of the TT approach was to incorporate cytogenetic analysis and tandem ASCT, we did an exploratory analysis of these 2 factors. To minimize bias from selection for the second transplant, we used a landmarked analysis from 3 years, thereby excluding patients who may have died before receiving a second transplant. Among the remaining patients, treatment with single or TT was not randomly assigned, so residual bias may still exist. This analysis showed an OS benefit for the tandem group overall and borderline significance for PFS benefit (supplemental Figure 3). Temporal changes in these data showed that TT patients in the earliest time period had a significant benefit in PFS, but not OS. However, over time, there were no discernable improvements in either OS or PFS among single-transplant patients. Looking at cytogenetic risk groups t(4;14), t(14;16), t(14;20), and del17p (supplemental Figure 4), patients with high-risk aberrations have impaired OS and PFS, as expected, though there were no differences in survival between the specific abnormalities. Among t(4;14) patients, there were significant improvements in PFS since 1998 through 2003, but similar trends were not observed for OS. The other cytogenetic groups had sample sizes that were too small to evaluate over time. For GEP70 high-risk patients, there was only a small nonsignificant improvement over time, suggesting that current therapies have not significantly affected survival in this group.
Cox modeling
In Cox proportional hazards models adjusted for age, sex, race/ethnicity, and clinical trial participation, improvements in OS were confirmed, with the relative hazard for death decreasing with each successive time period, as compared with the reference group (first ASCT in 1997 or earlier). Patients who had their first ASCT in 2014 or later had the best survival compared with the reference group (hazard ratio, 0.35; 95% confidence interval [CI], 0.27-0.45) (Table 3). Sex, age, and clinical trial participation were also independently predictive of OS, with women having better survival compared with men, older patients having worse survival compared with younger patients, and TT clinical trial participants having better survival compared with those not enrolled on a clinical trial. In Cox subgroup analyses restricted to older, younger, GEP70 high-risk, or GEP70 low-risk patients, overall trends were similar (supplemental Figure 5), though the power was reduced because of the smaller sample sizes.
Cox proportional hazard model
| Covariate | HR | 95% CI | P |
|---|---|---|---|
| Year of first transplant | |||
| <1997 | (reference) | — | — |
| 1998-2003 | 0.08 | 0.72-0.89 | <.001 |
| 2004-2008 | 0.69 | 0.62-0.77 | <.001 |
| 2009-2019 | 0.68 | 0.59-0.78 | <.001 |
| ≥2014 | 0.35 | 0.27-0.45 | <.001 |
| Sex | |||
| Male | (reference) | — | — |
| Female | 0.91 | 0.84-0.98 | .02 |
| Age, y | |||
| <65 | (reference) | — | — |
| ≥65 | 1.65 | 1.51-1.81 | <.001 |
| Race/ethnicity | |||
| White | (reference) | — | — |
| African American | 1.14 | 1.00-1.30 | .05 |
| Other | 1.06 | 0.86-1.32 | .58 |
| Clinical trial | |||
| Non-TT | (reference) | — | — |
| TT participant | 0.59 | 0.54-0.64 | <.001 |
HR, hazard ratio.
Cure models
In the relative survival analysis using the SEER life tables to correct for differences in normal mortality, we found similar results suggesting steadily improving survival over time (Table 4). Relative excess risk (RER) is defined as the excess mortality resulting from MM-related causes after accounting for deaths that occur in the normal population. Compared with the 1997 or earlier reference group, the RER for MM death with each successive time period decreased: 1998 through 2003 (RER, 0.77; 95% CI, 0.68-0.88), 2004 through 2008 (RER, 0.66; 95% CI, 0.58-0.75), 2009 through 2013 (RER, 0.65; 95% CI, 0.55-0.76), and 2014 or later (RER, 0.30; 95% CI, 0.22-0.41). This suggests that the excess mortality resulting from MM decreased with each subsequent period. The incremental improvements in excess risk reduction is consistent with steady progress in preventing MM-related deaths. When analyses were restricted to older or younger patients only, trends were very similar to those compared with the unadjusted Kaplan-Meier results (Figure 2). This was surprising because the advantage of the relative survival analysis was to account for non-MM causes of mortality, which become more common in old age. Relative survival analyses stratified by both age and sex showed similar results, with the 1997 or earlier group having the poorest survival relative to SEER, the 2014 or later group having the best survival relative to SEER, and the middle time periods having intermediate relative survival that were mostly indistinguishable from each other (supplemental Figure 6).
Relative survival
| Covariate | RER | 95% CI | P |
|---|---|---|---|
| Year of first transplant | |||
| <1997 | (reference) | — | — |
| 1998-2003 | 0.77 | 0.68-0.88 | <.0001 |
| 2004-2008 | 0.66 | 0.58-0.75 | <.0001 |
| 2009-2013 | 0.65 | 0.55-0.76 | <.0001 |
| ≥2014 | 0.30 | 0.22-0.41 | <.0001 |
| Sex | |||
| Male | (reference) | — | — |
| Female | 0.95 | 0.87-1.05 | .31 |
| Age, y | |||
| <65 | (reference) | — | — |
| ≥65 | 1.45 | 1.30-1.62 | <.0001 |
| Race/ethnicity | |||
| White | (reference) | — | — |
| African American | 1.12 | 0.96-1.32 | .14 |
| Other | 1.11 | 0.88-1.41 | .37 |
| Clinical trial | |||
| Non-TT | (reference) | — | — |
| TT participant | 0.54 | 0.49-0.59 | <.0001 |
Covariates with an RER <1.0 have smaller relative excess risk for MM death compared with the reference group, after taking into account normal mortality differences by age, sex, race/ethnicity, and year, as reported in the SEER life tables. Covariates with an RER >1.0 have a larger relative excess risk for MM death compared with the reference group.
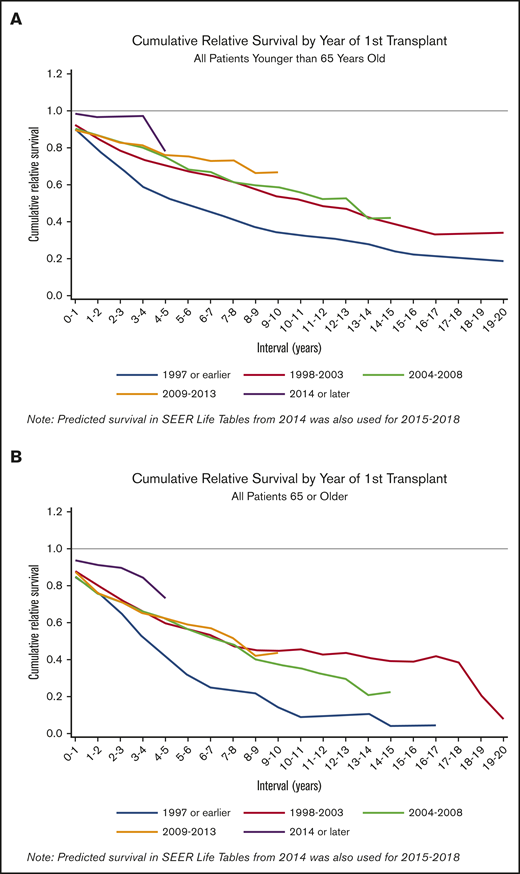
Cumulative relative survival. (A) Cumulative relative survival restricted to patients younger than 65 years of age (n = 3123). (B) Cumulative relative survival restricted to patients 65 or older (n = 1206). Cumulative relative survival shows the ratio of the observed survival in the UAMS cohort, relative to the normal expected survival in the SEER life tables, matched on age, sex, year, and race/ethnicity. Downward sloping lines indicate consecutive years of follow-up where UAMS survival was worse compared with SEER survival. Lines that plateau indicate years where UAMS survival was similar to SEER survival and excess mortality from MM for the given years was approaching 0.
Cumulative relative survival. (A) Cumulative relative survival restricted to patients younger than 65 years of age (n = 3123). (B) Cumulative relative survival restricted to patients 65 or older (n = 1206). Cumulative relative survival shows the ratio of the observed survival in the UAMS cohort, relative to the normal expected survival in the SEER life tables, matched on age, sex, year, and race/ethnicity. Downward sloping lines indicate consecutive years of follow-up where UAMS survival was worse compared with SEER survival. Lines that plateau indicate years where UAMS survival was similar to SEER survival and excess mortality from MM for the given years was approaching 0.
Cure models estimated statistical cure fractions that varied greatly depending on the patient subset (Table 5). Generally, clear plateaus in the PFS Kaplan-Meier curves, which are often used as an indicator that a subset of cured individuals may exist, were not observed for several groups. And models were unable to estimate a statistical cure fraction for the 2014 or later group because of insufficient long-term follow-up. However, for all patients regardless of their transplant date, the statistical cure fraction was estimated to be 16.4%. When stratified by time periods, the statistical cure fraction increased from 6.3% in the 1997 or earlier group to 31.3% in the 2009 through 2013 group. The statistical cure fractions for older and for patients classified as GEP70 high risk were poor (3.0% and 9.0%, respectively), whereas the younger patients and those classified as low risk had statistical cure fractions of 19.8% and 23.1%, respectively. The statistical cure fractions for the TC6 groups ranged from 13.5% (MAF/MAFB) to 56.3% (CCND3); however, the sample sizes for both of these groups was small.
Cure fractions among TT patients only
| n | Median follow-up time (IQR), y | PFS cure fraction, % | |
|---|---|---|---|
| All TT patients | 1802 | 10.8 (7.5-14.3) | 16.4 |
| Year of first transplant | |||
| <1997 | 192 | 22.0 (19.5-24.5) | 6.3 |
| 1998-2003 | 496 | 15.0 (12.8-16.7) | 17.3 |
| 2004-2008 | 549 | 11.0 (9.7-13.0) | 20.0 |
| 2009-2013 | 455 | 6.8 (5.7-8.2) | 31.3 |
| ≥2014 | 110 | 3.1 (2.3-3.9) | 0.0 |
| Age, y | |||
| <65 | 1360 | 11.0 (7.7-14.6) | 19.8 |
| ≥65 | 442 | 9.9 (6.6-13.2) | 3.0 |
| Sex | |||
| Female | 710 | 10.9 (7.6-14.6) | 22.9 |
| Male | 1092 | 10.8 (7.4-14.3) | 12.4 |
| GEP70 | |||
| Low risk | 1092 | 9.6 (6.9-12.8) | 23.1 |
| High risk | 184 | 8.9 (6.8-12.2) | 9.0 |
| Any chromosomal abnormality | |||
| No | 1104 | 11.5 (8.0-14.7) | 14.0 |
| Yes | 692 | 9.8 (6.6-13.5) | 18.6 |
| TC6 classification | |||
| CCND1 | 239 | 8.9 (6.0-11.2) | 31.9 |
| CCND3 | 22 | 8.9 (6.4-10.9) | 56.3 |
| D1 | 392 | 838 (6.6-11.9) | 24.4 |
| D2 | 328 | 9.5 (6.6-12.8) | 14.1 |
| MAF/MAFB | 65 | 9.8 (6.5-12.1) | 13.5 |
| MMSET | 158 | 8.5 (6.8-11.2) | 26.2 |
The cure fraction is the estimated percent of long-term survivors without MM progression or relapse.
IQR, interquartile range.
Although the statistical cure fractions attempt to estimate the proportion of patients who would not experience progression or relapse, we also aimed to determine the number of patients who had life expectancies equal to a healthy individual of similar demographic characteristics. The SEER life tables were used to predict the remaining years of life expectancy for each patient, based on what would be expected for cancer-free individuals of identical age, sex, and race/ethnicity in the calendar year of the first ASCT.22 For each 3-year time span since the start of data collection at UAMS, we calculated the percent of patients who met or exceeded their predicted remaining years of life (Table 6). Although no obvious trends over time were observed, all time periods had at least 10% of patients meeting or surpassing their predicted life expectancy.
Patients meeting or exceeding their predicted remaining years of life, by year of first ASCT
| Year of first ASCT | Meeting or exceeding their predicted remaining years of life, % |
|---|---|
| 1989-1991 | 15.9 |
| 1992-1994 | 13.7 |
| 1995-1997 | 10.0 |
| 1998-2000 | 18.6 |
| 2001-2003 | 14.2 |
| 2004-2006 | 15.1 |
| Year of first ASCT | Meeting or exceeding their predicted remaining years of life, % |
|---|---|
| 1989-1991 | 15.9 |
| 1992-1994 | 13.7 |
| 1995-1997 | 10.0 |
| 1998-2000 | 18.6 |
| 2001-2003 | 14.2 |
| 2004-2006 | 15.1 |
Of the patients who received their first ASCT in 1989 through 1991, 15.9% met or exceeded their predicted remaining years of life. For years beyond 2006, many patients did not have enough follow-up that would allow them to meet (or fail to meet) their predicted life expectancy.
Discussion
The results presented here are consistent with steady progress in improving outcomes for patients with MM by the use of effective drug combinations given in conjunction with ASCT. This group of ASCT patients had a significant improvement in outcome corresponding to the introduction of thalidomide and bortezomib into the standard therapeutic regimens in use for all patients at the Myeloma Institute. In subsequent periods, which corresponded to an institute-wide switch from lenalidomide to thalidomide as the standard approach, we were unable to demonstrate a significant improvement. However, in the most recent time periods, we were able to identify superior OS and PFS, in particular for low-risk and older patients. Currently, there is insufficient follow-up to determine if this recently treated group will be able to achieve prolonged disease-free survival, but with longer follow-up these trends may be confirmed.
The use of novel therapies in the context of ASCT offers an attractive approach to maximize remission rates and depth of response, which could reduce mortality in older patients. Although older patients in this series still had worse outcomes compared with younger patients, strong gains since 1997 were observed in both Kaplan-Meier and Cox models, with the 5-year survival rate increasing from 35% to 63% consistent with improvements in our ability reduce mortality. For patients of any age who were classified as GEP70 high risk, we report high rates of early mortality and a poor statistical cure fraction, and have not been able to demonstrate a significant improvement in outcome since the early 1990s. Consequently, improving both short-term and long-term survival in patients with high-risk disease should be a priority for future research.
Long-term outcomes and cure fractions
The development of a plateau in a Kaplan-Meier curve for PFS is consistent with the possibility of statistical cure. Generally, the plateau roughly estimates the number of patients who will never experience relapse.11 As treatment improves, and a larger proportion of patients achieve MRD negativity, we would expect the curves to have plateaus that level off earlier and remain flat for a longer duration. The inflection point where the plateau begins would indicate the point beyond which relapse does not occur, and we would expect to see this inflection point rise higher on the y-axis as the proportion of patients who will never relapse increases. The 1998 through 2003 and 2004 through 2008 curves do not appear to plateau, and the models estimated statistical cure fractions of 17.3% and 20.0% for these groups, additional follow-up is required to determine if a plateau would eventually be observed. The 1997 or earlier and 2009 through 2013 groups appear to have plateaus that develop beyond 10 years after initial diagnosis. It is possible that the 2009 through 2013 group had improved outcomes because a relatively high proportion of patients were enrolled on a TT clinical trial (55.3%) and a large proportion of patients were GEP70 low risk (70.6%). However, many patients in this group have not yet achieved follow-up longer than 10 years; therefore, a future reevaluation of this cohort will be required. Although these findings may support the possibility of statistical cure for some patients, relapse was still seen after this time, with the latest relapse occurring after 16.7 years of follow-up. Although some patients in the UAMS cohort have demonstrated the possibility of long-term PFS, that relapse was observed nearly 17 years after initial treatment suggests that 20 or more years of follow-up may be required to accurately predict statistical cure fractions. Interestingly, there was an apparent improvement in OS is patient receiving TTs, but even in these cases relapse was seen beyond 10 years.
Among patients with CR data (supplemental Figure 7), the percent of patients who achieve CR or better at 5 years was 39% (1997 or earlier), 60% (1998-2003), 63% (2004-2008), 60% (2009-2013), and 32% (2014 or later). Among patients who achieved CR or better, those treated after 1997 were more likely to have 5 or more years of CR duration and were also less likely to relapse after achieving CR. Although there was insufficient follow-up and sample size to draw conclusions about the 2014 or later group, the results from the other groups suggest that patients may be achieving a deeper molecular response sufficient to delay or prevent the recurrence of disease. Although this does not definitively prove the existence of functional cure, the trends are encouraging. These findings provide evidence of considerable progress in our ability to improve outcomes of patient with MM by preventing early deaths and extending long-term survival through the maximization of deep responses. Such improvements in outcome have been seen previously, such as in a 2011 Spanish study23 reporting a plateau phase after 11 years of follow-up, with 35% of CR patients being alive after 17 years of follow-up and with a low rate of relapse in long-term survivors. Another study examined patients with long-term follow-up who had received treatment from 1987 to 1998 and reported clear plateaus in patients, with up to 3% of patients achieving sustained complete remission for more than 12 years.24 More recently, a 2018 study from Germany that followed patients for nearly 22 years reported that although patients remained in remission for more than 15 years, they did not see evidence of clear plateaus in survival. However, not all of their patients received novel agents, and those that did had insufficient follow-up time to be evaluated for long-term survival.24 A large 2018 multicenter international collaboration examined long-term survival in 7291 clinical trial participants and reported a statistical cure fraction of 14.3%.25 A different approach for assessing MM cure rates was used in a 2018 study that used standardized mortality ratios to measure excess mortality in MM patients compared with observed mortality rates in the United States.26 Although the authors concluded that MM patients were not cured because of a 20-fold excess mortality risk compared with the background population, the patients in this study had median follow-up of only 5.8 years, and only 52% were treated with a hematopoietic stem cell transplant, so the results are not directly comparable. Although this study rightly showcases the deficiencies in MM survival when compared with other “curable” hematological malignancies, it is difficult to know if their results would change with additional years of follow-up and a larger landmark (given that uncured patients can relapse >3 years after treatment), or if a broader definition of “cure” is warranted and applicable for MM patients who exhibit prolonged PFS.
The potential for curability
In this current analysis, multiple approaches were used to evaluate the curability of transplant-eligible MM patients. We observe improvements in OS and PFS, and saw trends suggesting decreasing rates of early mortality. We take these findings to be an indication that ASCT in combination with novel agents used during induction, consolidation, and maintenance are becoming more effective at prolonging disease-free survival. Ongoing efforts to improve the safety, tolerability, and effectiveness of more potent agents could result in curative treatment plans for some patients. One additional factor that could be contributing to prolonged long-term survival might be earlier initiation of treatment resulting from earlier detection or a more aggressive approach toward disease management. However, the median age at first ASCT increased rather than decreased with each subsequent time period. This is a complicated issue to untangle because an earlier initiation of treatment could be masked by a number of factors, including an increased willingness to perform ASCT on older patients, and rising ages at diagnosis because of better life expectancies and preventing competing causes of death, which could lead to a larger number of patients who reach an advanced age when they become susceptible to MM progression.
All recent publications examining the potential of cure for MM have noted the importance of long follow-up, and although it is clear that the more recent groups in this study require additional follow-up and continued patient accrual, the earliest group has been followed for a median of 21.5 years and will continue to be tracked, making the UAMS cohort a valuable resource for future evaluation. Given that statistical cure fractions increased for some subgroups, and that many patients are achieving normal life expectancies with long-term event-free survival, we believe that this could be early evidence that functional cure may exist and that the challenge going forward will be to increase the percentage of patients achieving long-term survival. This study is unique in that it reflects the effects of changing treatment strategies across multiple MM patient subgroups. Although this allows for comparisons of different treatment eras, it is clear from this study that a substantial amount of follow-up is required to adequately test for improvements in long-term survival. Given that uncured patients may take up to 2 decades to be definitively revealed, we acknowledge that some patients are being prematurely assessed. Nonetheless, periodic evaluations are necessary to determine if current treatments are altering the natural history of the disease, especially in the years immediately following the administration of first-line therapies. Despite observing improvements in outcomes for low-risk patients, we highlight the failure to significantly impact the outcome of the 15% of patients with GEP70 high-risk disease underscoring the value of developing risk stratified clinical trials for newly diagnosed patients. Going forward, it is clear that continued efforts to control and eradicate residual disease will be important strategies to increase the likelihood of achieving MM cure.
Authorship
Contribution: G.J.M. initiated the analysis; G.J.M. and A.H. contributed to the study design and analysis; K.K.N. and A.R. performed statistical analyses and made the figures; B.B., F.v.R., M.Z., B.A.W., C.S., S.T., F.E.D., A.H., and G.J.M. reviewed and interpreted the results; and K.K.N. and G.J.M. wrote the paper.
Conflict-of-interest disclosure: The authors declare no competing financial interests.
Correspondence: Gareth J. Morgan, Perlmutter Cancer Center, NYU Langone Medical Center, New York University, 550 1st Ave, New York, NY 10116; e-mail: gareth.morgan@nyulangone.org.

