

Key Points
Early peripheral blast clearance assessed by flow cytometry was a powerful independent predictive factor of treatment outcome.
Clearance rate correlated significantly with induction intensity, supporting the use of this assay in treatment modulation studies.

Abstract
Although genetics is a relevant risk factor in acute myeloid leukemia (AML), it can be minimally informative and/or not readily available for the early identification of patients at risk for treatment failure. In a randomized trial comparing standard vs high-dose induction (ClinicalTrials.gov #NCT00495287), we studied early peripheral blast cell clearance (PBC) as a rapid predictive assay of chemotherapy response to determine whether it correlates with the achievement of complete remission (CR), as well as postremission outcome, according to induction intensity. Individual leukemia-associated immunophenotypes (LAIPs) identified pretherapy by flow cytometry were validated and quantified centrally after 3 days of treatment, expressing PBC on a logarithmic scale as the ratio of absolute LAIP+ cells on day 1 and day 4. Of 178 patients, 151 (84.8%) were evaluable. Patients in CR exhibited significantly higher median PBC (2.3 log) compared with chemoresistant patients (1.0 log; P < .0001). PBC < 1.0 predicted the worst outcome (CR, 28%). With 1.5 log established as the most accurate cutoff predicting CR, 87.5% of patients with PBC >1.5 (PBChigh, n = 96) and 43.6% of patients with PBC ≤1.5 (PBClow, n = 55) achieved CR after single-course induction (P < .0001). CR and PBChigh rates were increased in patients randomized to the high-dose induction arm (P = .04) and correlated strongly with genetic/cytogenetic risk. In multivariate analysis, PBC retained significant predictive power for CR, relapse risk, and survival. Thus, PBC analysis can provide a very early prediction of outcome, correlates with treatment intensity and disease subset, and may support studies of customized AML therapy.
Introduction
Acute myeloid leukemia (AML) is a heterogeneous disease with large variations in prognosis. Among prognostic factors, karyotype and molecular genetics are the most relevant and represent the framework of the European LeukemiaNet (ELN) risk stratification system.1,2 Large clinical studies have established the adequacy of this classification, which provides a general prediction of a priori AML chemosensitivity and correlates with the achievement of complete remission (CR) and long-term survival.3,4 Nevertheless, the response to induction chemotherapy remains a powerful prognostic parameter. Within responsive patients who enter CR, minimal residual disease (MRD) is emerging as a strong adjunctive tool to refine the initial genetic risk category.5-7 Typically, MRD is evaluated after ≥1 chemotherapy course. In some studies, an early evaluation of bone marrow (BM) status 7 days after completion of induction chemotherapy has been shown to predict outcome, pointing out the importance of the early disappearance of AML blasts.8
To assess an earlier prognostic parameter, several studies have evaluated the kinetics of AML cell reduction in peripheral blood (PB) samples after a few days of induction chemotherapy. Studies based on a morphological analysis of blood smears have been informative for separating patients with different induction outcomes and prognoses.9,10 The French group Groupe Ouest Est Leucemies Aigues Myeloblastiques studied decreases in blast cells by multiparameter flow cytometry (MFC), showing a clear correlation with outcome.11 In that study, blast cell decrease was expressed by a time-to-clearance modality between baseline and the day that 90% of the initial blast cell load had disappeared.11 Another MFC study from China confirmed that patients with quicker blast reduction had greater CR and lower relapse rates.12
In a pilot study using daily MFC analysis of peripheral blast clearance (PBC), we demonstrated a clear dichotomy between responsive and refractory patients from day 2 of induction therapy, establishing day 4 as the most informative PBC time point for estimating the probability of a response.13,14 Despite the fact that PBC was a powerful prognostic indicator for CR achievement and survival in all of these studies, no clinical study has been designed to assess PBC-related results in a prospective phase 3 trial comparing different induction chemotherapy regimens. These types of data would greatly increase the interest in using PBC analysis for PBC-modulated induction trials because of the potential advantage offered by rapid customization of chemotherapy intensity in patients classified as being at high risk for failure. To collect this evidence and validate the findings of the pilot single-center study in a larger multicenter setting with centralized analysis, the PBC study was embedded in the Northern Italy Leukemia Group (NILG) AML 02/06 phase 3 trial,15 in which adult AML patients were randomly allocated to standard- or high-dose CR induction chemotherapy. The aim of the PBC study was to compare PBC responses and related therapeutic outcomes in the 2 randomization cohorts and across different AML risk subsets.
Patients and methods
Patients and AML diagnosis
Eligible patients had a diagnosis of untreated AML, according to World Health Organization criteria.16 AML subtypes were defined by cytogenetics, histopathology, and molecular genetics.17 For the NPM1 mutation, core marrow biopsies were studied at the Institute of Hematology, Perugia University (Italy).18 For molecular biology (MLL and core binding factor [CBF] gene rearrangements, FLT3 internal tandem duplication, and CEBPA mutations), fresh blood and marrow samples and frozen DNA/RNA samples were studied at the Hematology Unit, Bergamo Hospital (Italy).19-21
Treatment protocol
The NILG AML 02/06 trial (ClinicalTrials.gov Identifier: NCT00495287) included randomization between a standard CR induction arm with 12 mg/m2 per day of idarubicin IV on days 1 through 3, 100 mg/m2 per day of etoposide IV on days 1 through 5, and 100 mg/m2 twice-daily cytarabine IV over 1 hour on days 1 through 7 (ICE) vs a high-dose sequential (HDS) arm with 2000 mg/m2 twice-daily cytarabine IV over 2 hours on days 1, 2, 8, and 9 and 18 mg/m2 per day of idarubicin IV on days 3 and 10. Preinduction hydroxyurea was allowed in patients with blood counts >50 × 109/L. Other treatment details, including consolidation therapy, risk-oriented allotransplantation strategy, and risk definition criteria, were published previously.15
PBC study
The PBC project was approved as a secondary trial objective with a study amendment issued in April of 2009 by the Ethical Committee of the coordinating institution (Department of Hematology, Florence University Hospital, Florence, Italy) and other participating centers. Written informed consent was obtained from trial patients in accordance with the Declaration of Helsinki. MFC study files reporting individual LAIP profiles were acquired locally according to predefined standard operative procedures. LAIPs were defined by antigen expression on blast cells from fresh diagnostic BM samples. Standard MFC methodology for LAIP definition and detection and the PBC study is detailed in supplemental Files S1 and S2.1. Four LAIP types were considered: cross-lineage antigen expression, asynchronous antigen expression, lack of antigen expression, and antigen overexpression (supplemental File S1).6,22,23 To ensure optimal sensitivity, inclusion in the PBC study required the presence of ≥100 circulating LAIP+ cells per microliter at diagnosis. Case-specific LAIP+ cells were enumerated on EDTA-anticoagulated samples of PB collected before chemotherapy on days 1 and 4 of the first induction course. Based on previous studies, day 4 was chosen as the earliest possible informative PBC time point.14 MFC files, blinded with regard to clinical and biological features, were sent electronically to the coordinating center for review and data analysis. The study was performed using a BD FACSCanto II flow cytometer equipped with BD FACSDiva Software (both from BD Biosciences, San Jose, CA) for data acquisition. The files were analyzed using Infinicyt software (Cytognos, Salamanca, Spain), and PBC data were entered into electronic case report forms. PBC was expressed as the ratio between the absolute LAIP+ cell count pretherapy on day 1 and pretherapy on day 4 converted to a logarithmic (base 10) scale (Figure 1A).

Overall design of PBC study and correlation with response to induction. (A) Design of the study of PBC within NILG AML trial 02/06. The trial provided a randomization (R) between standard (ICE) and intensified (HDS) induction chemotherapy. Along treatment, on day 1 and day 4, cells bearing a previously identified aberrant immune-phenotype (LAIP) were quantified by multiparameter flow cytometry, and files were transmitted to the Coordinating Center for central analysis of data and PBC calculation. (B) Box plots show the distribution of PBC values according to response to first cycle. (C) ROC curve methodology allowed setting 1.5 logs as the best cutoff at separating patients with significantly different outcomes. For this threshold, the area under the curve (AUC) was 0.792. (D) Time to achievement of CR according to PBC category (<1.5 log or ≥1.5 log).
Overall design of PBC study and correlation with response to induction. (A) Design of the study of PBC within NILG AML trial 02/06. The trial provided a randomization (R) between standard (ICE) and intensified (HDS) induction chemotherapy. Along treatment, on day 1 and day 4, cells bearing a previously identified aberrant immune-phenotype (LAIP) were quantified by multiparameter flow cytometry, and files were transmitted to the Coordinating Center for central analysis of data and PBC calculation. (B) Box plots show the distribution of PBC values according to response to first cycle. (C) ROC curve methodology allowed setting 1.5 logs as the best cutoff at separating patients with significantly different outcomes. For this threshold, the area under the curve (AUC) was 0.792. (D) Time to achievement of CR according to PBC category (<1.5 log or ≥1.5 log).
Definitions
The definitions of CR, nonresponsive (NR) disease, early induction death (ED), recurrence, disease-free survival (DFS), event-free survival (EFS), cumulative incidence of relapse (CIR), and overall survival (OS) were based on standard criteria,24 as reported in the treatment protocol (supplemental File S1). For risk definition, patients were stratified according to the original NILG study design and the ELN 2010 system in post hoc analysis.1 In the NILG risk classification, the standard-risk (SR) group included patients with CBF+ AML and those with normal or intermediate-risk cytogenetics/genetics, without any of the following additional risk factors: diagnosis of minimally differentiated AML, erythroleukemia, megakaryoblastic leukemia, granulocytic sarcoma, or central nervous system leukemia; prior myelodysplastic syndrome (MDS) or myeloproliferative neoplasm (MPN); prior malignancy treated with radiotherapy/antineoplastic drugs; white blood cell (WBC) count >50 × 109/L; or FLT3 mutations. All other patients were included in the high-risk (HR) category. The definitions of intermediate- and high-risk cytogenetics are reported in supplemental File S1. Using the ELN 2010 genetic classification system, patients were subdivided into good-risk, intermediate-risk 1, intermediate-risk 2, and adverse-risk groups.1
Statistical analysis
Receiver operating characteristic (ROC) analysis was performed to assess the PBC threshold that best discriminated CR achievement after the first induction course. A cutoff that maximized the Youden’s index was selected as the optimal threshold; in the case of equal values, the cutoff with better sensitivity was chosen. Patients who died during first induction were excluded from the analysis. Pairwise comparisons between patient characteristics were performed using the Mann-Whitney U test or the Kruskal-Wallis test for continuous variables and Pearson’s χ2 test or Fisher’s exact test for categorical variables. Survival was estimated by the Kaplan-Meier method, and long-term outcomes were compared using the log-rank test. The incidence of relapse and overall CR were assessed using the cumulative incidence function, considering death as a competing event. The Cox proportional hazard model was applied to estimate hazard ratios with 95% confidence intervals (CIs) for CR rate after 1 or 2 chemotherapy courses, CIR, DFS (ie, interval from CR to relapse or death), OS (ie, interval from study entry to death), and EFS (ie, interval from study entry to death, failure to achieve CR [2 courses], or relapse), in the univariate and multivariate context. Otherwise, logistic regression was used to estimate odds ratios with 95% CIs for CR achievement after the first induction course. All P values were 2-sided, and a 5% significance level was fixed. Statistical analyses were performed with SAS version 9.4 and R version 3.5.0.
Results
Patients and LAIPs
The NILG AML 02/06 trial recruited 574 patients at 17 centers. Between April 2007 and March 2012, 4 main study sites adhered to the PBC project, enrolling 178 patients. A comparative analysis between studied and nonstudied patients ruled out any selection bias and confirmed a comparable distribution of pretreatment risk factors (Table 1) and similar outcomes (supplemental File S2.2). Twenty-seven eligible patients were excluded from the PBC study because of absent circulating blasts (n = 7, 3.9%), LAIP+ cell count <100 per microliter (n = 3, 1.7%), or lack of suitable LAIP (n = 17, 9.6%). A total 151 patients (84.8%) exhibited sufficient LAIP+ cells within each of the 4 predefined LAIP subtypes and were assessable for the PBC study (supplemental File S2.3). The clinical characteristics of the 27 excluded patients were also comparable to the study population, with the exception of a higher leukocyte count (supplemental File S2.4). No significant difference emerged among patients in the 2 trial arms (ICE, n = 82; HDS, n = 69), with the exception of a higher median age for patients in the standard arm, imputable to the exclusion of many patients older than 65 years from the randomization (Table 1).
Patient characteristics
| Trial patients (N = 572) | PBC study patients | P* | |||
|---|---|---|---|---|---|
| All (N = 151) | ICE arm, n = 82 (54.3 %) | HDS arm, n = 69 (45.7%) | |||
| Age, median (range), y | 52 (16-73) | 53 (20-73) | 59.5 (28-73) | 47 (20-72) | <.0001 |
| Males, n (%) | 301 (52.6) | 78 (51.7) | 44 (53.66) | 34 (49.28) | .5913 |
| ECOG performance score, n (%) | .6338 | ||||
| 0 | 292 (51.1) | 77 (51.0) | 39 (47.56) | 38 (55.07) | |
| 1 | 232 (40.6) | 63 (41.7) | 37 (45.12) | 26 (37.68) | |
| 2-3 | 48 (8.3) | 11 (7.3) | 6 (7.32) | 5 (7.25) | |
| White blood cells, median (range), ×109/L | 10.5 (0.5-990) | 16.8 (1.0-282.0) | 13.3 (1.2-282.0) | 20.8 (1.0-260.0) | .3361 |
| Hemoglobin, median (range), g/dL | 9.1 (3-15.8) | 9.2 (5.1-15.8) | 9.5 (5.3-14.1) | 8.8 (5.1-15.8) | .5376 |
| Platelets, median (range), ×109/L | 53 (2-852) | 51.0 (2.0-852.0) | 53.0 (2.0-373.0) | 46.0 (10.0-852.0) | .2334 |
| Diagnosis, n (%) | .6510 | ||||
| De novo AML | 494 (86.4) | 140 (92.7) | 75 (91.46) | 65 (94.20) | |
| Secondary (MPN/MDS) | 49 (8.6) | 9 (6.0) | 5 (6.10) | 4 (5.80) | |
| Therapy related | 29 (5.1) | 2 (1.3) | 2 (2.44) | 0 (0.00) | |
| Cytogenetics, n (%) | .1748 | ||||
| SR | 52 (9.1) | 22 (14.6) | 9 (10.98) | 13 (18.84) | |
| t(8,21) | 20 (3.5) | 10 (6.6) | 6 (7.32) | 4 (5.80) | |
| Inv(16) | 31 (5.4) | 11 (7.3) | 3 (3.66) | 8 (11.59) | |
| del(16) | 1 (0.2) | 1 (0.7) | 0 (0.00) | 1 (1.45) | |
| Normal (46 XX/XY) | 272 (47.6) | 70 (46.4) | 45 (54.88) | 25 (36.23) | |
| Intermediate risk | 21 (3.7) | 8 (5.3) | 4 (4.88) | 4 (5.80) | |
| HR | 170 (29.7) | 42 (27.8) | 21 (25.61) | 21 (30.44) | |
| Unknown | 57 (10.0) | 9 (6.0) | 3 (3.66) | 6 (8.70) | |
| Genetics | |||||
| RUNX1-RUNX1T1, n | 558 | 144 | 75 | 69 | .7481 |
| Rearranged, n (%) | 27 (4.8) | 10 (6.9) | 6 (8.0) | 4 (5.8) | |
| CBF-MYH11, n | 557 | 144 | 75 | 69 | .0221 |
| Rearranged n (%) | 41 (7.4) | 14 (9.7) | 3 (4.0) | 11 (15.9) | |
| NPM1, n | 551 | 143 | 76 | 67 | .1617 |
| Mutant n (%) | 167 (30.3) | 47 (32.9) | 28 (36.8) | 19 (28.4) | |
| FLT3-ITD, n | 569 | 145 | 76 | 69 | .7990 |
| Mutant n (%) | 103 (18.1) | 35 (24.1) | 19 (25.0) | 16 (23.2) | |
| MLL-PTD, n | 397 | 119 | 68 | 51 | .0445 |
| Mutant n (%) | 24 (6.0) | 12 (10.1) | 6 (8.8) | 6 (11.8) | |
| CEBPA, n | 361 | 150 | 81 | 69 | .0239 |
| Mutant (double mutation) n (%) | 19 (5.3) | 8 (5.3) | 1 (1.2) | 7 (10.1) | |
| NILG risk classification, n (%) | .1048 | ||||
| SR | 156 (27.3) | 51 (33.8) | 23 (28.0) | 28 (40.6) | |
| HR | 416 (72.7) | 100 (66.2) | 59 (72.0) | 41 (59.4) | |
| ELN 2010 risk classification, n | 518 | 144 | 80 | 64 | .1688 |
| Favorable, n (%) | 166 (32.0) | 56 (38.9) | 27 (33.8) | 29 (45.3) | |
| Intermediate 1, n (%) | 147 (28.4) | 35 (24.3) | 25 (31.2) | 10 (15.6) | |
| Intermediate 2, n (%) | 70 (13.5) | 18 (12.5) | 9 (11.3) | 9 (14.1) | |
| Adverse, n (%) | 135 (26.1) | 35 (24.3) | 19 (23.7) | 16 (25.0) | |
PBC study patients represented 26.3% of all trial patients and expressed comparable clinico-biologic and risk features. Among PBC study patients, those randomized to HDS chemotherapy were significantly younger than the control patients.
ECOG, Eastern Conference Oncology Group; ITD, internal tandem duplication.
ICE vs HDS. Differences between treatment groups were evaluated using the Mann-Whitney U test for continuous variables and Pearson’s χ2 test (or Fisher’s exact tests for cells <10) for categorical variables.
PBC study and CR induction
After the start of induction chemotherapy, the median absolute LAIP count in the entire study population of 151 PBC-evaluable patients decreased from 4198 per microliter (range, 120-148 859) at baseline to 41.8 per microliter (0.07-44 802) on day 4, resulting in a median PBC of 1.9 log (range, 0.30-4.50) after the first 3 days of chemotherapy. At the time of the evaluation of responses after induction course 1, 108 patients achieved CR (71.5%), 9 experienced an ED (6.0%), and 34 were declared NR (22.5%). NR patients exhibited significantly more residual LAIP+ cells on day 4 compared with CR patients and had a markedly lower median PBC of 1.0 log compared with 2.3 log (P < .001; Table 2; Figure 1B). PBC strata (<1.0 vs 1-1.5 vs >1.5) predicted a linear correlation with CR, with a very low CR rate in patients with PBC < 1.0 (28%) (supplemental File S2.5). The best predictive PBC cutoff for CR, evaluated by ROC methodology and correlating with the highest area under the curve AUC (0.792), was 1.5 log (Figure 1C; supplemental File S2.6). Using this cutoff, 96 of the 151 patients were in a high PBC range (>1.5 log; PBChigh), and 55 were in a low PBC range (≤1.5 log; PBClow). Using these 2 distinct PBC ranges as possible predictive markers of different therapeutic responses, we found that 84 of 96 PBChigh patients (87.5%) achieved a CR with a single chemotherapy course, compared with only 24 of 55 PBClow patients (43.6%, P < .0001). When evaluated after a second chemotherapy course administered to NR patients (n = 20), the CR rate increased to 90% and 62% in PBChigh (n = 86/96) and PBClow (n = 34/55) patients, respectively (P < .0001), with overall NR rates of 6% and 29%, respectively. Consequently, the prognostic difference favoring the PBChigh group was also reflected in the time-to-CR analysis (Figure 1D).
Outcome to induction therapy after course 1 according to PBC response and randomization arm
| All patients | CR patients* | NR patients | ED patients | P† | |
|---|---|---|---|---|---|
| Patients, n (%) | 151 (100.0) | 108 (71.5) | 34 (22.5) | 9 (6.0) | |
| LAIP+cells/µL, median (range) | |||||
| Day 1 | 4 198.2 (120.4-148 859.3) | 4 502.2 (134.2-106 933.8) | 2 853.12 (120.4-148 859.3) | 1 496.8 (1 558-71 331.8) | .24 |
| Day 4 | 41.8 (0.1-44 802.3) | 29.4 (0.1-11 035.5) | 104.5 (0.2-44 802.3) | 96.0 (1.8-627.8) | .001 |
| PBC(log reduction) | |||||
| Median (range) | 1.9 (0.3-4.5) | 2.3 (0.4-4.3) | 1.0 (0.3-4.5) | 1.4 (0.5-2.9) | <.0001 |
| PBChigh, n (%) | 96 (63.6) | 84 (77.8) | 8 (23.5) | 4 (44.4) | <.0001 |
| PBClow, n (%) | 55 (36.4) | 24 (22.2) | 26 (76.5) | 5 (55.6) | |
| PBC by randomization arm | |||||
| ICE arm (n = 82) | |||||
| Median (range) | 1.8 (0.3-4.5) | 2.2 (0.4-4.0) | 1.0 (0.3-4.5) | 1.4 (0.5-2.9) | <.0001 |
| PBChigh, n (%) | 46 (56.1) | 39 (78.0) | 4 (16.0) | 3 (14.3) | <.0001 |
| PBClow, n (%) | 36 (43.9) | 11 (22.0) | 21 (84.0) | 4 (85.7) | |
| HDS arm (n = 69) | |||||
| Median (range) | 2 (0.6-4.2) | 2.4 (0.6-4.2) | 1.5 (0.7-2.5) | 1.4 (1.0-1.9) | .02 |
| PBChigh, n (%) | 50 (72.5) | 45 (77.6) | 4 (44.4) | 1 (50.0) | .05 |
| PBClow, n (%) | 19 (27.5) | 13 (22.4) | 5 (55.6) | 1 (50.0) | |
| P (HDS vs ICE arm) | 0.04 | 0.72 | 0.08 | 0.89 |
Number of CR patients in ICE arm (N = 82) vs HDS arm (N = 69): n = 50 (61%) vs n = 58 (84.1%) (P = .003).
Mann-Whitney U test or Kruskal-Wallis test was used for continuous variables; Pearson’s χ2 test was used for categorical variables.
PBC study and CR induction results according to randomization arm
By the time PBC was assessed, differences in chemotherapy included a 50% lower cumulative idarubicin dose (18 vs 36 mg/m2), a lack of etoposide (0 vs 300 mg/m2), and a substantial increase in cytarabine dose (8000 vs 600 mg/m2) and exposure time (12 hours vs 6 hours) in the HDS arm compared with the ICE induction arm. The single-course CR rate was 61% (n = 50/82) with ICE vs 84.1% (n = 58/69) with HDS (P = .002), with a lower incidence of resistant AML (30.5% vs 13%; P = .0106) and comparable ED rate (8.5% vs 2.9%; P = .18). The average therapy-related PBC response was 1.8 (0.3-4.5) in the ICE arm and 2.0 (range 0.6-4.2) in the HDS arm (P = .0375). After analyzing the results based on a high or low PBC response, more patients in the HDS arm exhibited a PBChigh profile compared with patients in the ICE arm (72.5% vs 56.1%, P = .04; Table 2). Altogether, the combined end point of a PBChigh response at day 4, followed by CR after a single induction course, was achieved in 47.5% (n = 39/82) and 72.4% (n = 45/69) of the patients in the ICE and HDS arms, respectively (P = .04). PBC results did not differ significantly among NR patients in either study arm.
PBC and prognostic analysis
Using univariate analysis, the achievement of CR was significantly affected by patient age, diagnosis of MDS/MPN-associated or secondary AML, risk classification (NILG or ELN), type of induction chemotherapy, and PBC. PBC strata also significantly affected the 5-year OS, DFS, EFS, and CIR (supplemental File S2.5). In multivariate analysis, a PBChigh profile was the most powerful predictive factor for CR after single-course induction (P < .0001), along with NILG or ELN risk class (Table 3). Considering the total CR rate after reinduction course 2, PBC and secondary disease maintained their independence, whereas risk stratification lost its impact (supplemental File S2.7). Because of the strong statistical relationship between PBChigh and CR after course 1, we investigated the role of pretreatment risk factors in predicting a good PBC response. A PBChigh status correlated significantly with a good patient performance score (univariate analysis only), the use of HDS induction chemotherapy, and a more favorable risk profile defined by NILG or ELN criteria (supplemental File S2.8). Thus, considering the ELN-defined subgroups, the average PBC response ranged from 2.32 for favorable risk to 2.06, 1.49, and 1.32 in the intermediate-1, intermediate-2, and adverse cytogenetic/genetic risk subsets (P < .0001); corresponding CR rates were 91%, 69%, 61%, and 46%, respectively. CR patients consistently expressed higher PBC values in each of the 4 risk categories (Figure 2). The proportion of patients with a PBChigh profile varied across the 4 risk subsets: 77% (n = 43/56), 57% (n = 20/35), 33% (n = 6/18), and 29% (n = 10/35) in the favorable-, intermediate-1, intermediate-2, and adverse-risk subsets, respectively (P < .0001). In contrast, NR rates varied from 9% to 54% (P < .0001), almost invariably in association with PBClow results.
Univariate and multivariate analysis for achievement of CR at R1 evaluation
| CR/N (%) | Univariate | Multivariate* | |||||
|---|---|---|---|---|---|---|---|
| OR (95% CI) | P | OR (95% CI) | P | OR (95% CI) | P | ||
| Age, y | |||||||
| <60 | 77/95 (81.1) | 3.45 (1.65-7.20) | .001 | 2.55 (0.99-6.57) | .05 | 2.37 (0.82-6.88) | .11 |
| ≥60 | 31/56 (55.4) | 1.00 | 1.00 | 1.00 | |||
| Sex | |||||||
| Male | 53/78 (67.9) | 1.00 | 1.00 | 1.00 | |||
| Female | 55/73 (75.3) | 1.44 (0.71-2.94) | .32 | 1.33 (0.54-3.27) | .53 | 1.07 (0.40-2.82) | .89 |
| WBCs, ×109/L | |||||||
| ≤50 | 75/108 (69.4) | 1.00 | 1.00 | ||||
| >50 | 33/43 (76.7) | 1.45 (0.64-3.29) | .37 | 1.18 (0.40-3.51) | .77 | ||
| AML | |||||||
| Secondary | 4/11 (36.4) | 1.00 | 1.00 | ||||
| De novo | 104/140 (74.3) | 5.06 (1.40-18.29) | .01 | 3.25 (0.61-17.22) | .17 | ||
| ECOG performance status | |||||||
| 0 | 62/77 (80.5) | 3.44 (0.93-12.82) | .07 | 1.61 (0.33-7.81) | .55 | 1.77 (0.33-9.65) | .51 |
| 1 | 40/63 (63.5) | 1.45 (0.40-5.28) | .57 | 1.20 (0.25-5.69) | .82 | 1.25 (0.23-6.71) | .79 |
| 2 | 6/11 (54.5) | 1.00 | 1.00 | 1.00 | |||
| NILG risk class | |||||||
| SR | 46/51 (90.2) | 5.64 (2.06-15.44) | .0008 | 3.64 (1.17-11.35) | .02 | ||
| HR | 62/100 (62.0) | 1.00 | 1.00 | ||||
| ELN 2010 risk class† | |||||||
| Favorable | 51/56 (91.1) | 12.11 (3.90-37.65) | <.0001 | 5.90 (1.57-22.18) | .008 | ||
| Intermediate 1 | 24/35 (68.6) | 2.59 (0.98-6.87) | .05 | 1.41 (0.40-4.90) | .59 | ||
| Intermediate 2 | 11/18 (61.1) | 1.87 (0.59-5.94) | .29 | 1.03 (0.25-4.26) | .97 | ||
| Adverse | 16/35 (45.7) | 1.00 | 1.00 | ||||
| Treatment | |||||||
| ICE | 50/82 (61.0) | 1.00 | 1.00 | 1.00 | |||
| sHD | 58/69 (84.1) | 3.38 (1.54-7.38) | .002 | 2.27 (0.90-5.71) | .08 | 2.38 (0.84-6.71) | .10 |
| PBC | |||||||
| <1.5 | 24/55 (43.6) | 1.00 | 1.00 | 1.00 | |||
| ≥1.5 | 84/96 (87.5) | 9.04 (4.04-20.24) | <.0001 | 7.01 (2.91-16.91) | <.0001 | 5.87 (2.22-15.53) | .0004 |
OR, odds ratio.
Two multivariate models including different risk classifications (model with NILG risk excludes factors already considered in the risk construction).
Evaluable patients = 144.

Distribution of PBC values according to ELN categories and response to first induction cycle. The rate of CR decreased from 91% to 46% in parallel with increasing disease risk according to ELN stratification (P < .0001).
Distribution of PBC values according to ELN categories and response to first induction cycle. The rate of CR decreased from 91% to 46% in parallel with increasing disease risk according to ELN stratification (P < .0001).
PBC and survival estimates
A secondary analysis was performed to assess whether PBC results affected the risk of relapse and survival parameters. PBChigh patients experienced significantly better long-term outcomes than did PBClow patients, as indicated by comparative OS and EFS estimates (Figure 3). The postremission impact of a PBChigh or PBClow profile in CR patients was better assessed in DFS and CIR graphs, with a significantly lower risk for relapse and higher DFS rate in the PBChigh group. In subset analyses matching PBC results with treatment arm, PBClow patients from the nonintensive ICE arm had the worst outcome, whereas prognosis was improved without significant differences for PBChigh patients in either induction arm (Figure 4). In multivariate risk models, PBC and ELN or NILG risk scores were the 2 independent factors retaining a significant predictive power for DFS, EFS, CIR, and OS (supplemental File S2.9). In the main clinical trial, we found a strong independent correlation between survival and both HDS induction and allogeneic stem cell transplantation (SCT)15 ; therefore, we compared SCT-related effects in patients with PBChigh or PBClow CR using the Mantel-Byar method and Simon-Makuch plots to correct for pre-SCT events considering SCT as a time-dependent variable. In this analysis of DFS and CIR, the outcome in PBChigh patients was further improved by SCT (n = 32/86); however, the same was not observed in PBClow patients (n = 17/34). Repeating the same tests in HR patients strictly eligible for SCT according to trial design, the results were equally significant, with a greater efficacy of SCT in the PBChigh group and a partial nonsignificant protection from relapse in the PBClow group (supplemental File S2.10).
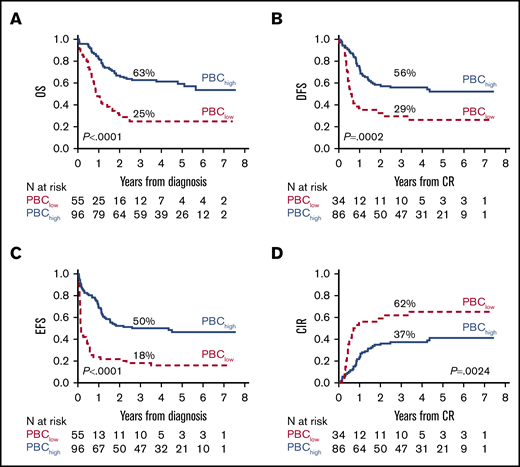
Major outcomes according to PBC-related groups (<1.5 log or ≥1.5 log). (A) OS. (B) DFS. (C) EFS. (D) Cumulative incidence of relapse (CIR).
Major outcomes according to PBC-related groups (<1.5 log or ≥1.5 log). (A) OS. (B) DFS. (C) EFS. (D) Cumulative incidence of relapse (CIR).
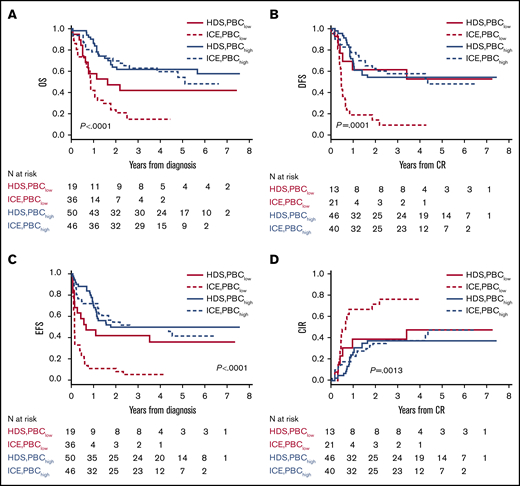
Major outcomes according to PBC-related groups (<1.5 log or ≥1.5 log) and treatment arm (ICE or HDS). (A) OS. (B) DFS. (C) EFS. (D) CIR.
Major outcomes according to PBC-related groups (<1.5 log or ≥1.5 log) and treatment arm (ICE or HDS). (A) OS. (B) DFS. (C) EFS. (D) CIR.
Discussion
For decades, “7+3” chemotherapy (cytarabine plus an anthracycline) has remained the standard initial treatment for non-promyelocytic AML. Indeed, with this regimen, ∼70% of younger patients achieve an initial CR.
Main clinical trials investigating intensified induction demonstrated an increased CR rate after a single course but only showed a clear benefit on survival in subgroups of patients.25-27
Given the heterogeneity of the disease, if applied uniformly, each 1 of these strategies turns out to be inappropriate. Current prognostic stratification drives the therapeutic approach in the post-CR phase, but it generally does not modulate the intensity of induction treatment, particularly in the large heterogeneous category of intermediate cytogenetics.28
The early identification of patients likely to present primary treatment resistance would allow an early shift to more effective therapeutic alternatives. To this end, several lines of evidence support using the early kinetics of blast cell clearance from PB during induction therapy.9-14 To develop a prospective clinical application using such an approach, the 2 major issues of methodology and calculation modality need to be addressed carefully. Among the 3 methods used, morphology,9,10 MFC,11-14 and molecular genetics,29 morphology is the least adequate because of its dependence on operator and scarce standardization, particularly at later time points as a result of worsening cytopenia. By analogy, the place of modern automated cell counters in PBC analysis is yet to be determined. Molecular genetics would offer the highest level of standardization, but the need for genetic probes limits the spectrum of its applicability and, above all, it is time consuming, a major concern for a real-time PBC study. MFC offers the best balance between method standardization and real-time information, and a LAIP-based approach provides high specificity, especially with low blast fraction or monocytic differentiation. With regard to data interpretation, PBC was expressed as time to disappearance/reduction of blasts11 or the normalized ratio between baseline and a predefined time point.12-14 The former approach is less suitable for a prospective multicenter and therapy-oriented trial because the study parameter fluctuates among patients, making study logistics challenging and hampering the consistency of PBC assessment and possible PBC-based interventions.
Using a normalized PBC ratio platform combining diagnostic precision with ease of implementation, our study demonstrated a strong positive correlation among a PBChigh response (>1.5 log by ROC analysis), CR obtained after single-course chemotherapy, and improved outcome with lower relapse risk and better survival. The prognostically favorable PBC-related effect was largely independent of other risk factors and was confirmed by multivariate statistical analysis. With regard to its predictive power, we documented that 84 and 87 of 96 PBChigh patients achieved CR at course 1 (87.5%) or later (90.6%), respectively. The proportions increased to 91.3% and 94.5%, respectively, after the exclusion of 4 patients experiencing induction death during aplasia whose BM was not examined for morphological CR. Thus, the predictive power of the method for CR was close to 95% in fully evaluable patients, with only 8 patients not exhibiting a relationship between PBChigh status and CR. In these patients, we can argue that the selected LAIP was not sufficiently representative of the dominant AML clone, it changed rapidly toward a chemoresistant subclone, and/or there were other unrecognized adverse characteristics (eg, marrow fibrosis); alternatively, it might have reflected a fast kinetic relapse after a transient good PBC response. In these 8 patients we observed a high incidence of secondary disease (supplemental File S2.11), which suggests the influence of a higher clonal heterogeneity in PBC assessment. Tracking leukemic stem cells may provide further insight into actual disease chemosensitivity, as proposed previously.30 In the future, dissecting the clonal heterogeneity of AML with new mass cytometry techniques could improve the sensitivity and predictive power of PBC and MRD studies for clinical use.31 Moreover, in our study, the predictive role of CR in conjunction with a PBChigh profile was validated in all risk subsets defined by genetics/cytogenetics (ELN classification), with different PBC and CR rates reflecting the disease biology. The vast majority (87%) of ELN favorable-risk patients belonged to the PBChigh group, compared with less than half (44.4%) of the ELN adverse-risk patients; the ELN intermediate-risk categories had intermediate PBC behavior (67.3% and 48.1% of ELN intermediate-risk 1 and 2 cases were PBChigh, respectively). The clinical correlation was significant, because the CR rate decreased progressively across the 4 ELN risk categories.
In contrast, the PBClow group exhibited a markedly lower probability of CR (43.6%, P < .0001), especially with a PBC <1.0 (CR 28%), and much higher chemoresistance rates. Although the PBClow profile was not as sensitive a predictor of resistance as PBChigh was for CR, because nearly half of PBClow patients achieved CR, PBClow CR patients had significantly shorter DFS with a higher incidence of relapse. This suggests an interaction between PBClow scores and higher risk stratification (as shown in ELN risk class analysis) and higher residual leukemic burden compared with PBChigh patients, despite morphological CR. Although a postinduction MRD study was not performed in this trial, this correlation was reported by other investigators, which suggests that combining PBC and MRD data may lead to more precise identification of the patients who are at the highest risk of failure within each AML risk subset. Because a significant proportion of PBChigh patients also relapsed, postinduction MRD analysis (with molecular probe or LAIP sensitivity ≥10−4; ie, ≥3 log) should be routinely performed to more accurately define the risk category and to guide treatment choices.32
Another main point of this study was the comparative PBC analysis between the 2 chemotherapy arms of the randomized CR induction trial. The PBC study patients were representative of the entire group of trial patients and, as such, experienced a significantly higher CR rate when allocated to the HDS arm.15 Upon assessing whether the CR induction results correlated positively with PBC scores, we found that median PBC values were significantly higher and that more PBChigh patients were in CR after 1 course of HDS, rather than ICE, chemotherapy (P = .04). This seemed to be related to a more rapid and profound LAIP+ cell depletion induced by high-dose cytarabine.
A weakness of this study was the lack of LAIP reassessment in BM samples examined at the response evaluation and subsequent MRD analysis. These tests were not planned in this study but should be performed in future investigations. The exclusion of patients lacking a suitable LAIP profile from the PBC study was unavoidable, as in other studies, whereas the inclusion of only 31% of 574 total trial patients did not preclude the collection of significant PBC-based clinico-prognostic data according to study arm and AML risk subset among comparable patient series.
The PBC approach is simple and minimally invasive, providing an absolute functional quantification of leukemic burden reduction that is not affected by some variables (ie, overall cellularity, dilution by PB) expected with BM assessment. It allows the early identification of high-risk patients who would potentially benefit from intensification, as demonstrated by the improved outcome provided by HDS induction in the PBC-low subset.
We surmise that an early PBC analysis can contribute to a significant improvement in risk classification, because PBClow patients are actually moved to the high-risk class, thereby adding relevant information to optimize induction therapy in the setting of intervention trials exploring new agents and/or compare established therapeutic options.
This powerful and early prognostic indicator might allow personalization of the therapeutic strategy for AML patients from the very first days of the induction course. In this regard, we are in the process of launching a multicenter trial (Eudract number 2019-003936-21) within the Gruppo Italiano Malattie EMatologiche dell'Adulto cooperative group, in which induction treatment is largely based on results of PBC. In fact, as soon as PBC data predict poor response during standard induction, the patient will be switched to intensified induction with high-dose cytarabine with the aim of increase the proportion of those reaching CR, as well as reducing the toxicity associated with the greater number of courses of treatment needed to achieve CR. Conversely, for patients in whom PBC data predict a good response, standard induction therapy is continued, thus avoiding the extra toxicity associated with generalized upfront use of intensification. Because the therapeutic scenario in AML is rapidly evolving, we believe that this model, which is able to provide an early assessment of chemosensitivity, might be useful to rationalize the introduction of novel targeted agents that are emerging as effective treatment modalities.33-35
Acknowledgments
This work was supported by grants from Ministero della Salute (project title “Peripheral blast clearance analysis during induction treatment in patients with acute myeloid leukemia," Bando ricerca finalizzata 2013, project code GR-2013-02358238) (F.M.), Istituto Toscano Tumori (project code CUP B16D14001140002) (A.B.), and Legato Zottola.
Authorship
Contribution: G.G. and F.M. designed and performed research, analyzed and interpreted the data, and wrote the manuscript; T.I., I.C., F.M., D.F., E.A., and A.M.S. performed research and collected data; C.P. and A.M. analyzed and interpreted data and performed statistical analyses; S.B., M.I.B., D.G., and G.F. performed flow cytometric analysis; A.R. and A.B. interpreted data and critically reviewed the manuscript; and R.B. analyzed and interpreted data and wrote the manuscript.
Conflict-of-interest disclosure: The authors declare no competing financial interests.
Correspondence: Francesco Mannelli, SOD Ematologia, Centro Ricerca e Innovazione Malattie Mieloproliferative, Università di Firenze, AOU Careggi, Largo Brambilla 3, 50134 Florence, Italy; e-mail: francesco.mannelli@unifi.it.

