

Key Points
Axi-cel durable responses were associated with low baseline tumor burden, low systemic inflammation, and high product CCR7+CD45RA+ T cells.
Distinct sets of factors associated with durable response, grade ≥3 cytokine release syndrome, and grade ≥3 neurologic events.

Abstract
ZUMA-1 demonstrated a high rate of durable response and a manageable safety profile with axicabtagene ciloleucel (axi-cel), an anti-CD19 chimeric antigen receptor (CAR) T-cell therapy, in patients with refractory large B-cell lymphoma. As previously reported, prespecified clinical covariates for secondary end point analysis were not clearly predictive of efficacy; these included Eastern Cooperative Oncology Group performance status (0 vs 1), age, disease subtype, disease stage, and International Prognostic Index score. We interrogated covariates included in the statistical analysis plan and an extensive panel of biomarkers according to an expanded translational biomarker plan. Univariable and multivariable analyses indicated that rapid CAR T-cell expansion commensurate with pretreatment tumor burden (influenced by product T-cell fitness), the number of CD8 and CCR7+CD45RA+ T cells infused, and host systemic inflammation, were the most significant determining factors for durable response. Key parameters differentially associated with clinical efficacy and toxicities, with both theoretical and practical implications for optimizing CAR T-cell therapy. This trial was registered at www.clinicaltrials.gov as #NCT02348216.
Introduction
Immunotherapy, especially genetically engineered T-cell therapy, is a revolutionary approach in the fight against advanced-stage cancer.1-3 There are now 2 chimeric antigen receptor (CAR) products approved to treat B-cell malignancies,4-9 1 of which is axicabtagene ciloleucel (axi-cel), an anti-CD19 CAR T-cell product approved for treatment of relapsed or refractory large B-cell lymphoma (LBCL) in the United States and the European Union.4,10
Axi-cel demonstrated high objective and durable response rates in the multicenter ZUMA-1 study in adult refractory LBCL,6 consistent with results from an earlier study that used the same CAR construct.11 Axi-cel was associated with toxicities, most notably cytokine release syndrome (CRS) and neurologic events (NEs), which are well described across this class of therapies.12-14 These toxicities are generally reversible and manageable with supportive therapy, corticosteroids, and interleukin-6R (IL-6R) blockade.7,12,13
Despite high clinical efficacy, approximately 60% of patients do not respond to or relapse within 2 years of treatment with axi-cel or other anti-CD19 CAR T-cell therapies.6,8 Mechanisms associated with durable responses remain incompletely elucidated, and previous correlative analyses have largely focused on toxicity and immune programs associated with CAR T-cell therapy.15-26 Data are limited on mechanisms of treatment resistance, including target antigen loss seen in a subset of responding patients. To date, most published correlative data have been generated in leukemia patients, and limited information has been obtained from large multicenter trials irrespective of the tumor type.
Previous analyses of prespecified clinical covariates, including performance status, age, disease subtype, disease stage, International Prognostic Index score, and cytogenetic status were not clearly predictive of clinical efficacy in ZUMA-1.7,27 Therefore, we initiated this study to analyze biomarker data from ZUMA-1 patients according to an expanded statistical analysis plan for correlates of durable response and parameters differentially associated with efficacy and toxicities. Several strong correlations were revealed.
Methods
Patient samples
Samples from patients in ZUMA-1 were analyzed. The study was approved by the institutional review board at each study site and was conducted in accordance with the Good Clinical Practice guidelines of the International Conference on Harmonization. Safety and efficacy results were previously reported.7 Durable response referred to patients who were in ongoing response at least 1 year after axi-cel infusion. Relapse referred to those patients who achieved a complete or partial response and subsequently experienced disease progression. Patients who achieved stable disease as best response were considered nonresponders.
Quantification of CAR T cells
CAR T cells were quantified using TaqMan quantitative polymerase chain reaction (qPCR; Thermo Fisher Scientific) as described28-31 and confirmed by droplet digital PCR (Bio-Rad Laboratories) according to the manufacturer’s instructions. Unless otherwise noted, results shown use the qPCR method (additional details are provided in the supplemental Methods). A mathematical derivation by which CAR cells were normalized to tumor burden (TB) by dividing peak CAR T-cell levels by TB was used as an indirect proxy for effector:target ratio.
Analysis of biomarkers and clinical covariates
Serum cytokines were analyzed by Simple Plex (Simpleprotein) according to the manufacturer’s instructions or by using Luminex (EMD Millipore) or V-Plex Multiplex assay panels (Meso Scale Discovery) as previously described28 at baseline (before conditioning), on day 0 (axi-cel infusion day), or 1 day after axi-cel infusion, as specified. T-cell phenotype was assessed by CCR7 and CD45RA expression using multicolor flow cytometry with established protocols and antibodies.28 Apheresis samples were presented as a percentage of live CD45+ cells, and product samples were presented as a percentage of live cells.
Lactate dehydrogenase (LDH) was quantified in each site’s clinical laboratory. TB was estimated as the sum of product diameters of up to 6 index lesions per Cheson 2007 criteria32 assessed by a local study site radiologist. Product T-cell fitness was estimated functionally by the global doubling time (DT) of the product cells in culture, the calculation of which is extensively described in supplemental Methods.
Statistical analyses
Covariates and biomarkers from prespecified secondary end points (see supplemental Translational Statistical Analysis Plan) were interrogated for associations with safety, efficacy, and CAR T-cell expansion. Specified covariates were assessed by quartile analysis (ie, divided across 4 groupings of equal quantity or as equal as possible with a given sample size) based on minimum to quartile 1 (Q1), Q1 to median, median to Q3, and Q3 to maximum (supplemental Table 1). For quartile analysis that is presented visually, the P value for logistic regression analysis was provided.
For univariable analyses, Spearman’s rank-order correlation was used to evaluate association between any 2 analytes. Logistic regression was used to evaluate the relationship between covariate and outcome. Kruskal-Wallis and Dunn’s tests were used when 3 or more subgroups were involved in the comparison. P < .05 (not adjusted for multiplicity) was considered a significant association. Multivariable analyses were conducted with key covariates that associated with efficacy, grade ≥3 toxicities, and/or peak CAR T-cell levels after infusion. A set of biological control variables (ie, disease stage, CAR transduction efficiency, total number of infused T cells), which were not associated with these outcomes by univariable analysis, were included in the model as internal controls. Principal component analysis33 was used to generate hierarchical clustering and demonstrate the relationships between covariates. Directionality of association with given clinical outcomes has been analyzed. Random forest analysis34 was used to identify covariates most associated with durable response, grade ≥3 CRS, grade ≥3 NEs, and peak CAR T-cell expansion.
Results
High TB was associated with lower probability of durable response, which could be overcome by commensurate in vivo CAR T-cell expansion
Consistent with previous reports,6 higher peak expansion of CAR T cells in the peripheral blood, specifically estimated as CAR cells per unit of blood volume, was associated with both objective and durable response (Figure 1A; supplemental Figure 1A-D; supplemental Table 2). Cumulative CAR T-cell levels over the first 28 days, measured in blood by area under the curve, were also associated with objective and durable responses (supplemental Figure 1E-H). Levels of CAR T cells at 3 months and beyond were very low or nonmeasurable7 and did not correlate with durable response (Figure 1B).
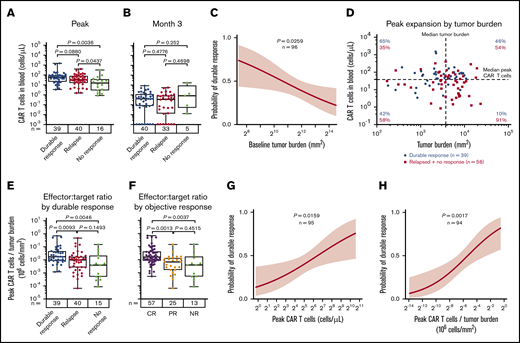
CAR T-cell expansion commensurate with baseline TB is associated with durable responses after axi-cel. Analysis of peak (A) and 3-month CAR T-cell expansion (B) by response status. (C) The association of baseline tumor and probability of durable response was assessed by logistic regression. (D) Scatter plot of baseline TB and peak CAR T-cell levels. (E-F) Analysis of peak CAR T-cell levels normalized to TB by response status. Logistic regression analysis evaluating the association of durable response with peak CAR T-cell levels (G) and peak CAR T-cell levels (H) normalized to TB. P values were calculated using Kruskal-Wallis and Dunn’s tests. CR, complete response; NR, no response; PR partial response.
CAR T-cell expansion commensurate with baseline TB is associated with durable responses after axi-cel. Analysis of peak (A) and 3-month CAR T-cell expansion (B) by response status. (C) The association of baseline tumor and probability of durable response was assessed by logistic regression. (D) Scatter plot of baseline TB and peak CAR T-cell levels. (E-F) Analysis of peak CAR T-cell levels normalized to TB by response status. Logistic regression analysis evaluating the association of durable response with peak CAR T-cell levels (G) and peak CAR T-cell levels (H) normalized to TB. P values were calculated using Kruskal-Wallis and Dunn’s tests. CR, complete response; NR, no response; PR partial response.
We examined baseline TB and CAR T-cell numbers in the peripheral blood after axi-cel infusion in association with the clinical outcome to provide a mathematical derivation that would allow for the assessment of effector:target ratio after CAR T-cell therapy in lymphoma. In ZUMA-1 patients, low TB before CAR T-cell therapy was a strong positive predictor of durable response (Figure 1C). We hypothesized that higher TB as a result of increased CD19 antigen would associate with increased CAR T-cell numbers in the peripheral blood. Although TB was not significantly associated with CAR T-cell expansion, CAR T-cell levels trended positively with TB in patients with durable response (supplemental Figure 1I). In addition, there was a lower durable response rate at comparable peak CAR T-cell levels in patients with higher TB compared with patients who had lower TB (Figure 1D). Notably, durable responders had a higher peak CAR T-cell:TB ratio compared with nonresponders (P = .005) or responders who subsequently relapsed within 1 year after treatment (P = .01; Figure 1E). Similar differences were observed between peak CAR T-cell levels and TB ratio in complete responders compared with partial responders (P = .001) or nonresponders (P = .004; Figure 1F). Finally, there was a significant association between overall peak CAR T cells and those normalized to TB with both durable response rate and objective response rate (Figure 1G-H; supplemental Figure 1J-K). These findings indicate that early expansion commensurate with TB, rather than persistence of functional circulating CAR T cells, is necessary for achieving durable responses in refractory LBCL with an anti-CD19 CAR T-cell therapy containing a CD28 costimulatory domain.
Proinflammatory and myeloid activation markers correlated with impaired in vivo CAR T-cell expansion and decreased rate of durable response
We hypothesized that inflammatory factors associated with high TB may have an impact on CAR T-cell expansion and efficacy. Pretreatment TB was generally associated with an enhanced inflammatory state reflected by IL-6, ferritin, and IL-8, reminiscent of myeloid cell activation, as well as with LDH, indicative of a tumor hypoxic microenvironment (supplemental Figure 2A). However, tumor expression of myeloid- and inflammation-associated biomarkers did not correlate to TB: IL-1A (R = 0.036; P = .84), CD68 (R = 0.13; P = .45), IL-6 (R = −0.02; P = .91), and CD14 (R = 0.04; P = .81).
Pretreatment ferritin, LDH, and IL-6 were not associated directly with in vivo CAR T-cell expansion; however, ferritin and LDH, but not IL-6, were significantly (P < .01) but modestly (R < −0.3) associated with lower CAR T-cell expansion normalized to pretreatment TB (peak CAR T-cell expansion/TB; Figure 2A-2C). Pretreatment increases in LDH and IL-6, but not ferritin, were associated with decreased durable response rates, whereas only baseline IL-6 was associated with decreased objective response (Figure 2D-F; supplemental Figure 2B-G). Similar associations were seen when day 0 or day 1 levels of ferritin and IL-6 were evaluated (supplemental Figures 3 and 4; supplemental Table 3). In addition, there was a weak but significant association between ferritin levels over the first 28 days and peak CAR T-cell levels normalized to TB (R = −0.2236; P = .0277). Significantly higher levels of serum ferritin were observed at most time points after CAR T-cell infusion in patients who relapsed or had no response compared with those who had durable responses (supplemental Figure 5). These data demonstrate that pretreatment TB and systemic inflammation were both negatively associated with the rate of durable responses and that this effect was largely mediated by decreased CAR T-cell expansion relative to the pretreatment TB.
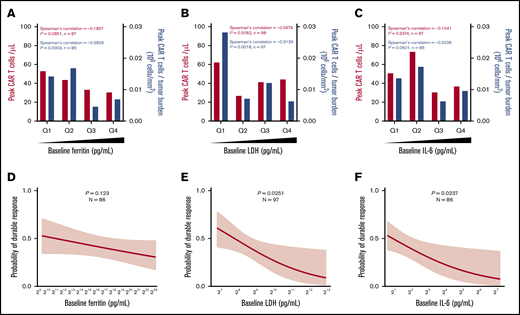
Baseline systemic inflammation is negatively associated with both CAR T-cell expansion relative to pretreatment TB and the rate of durable responses. (A-C) Peak CAR T-cell expansion and peak CAR T-cell expansion normalized to TB were analyzed by quartile (Q) analyses of proinflammatory and myeloid activation markers. (D-F) Logistic regression analysis evaluating the association of durable response with baseline proinflammatory and myeloid activation markers. Bar graphs show medians per quartile, and Spearman’s correlation was used to calculate R and P values for all bar graphs.
Baseline systemic inflammation is negatively associated with both CAR T-cell expansion relative to pretreatment TB and the rate of durable responses. (A-C) Peak CAR T-cell expansion and peak CAR T-cell expansion normalized to TB were analyzed by quartile (Q) analyses of proinflammatory and myeloid activation markers. (D-F) Logistic regression analysis evaluating the association of durable response with baseline proinflammatory and myeloid activation markers. Bar graphs show medians per quartile, and Spearman’s correlation was used to calculate R and P values for all bar graphs.
Product T-cell fitness and dose of CD8 and CCR7+CD45RA+ T cells were associated with response
We sought to determine key CAR T-cell product characteristics associated with improved in vivo expansion and tumor responses. The intrinsic ability of the entire product T-cell population, including CAR T cells, to expand during nonspecific stimulation in vitro (ie, anti-CD3 antibodies in the presence of IL-2 during manufacturing) was characterized by the culture DT. We evaluated product characteristics for association with responses and found that low DT was the product characteristic most significantly associated with objective response compared with nonresponse (supplemental Table 4).
The median DT in responders vs nonresponders was 1.6 vs 2.1 days (P = .0067), and high DT was associated with a lower response rate (Figure 3A; supplemental Figure 6A). DT itself was not associated with durable response; however, there was a correlation between product DT and expansion of CAR T cells in vivo after infusion (Figure 3B-C; supplemental Figure 6A-B). This was mirrored by a similar negative association between DT and peak CAR T cells normalized to TB, as well as between DT and CAR T-cell area under the curve (Figure 3C-D; supplemental Figure 6C).
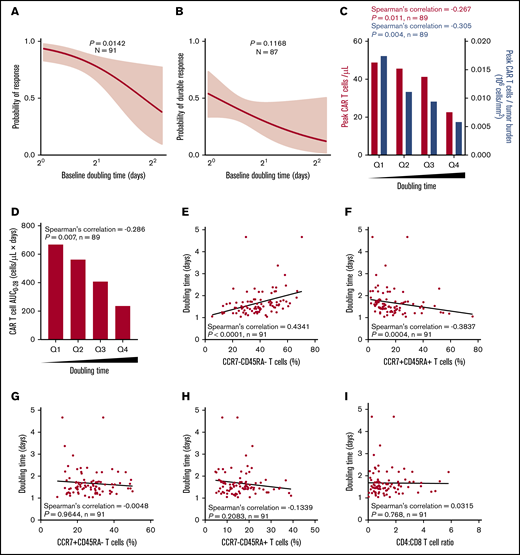
Higher expansion rate of product T cells measured before infusion (doubling time) is associated with greater in vivo CAR T-cell levels and efficacy and correlates with T-cell phenotype. Logistic regression analysis showing association of response (A) or durable response (B) with doubling time. Doubling time by peak CAR T-cell expansion and peak CAR T-cell expansion normalized to TB (C) or by CAR area under the curve (AUC) (D) were analyzed by quartile analyses. Scatter plots show association of doubling time with specified T-cell populations (E-H) and CD4:CD8 ratio (I). Bar graphs show medians per quartile, and Spearman’s correlation was used to calculate R and P values for all bar graphs and scatter plots.
Higher expansion rate of product T cells measured before infusion (doubling time) is associated with greater in vivo CAR T-cell levels and efficacy and correlates with T-cell phenotype. Logistic regression analysis showing association of response (A) or durable response (B) with doubling time. Doubling time by peak CAR T-cell expansion and peak CAR T-cell expansion normalized to TB (C) or by CAR area under the curve (AUC) (D) were analyzed by quartile analyses. Scatter plots show association of doubling time with specified T-cell populations (E-H) and CD4:CD8 ratio (I). Bar graphs show medians per quartile, and Spearman’s correlation was used to calculate R and P values for all bar graphs and scatter plots.
Relative to other product characteristics, DT most strongly associated with the frequency of T-cell differentiation subsets in the final infusion bag. Specifically, DT positively associated with the frequency of CCR7–CD45RA– T cells (R = 0.4341; P < .0001) and negatively associated with the frequency of CCR7+CD45RA+ T cells (R = −0.3837; P = .0004; Figure 3E-H). DT was not associated with the CD4:CD8 ratio (Figure 3I). Together these results suggest that intrinsic product T-cell fitness, as measured by the product DT, is positively associated with a more differentiated product and influences the ability of CAR T cells to expand in vivo to a sufficient effector:target ratio that supports tumor eradication.
We hypothesized that manufacturing DT and product T-cell fitness in general may be a direct result of the differentiation state of patients’ T cells before enrollment. Apheresis T-cell phenotypes were directly associated with the final product phenotype (Figure 4A-C). The phenotype of T cells in the apheresis product associated with DT: greater proportions of CCR7+CD45RA+ T cells consistently associated negatively with product DT (Figure 4D-H; supplemental Figure 7). We also found that TB and baseline ferritin were significantly associated with the differentiation phenotype of the final product (supplemental Figure 8). Altogether, these findings connect product composition and clinical performance to the pretreatment immune status of the patient.
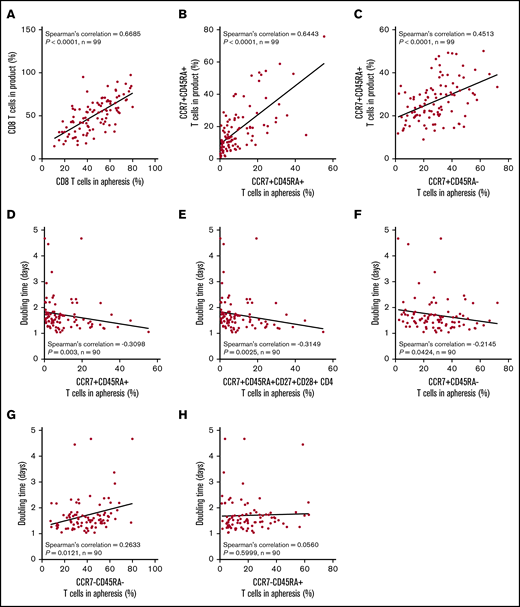
The proportion of T cells with a more juvenile phenotype in the apheresis material directly associates with a lower product doubling time. Association between T-cell phenotypes in apheresis material pre-gated on live CD45+ cells and product phenotype (A-C) or product doubling time (D-H). Spearman’s correlation was used to calculate R and P values.
The proportion of T cells with a more juvenile phenotype in the apheresis material directly associates with a lower product doubling time. Association between T-cell phenotypes in apheresis material pre-gated on live CD45+ cells and product phenotype (A-C) or product doubling time (D-H). Spearman’s correlation was used to calculate R and P values.
To look at the association of product characteristics beyond DT with durable response, we next assessed the number of infused specialized T-cell subsets. The total number of infused CD8 T cells was not statistically associated with response or peak CAR T-cell levels (Figure 5A-C; supplemental Figure 9A-C). Incorporating effector:target ratio, the number of infused CD8 T cells normalized to TB was strongly associated with durable response and expansion of CAR T cells (Figure 5D-F; supplemental Figure 9D-F), and patients in the lowest quartile showed a durable response rate of 16% vs 58% in the top quartile (supplemental Figure 9D). This suggests that higher numbers of product CD8 T cells are needed to establish durable responses in patients with higher TB. Indeed, in patients with high TB, but not patients with low TB, those who achieved durable responses showed a significantly higher number of infused CD8 T cells compared with patients who responded and then relapsed (Figure 5G).
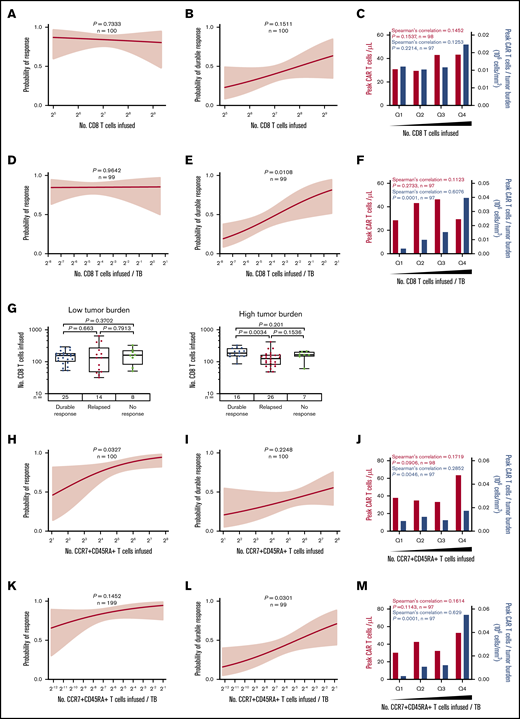
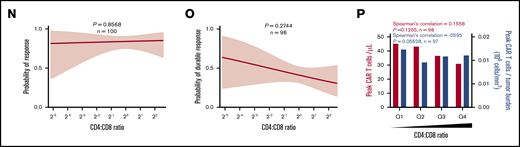
The number of CD8 and CCR7+CD45RA+T cells commensurate with TB is critical to achieving durable response after axi-cel. (A-F) Logistic regression analysis of response (right) and durable response (middle) and quartile analysis of peak CAR T-cell levels and peak CAR T-cell levels normalized to TB (left) by the number of CD8 T cells (A-C) or the number of CD8 T cells normalized to TB (D-F). (G) The number of CD8 T cells among patients with low TB (below median, left) and high TB (above median, right) by response. (H-P) Logistic regression analysis of response (right), durable response (middle), and quartile analysis of peak CAR T-cell levels and peak CAR T-cell levels normalized to TB (left) by the number of CCR7+CD45RA+ T cells (H-J), the number of CCR7+CD45RA+ T cells normalized to TB (K-M), or CD4:CD8 ratio (N-P). P values were calculated using Kruskal-Wallis and Dunn’s tests for box plots. Spearman’s correlation was used to calculate R and P values for bar graphs.
The number of CD8 and CCR7+CD45RA+T cells commensurate with TB is critical to achieving durable response after axi-cel. (A-F) Logistic regression analysis of response (right) and durable response (middle) and quartile analysis of peak CAR T-cell levels and peak CAR T-cell levels normalized to TB (left) by the number of CD8 T cells (A-C) or the number of CD8 T cells normalized to TB (D-F). (G) The number of CD8 T cells among patients with low TB (below median, left) and high TB (above median, right) by response. (H-P) Logistic regression analysis of response (right), durable response (middle), and quartile analysis of peak CAR T-cell levels and peak CAR T-cell levels normalized to TB (left) by the number of CCR7+CD45RA+ T cells (H-J), the number of CCR7+CD45RA+ T cells normalized to TB (K-M), or CD4:CD8 ratio (N-P). P values were calculated using Kruskal-Wallis and Dunn’s tests for box plots. Spearman’s correlation was used to calculate R and P values for bar graphs.
In addition, the number of infused CCR7+CD45RA+ T cells was associated with objective responses and peak CAR T-cell levels (Figure 5H-J; supplemental Figure 9G-I), and a significant association with durable response emerged when the number of infused CCR7+CD45RA+ T cells was normalized to TB (Figure 5K-M; supplemental Figure 9J-L). In contrast, the number of infused cells in other subsets was not associated with peak CAR T-cell levels (supplemental Figures 10A-D and 11A-D; supplemental Table 5). Notably the CD4:CD8 ratio was not associated with peak CAR T-cell levels but was associated with durable response (Figure 5N-P).
On the basis of these findings, we hypothesized that the CCR7+CD45RA+ subset of CD8 product T cells was most responsible for achieving durable response. We performed more detailed subset analyses in all patients with evaluable product samples (n = 45 patients) and found that among CD8 T cells, the number of CCR7+CD45RA+ T cells was most significantly associated with durable response (supplemental Table 6; supplemental Figure 12).
Product T-cell attributes, TB, host inflammatory markers, and treatment-related type 1 T-cell activities are differentially associated with efficacy and toxicities
We next evaluated patient- and product-related markers for their associations with severe toxicities to define actionable targets and approaches to improve the risk-benefit profile of axi-cel. Higher peak CAR T-cell expansion and baseline TB were associated with grade ≥3 NEs but not grade ≥3 CRS (Figure 6; supplemental Figures 13A and 14A). However, there was no significant association between peak CAR T-cell expansion and B-cell aplasia, a known on-target toxicity of anti-CD19 CAR T-cell intervention (supplemental Figure 15). CAR T-cell levels normalized to either pretreatment TB or body weight, DT, and CD8 T cells or CCR7+CD45RA+ CD8 T cells normalized to TB were associated with efficacy but not with severe toxicities (Figure 6B-C; supplemental Figures 13B-D and 14B-C). Increased pretreatment or posttreatment proinflammatory, myeloid-related cytokines, including IL-6, ferritin, and CCL2 as well as LDH, were positively associated with grade ≥3 NEs or CRS (Figure 6D-G; supplemental Figure 16).
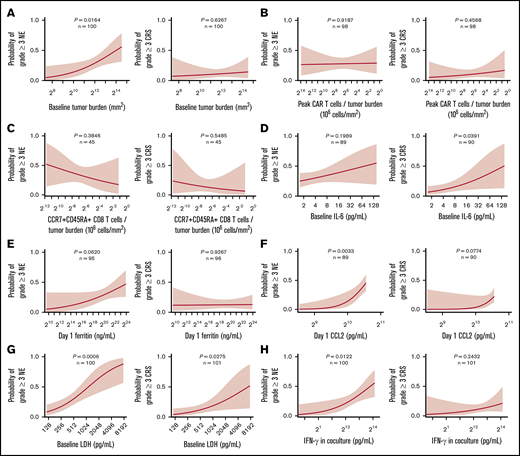
Factors differentially associated with toxicities: TB, inflammatory markers, and key product attributes. Logistic regression analysis of the probability of grade ≥3 NE (left) or CRS (right) and baseline TB (A), the number of peak CAR T-cells normalized to TB (B), the number of CCR7+CD45RA+ CD8 T cells normalized to TB (C), baseline IL-6 (D), day 1 ferritin (E), day 1 CCL2 (F), baseline LDH (G), and IFN-γ (H). P values were calculated using logistic regression.
Factors differentially associated with toxicities: TB, inflammatory markers, and key product attributes. Logistic regression analysis of the probability of grade ≥3 NE (left) or CRS (right) and baseline TB (A), the number of peak CAR T-cells normalized to TB (B), the number of CCR7+CD45RA+ CD8 T cells normalized to TB (C), baseline IL-6 (D), day 1 ferritin (E), day 1 CCL2 (F), baseline LDH (G), and IFN-γ (H). P values were calculated using logistic regression.
We evaluated key features by the number of previous lines of therapy. TB, markers of baseline inflammation, and DT increased with increasing number of lines of therapy, but the proportion and absolute numbers of CCR7+CD45RA+ cells decreased (supplemental Table 7). These findings support the observation that efficacy decreases and toxicity increases with increasing number of lines of previous therapy.35
We also systematically analyzed other routinely measured product attributes for their differential association with efficacy and toxicity. Notably, interferon-γ (IFN-γ) secretion of the final product after coculture with CD19-expressing targets positively associated with grade ≥3 NEs but not efficacy or grade ≥3 CRS in ZUMA-1 (Figure 6H; supplemental Figure 13F). There was a weak, direct association between product coculture IFN-γ and the proportion of differentiated CCR7– T cells in the infusion bag and product DT (supplemental Figure 17). Furthermore, serum levels of IFN-γ, CXCL10, and IL-15, measured early after treatment also associated positively with grade ≥3 NEs but were not associated with durable response (supplemental Figure 18A-C). We also found that day 0 IL-15 serum levels significantly associated with day 1 IFN-γ serum levels rather than product coculture IFN-γ (supplemental Figure 18D). Additional product release criteria were not associated with efficacy or toxicity (supplemental Table 8). Altogether, these findings point to product attributes and inflammatory biomarkers that associated differentially with efficacy and toxicities after treatment with axi-cel.
We performed a hierarchical clustering and random forest multivariable analysis to further evaluate the univariable analysis findings. Overall, random forest analysis confirmed the main findings by univariable analysis and pointed to several parameters that associate differentially with response and toxicities, namely baseline TB, IL-6, C-reactive protein, and LDH; day 0 IL-15; and coculture interferon-γ (Figure 7; supplemental Table 9). These findings were supported by multivariable analysis that evaluated covariates differentially associated with CAR T-cell expansion (supplemental Table 9; supplemental Figure 19).
![TB, LDH, and pro-inflammatory markers measured before CAR T-cell infusion associate differentially with clinical outcomes in multivariable analysis. (A) Cluster analysis summarizing the strength of association between covariates from the 2 major categories: product attributes and pretreatment tumor/inflammatory markers. (B-D) Top covariates differentially associated with efficacy and NEs (B), efficacy and CRS (C), and NEs and CRS (D) by random forest analysis (n = 97-101 patients per parameter [supplemental Table 9]). (E) Summary of multivariable findings. CRP, C-reactive protein.](https://ash.silverchair-cdn.com/ash/content_public/journal/bloodadvances/4/19/10.1182_bloodadvances.2020002394/2/m_advancesadv2020002394f7.png?Expires=1769079158&Signature=ly3hOKbaHf9K9TAWsAyb~sINkUrbiKTwtKVdrdFUQhNh~u-9VghLm1KNqSI9QMZy5MYs9YU8lLIAmYA0Va-D55oGVKd-nJPcPpotFzDkuoq6tPzEKILRNfb~CAK4t6vHqIYdQdVLGZeBAlkLAKiuvvfKHaUOynahrVlhubIp5f6dYzbMc3Hb2wTG9G1REnH-0sjwliJrJXdayRuhLcbj8PSjFDIoYgCX0Uv8rfnPsoOj9WkFmEcw7VU0tqkkYgPRLf7NQoRpBe3qllxkIxgMktkfcdXjbS9zhcs1SB05Zva9qUwQHYDz7iQdFSAaYp20K4wT4Zcu7QTovFfFpYffTw__&Key-Pair-Id=APKAIE5G5CRDK6RD3PGA)
TB, LDH, and pro-inflammatory markers measured before CAR T-cell infusion associate differentially with clinical outcomes in multivariable analysis. (A) Cluster analysis summarizing the strength of association between covariates from the 2 major categories: product attributes and pretreatment tumor/inflammatory markers. (B-D) Top covariates differentially associated with efficacy and NEs (B), efficacy and CRS (C), and NEs and CRS (D) by random forest analysis (n = 97-101 patients per parameter [supplemental Table 9]). (E) Summary of multivariable findings. CRP, C-reactive protein.
TB, LDH, and pro-inflammatory markers measured before CAR T-cell infusion associate differentially with clinical outcomes in multivariable analysis. (A) Cluster analysis summarizing the strength of association between covariates from the 2 major categories: product attributes and pretreatment tumor/inflammatory markers. (B-D) Top covariates differentially associated with efficacy and NEs (B), efficacy and CRS (C), and NEs and CRS (D) by random forest analysis (n = 97-101 patients per parameter [supplemental Table 9]). (E) Summary of multivariable findings. CRP, C-reactive protein.
Discussion
To elucidate factors that govern the clinical performance of CAR T-cell therapy, we performed extensive analyses of prespecified covariates and biospecimens collected during the ZUMA-1 study of axi-cel in LBCL. Most prespecified covariates, including routine lymphoma prognostic markers, were not predictive for clinical outcomes. The most significant determining factors for durable response were in vivo CAR T-cell expansion commensurate with pretreatment TB and influenced by intrinsic product T-cell fitness, dose of specialized T-cell subsets, and host systemic inflammation.
Suboptimal product T-cell fitness was a major factor related to primary treatment resistance, and limited numbers of CCR7+CD45RA+ or CD8 T cells in proportion to TB were associated with a failure to achieve durable response. Although numbers of CD4 T cells did not significantly associate with durable response, these results do not preclude the overall importance of CD4 T cells in CAR T-cell therapy because a specialized subset of polyfunctional CD4 T cells has been identified that correlates with clinical response.22 In addition, high TB, pronounced inflammatory status (reflected by myeloid activation markers before and after CAR T-cell infusion), and excess type 1 cytokines associated negatively with durable efficacy and positively with severe toxicities.
In this study, the strongest correlate of durable response was peak CAR T-cell levels in blood normalized to pretreatment TB. This index was positively associated with durable response rate, and it separated subsets of patients with high (∼60%) vs low (∼10%) probability of achieving a durable response. Our data also highlight the value of estimating number of CAR cells per unit of blood volume, because in our study, it was a more informative pharmacokinetic measurement compared with the number of CAR gene copies per microgram of host DNA typically reported in other studies, and also reported here. Ongoing efforts to harmonize reporting methods are warranted. The number of CAR T cells in peripheral blood early (within 2 weeks) after infusion were associated with clinical efficacy. However, CAR levels at later points were not significantly associated with durable efficacy, concordant with another recent report with a different CAR product in the same tumor type.36 We previously demonstrated that most responders show profound tumor regression at the first assessment (28 days), that levels of the immune effector molecule granzyme B peak within 5 days postinfusion,28 and that normal B cells recover gradually in durable responders.6 Our results here, taken together with previous findings, suggest that the window for axi-cel anti-tumor activity in LBCL likely occurs within the first weeks after infusion. These findings are consistent with the hypothesis that axi-cel may act rapidly against LBCL tumors, through early activation and expansion of CAR T cells with 2 weeks after treatment and driven by CCR7+CD45RA+ T cells in the product infusion bag; persisting CAR T cells are not needed to achieve and maintain durable clinical response.6,7,31
Higher numbers of CAR T cells in the peripheral blood were associated with DT, which underscores the importance of intrinsic T-cell fitness independent of the CAR construct. Diminished product T-cell fitness (ie, high DT) was associated with primary treatment resistance because most nonresponding patients showed a product DT >1.6 days. We demonstrate that the higher the frequency of CCR7+CD45RA+ T cells in the product infusion bag, the higher the product T-cell fitness, because the frequency of CCR7+CD45RA+ T cells was negatively associated with DT. Recently, we reported that the majority of CCR7+CD45RA+ T cells in the axi-cel product infusion bag are stem-like memory cells, not canonical naïve T cells.37 This aligns with our observation that the subpopulation that best associated with DT was CCR7+CD45RA+CD27+CD28+ T cells, noting that such specialized T-cell subsets have been previously described and linked with product T-cell performance.38-41 Our findings also corroborate with preclinical data pointing to CCR7+CD45RA+ cells as drivers of anti-tumor activity in the context of T-cell intervention.42,43 That CCR7+CD45RA+ T cells from peripheral blood can differentiate in vitro into stem-like memory cells, both of which express CCR7 and CD45RA,43,44 provides a biological link for our observations that CCR7+CD45RA+ T cells in both the apheresis material and the product associate with DT and outcomes.43 Furthermore, we demonstrated that rather than the total number of product T cells or CAR T cells, it was the total number of specialized T cells normalized to pretreatment TB that associated best with clinical efficacy. In addition, the frequency of CCR7+CD45RA– T cells in the product infusion bag associated inversely with DT, a result that is concordant with the view that this subset may drive T-cell product performance.45
Besides product attributes linked to T-cell fitness and dose of specialized T cells, we also found that markers related to TB and inflammation, both of which may be influenced by the underlying tumor biology, were highly associated with clinical outcomes. Pretreatment serum levels of LDH and proinflammatory markers, including IL-6 and ferritin, were prominently and negatively associated with clinical efficacy and were positively but weakly associated with TB. Concordantly, patients with low TB and diminished tissue hypoxia and inflammation markers demonstrated a high durable response rate (>60%) and limited rate of inflammation-driven serious adverse events (CRS and neurotoxicity; <10%). Evidence of excessive activation and mobilization of myeloid cells in the context of CAR T-cell therapy has also been generated in preclinical models.46-48 Our univariable and multivariable analyses of patient data indicate that tumor hypoxia and an enhanced proinflammatory state reminiscent of myeloid cell hyperactivity might inhibit the activation, expansion, and/or survival of CAR T cells within the tumor microenvironment, while simultaneously contributing to toxicities, possibly through facilitating excess cytokine production.
On the basis of these findings, we suggest several strategies for increasing efficacy without exacerbating the toxicity profile of axi-cel: (1) systematic evaluation of bridging therapy agents (which were not allowed in ZUMA-1) to curb TB and inflammation before CAR T-cell infusion; (2) testing of agents that modulate effects on myeloid cells or low-dose corticosteroids administered immediately before or after CAR T-cell infusion; (3) optimization of CAR configuration to eliminate excess production of myeloid and type 1 molecules by the product cells; (4) dosing or process optimizations to increase both the percentage and number of product CCR7+CD45RA+ and CD8 T cells, especially in the context of bulky disease; and (5) improving T-cell fitness through optimizing product T-cell metabolism or combining with immune checkpoint modulators.
This study builds extensively on earlier findings with key product attributes and patient and tumor characteristics.6,8,9,19,49 To our knowledge, this represents the most extensive covariate analysis of its kind: several variables were examined on a relatively large uniform patient population treated with a specific CAR T-cell therapy with extended follow-up. Although previously published reports were limited in terms of total number of patients, breadth of categories of covariates analyzed, and clinical follow-up, they also pointed to CAR T-cell expansion and associated factors as major determinants of clinical efficacy for this therapeutic modality in lymphoma.8,9,49 A recent report with a different CAR product in LBCL similarly assessed associations between CAR kinetics, durable response, and toxicities.36 Our study expands upon those findings with a more detailed product and biomarker analysis and a larger proportion of durable responders, and for the first time, it reports associations between product T-cell fitness, phenotypes, dose of specialized T cells, and clinical outcomes. We propose that achieving durable response requires CAR T-cell expansion within each patient that is commensurate with that patient’s TB, and that to achieve this is specifically attributable to the frequency of CCR7+CD45RA+CD8+ CAR T cells in the product infusion bag. Insufficient expansion in proportion to TB may allow for minimal residual malignancy above or below levels of detection and may lead to a partial response or an apparent complete response before relapse as a result of tumor outgrowth. Another mechanism of transient remission is ascribable to CD19-related evasion through selection of tumor cells that lack the axi-cel target, and ongoing studies indicate that this may occur in about 25% to 33% of the treated patients who have an objective response. This hypothesis also aligns with our observation that patient-related characteristics and product characteristics associate differentially with response and toxicities.
When interpreting these results, several study limitations must be considered: (1) this analysis did not characterize other potential mechanisms of treatment resistance under evaluation, such as tumor immune microenvironment–mediated suppression,50-52 escape with target-negative variants,53 or product immunogenicity54 ; (2) patients in ZUMA-1 may not entirely represent patients treated with standard-of-care axi-cel because of differences in eligibility criteria and toxicity management55 ; (3) the multivariable evaluation used here was deliberately limited in scope, using random forest analysis primarily directed at validating and comparing the impact of the biological covariates identified in univariable analysis; (4) the study was not designed to evaluate adverse event management strategies because treatment guidelines evolved throughout the course of ZUMA-1, adverse event management was ultimately at the discretion of the physician, and ZUMA-1 did not assess the impact of concomitant medications, which are often administered before the first measurement of CAR T-cell expansion described here; (5) NEs in ZUMA-1 were graded according to Common Terminology Criteria for Adverse Events version 4, but a consensus grading system for neurotoxicity was recently developed56 that may complicate extrapolating these data to future patients; and (6) because of the time-consuming nature of the extensive biomarker analyses, follow-up was limited to 1 year after CAR T-cell therapy for all patients, although we anticipate that later clinical follow-up would provide consistent results with those presented here, given the durability of responses between 1 and 2 years and that no patients had new CRS or NEs.6
Future studies should evaluate the impact of these categories of factors in broader patient populations and tumor types. Novel approaches, including product optimization and combination strategies, should be prospectively tested in clinical trials aimed at safely improving durable remissions.
See supplemental Methods for Gilead’s data sharing policy.
Acknowledgments
The authors thank Jinghui Dong of Kite (a Gilead company) for assistance with the statistical analysis.
This study was funded by Kite, and medical writing support was provided Skye Geherin (Nexus Global Group Science, Chicago, IL), funded by Kite.
Authorship
Contribution: F.L.L., J.M.R., A.X., and A.B. designed the study; F.L.L., S.S.N., C.A.J., D.B.M., A.G., O.O.O., P.M.R., L.J.L., and Y.L. enrolled and treated patients and gathered data; and all authors participated in the analysis and interpretation of the data, writing the manuscript, and approval of the final submitted version.
Conflict-of-interest disclosure: F.L.L. reports scientific advisory roles for Novartis, Celgene/Bristol-Myers Squibb, Kite/Gilead, GammaDelta Therapeutics, Calibr, Amgen, Wugen, and Allogene; consultant with grant options for Cellular Biomedicine Group, Inc.; and research funding from Kite/Gilead. J.M.R. and A.X. report employment with Kite (a Gilead Company) and stock or other ownership in Gilead Sciences. S.S.N. reports personal fees from Kite, Merck, Bristol-Myers Squibb, Novartis, Celgene, Pfizer, Allogene Therapeutics, Cell Medica/Kuur, Incyte, Precision Biosciences, Legend Biotech, Adicet Bio, Calibr, and Unum Therapeutics; research support from Kite, Bristol-Myers Squibb, Merck, Poseida, Cellectis, Celgene, Karus Therapeutics, Unum Therapeutics, Allogene Therapeutics, Precision Biosciences, and Acerta; royalties from Takeda Pharmaceuticals; and intellectual property related to cell therapy. C.A.J. reports honoraria from Kite, Novartis, Celgene, BMS, Precision Biosciences, Nkarta, and Lonza; consultancy or advisory role for Kite, Novartis, Celgene, BMS, Precision Biosciences, Nkarta, and Lonza; speakers' bureau participation for AXIS and Clinical Care Options; research funding from Pfizer; and travel support from Kite, Novartis, BMS, Celgene, Precision Biosciences, Nikarta, and Lonza. D.B.M. reports consultancy or advisory roles for Kite, Novartis, Celgene, Juno, Bristol-Myers Squibb, Adaptive Biotechnologies, Pharmacyclics, and Janssen; research funding from Kite, Novartis, Celgene, Juno, Bristol-Myers Squibb, Adaptive Biotechnologies, and Pharmacyclics; patents, royalties, or other intellectual property from Pharmacyclics; and travel support from Kite, Novartis, Juno, Celgene, Bristol-Myers Squibb, Adaptive Biotechnologies, Pharmacyclics, and Janssen. A.G. reports consulting or advisory roles with Kite, Amgen, Atara, Wugen, and Celgene and honoraria from Kite. O.O.O. reports honoraria from Kite; consultancy or advisory role for Kite, Pfizer, Spectrum Pharmaceuticals, and Bayer; and research funding from Kite. P.M.R. reports consultancy or advisory roles for Kite, and Curis and has received research funding from Seattle Genetics. Y.L. reports a consultancy or advisory role for Janssen, Celgene, Bluebird Bio, Legend, Sorrento, Gamida Cells, Vineti, Novartis, Kite, and Juno Therapeutics and has received research funding from Janssen, Celgene, Bluebird Bio, Merck, Kite, and Takeda. M.S. reports employment with Kite and stock or other ownership in Gilead Sciences. M.B. reports previous employment at Kite, stock or other ownership in Gilead Sciences, and consultancy or advisory role for various confidential companies. W.Y.G. reports previous employment with Kite and current employment with A2 Biotherapeutics and stock or other ownership in Gilead Sciences and A2 Biotherapeutics. J.S.W. reports previous employment at, travel, accommodations, and expenses from, and patents, royalties, and other intellectual property with Kite, and stock or other ownership in Gilead Sciences. A.B. reports employment with Gilead Sciences, stock or other ownership in Gilead Sciences and Kite, and consultancy or advisory role for Gilead Sciences; and travel support from Gilead Sciences. L.J.L. declares no competing financial interests.
Correspondence: Frederick L. Locke, Moffitt Cancer Center, 12902 Magnolia Dr, Tampa, FL 33612; e-mail: frederick.locke@moffitt.org.

