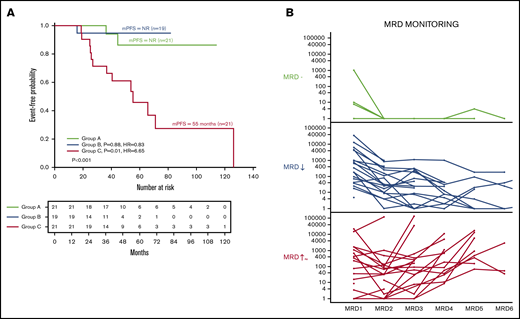
The color coding for Figure 2 on page 3299 was incorrect. The corrected Figure 2 is shown below. The error has been corrected in the published article.
MRD dynamics and its impact on PFS. (A) Kaplan-Meier curves for PFS in patients classified according to dynamics of response: group A, patients with 3 or greater MRD-negative assessments (n = 21); group B, patients with continuously declining detectable clones in success time points (n = 19); and group C, patients with stable number of clones (n = 21). (B) MRD evolution for each individual patient by MRD dynamics.
MRD dynamics and its impact on PFS. (A) Kaplan-Meier curves for PFS in patients classified according to dynamics of response: group A, patients with 3 or greater MRD-negative assessments (n = 21); group B, patients with continuously declining detectable clones in success time points (n = 19); and group C, patients with stable number of clones (n = 21). (B) MRD evolution for each individual patient by MRD dynamics.

