

Abstract
Pulmonary embolism (PE) is a common, potentially life-threatening yet treatable condition. Prompt diagnosis and expeditious therapeutic intervention is of paramount importance for optimal patient management. Our objective was to systematically review the accuracy of D-dimer assay, compression ultrasonography (CUS), computed tomography pulmonary angiography (CTPA), and ventilation-perfusion (V/Q) scanning for the diagnosis of suspected first and recurrent PE. We searched Cochrane Central, MEDLINE, and EMBASE for eligible studies, reference lists of relevant reviews, registered trials, and relevant conference proceedings. 2 investigators screened and abstracted data. Risk of bias was assessed using Quality Assessment of Diagnostic Accuracy Studies-2 and certainty of evidence using the Grading of Recommendations Assessment, Development and Evaluation framework. We pooled estimates of sensitivity and specificity. The review included 61 studies. The pooled estimates for D-dimer sensitivity and specificity were 0.97 (95% confidence interval [CI], 0.96-0.98) and 0.41 (95% CI, 0.36-0.46) respectively, whereas CTPA sensitivity and specificity were 0.94 (95% CI, 0.89-0.97) and 0.98 (95% CI, 0.97-0.99), respectively, and CUS sensitivity and specificity were 0.49 (95% CI, 0.31-0.66) and 0.96 (95% CI, 0.95-0.98), respectively. Three variations of pooled estimates for sensitivity and specificity of V/Q scan were carried out, based on interpretation of test results. D-dimer had the highest sensitivity when compared with imaging. CTPA and V/Q scans (high probability scan as a positive and low/non-diagnostic/normal scan as negative) both had the highest specificity. This systematic review was registered on PROSPERO as CRD42018084669.
Introduction
Pulmonary embolism (PE) is a common, potentially life-threatening yet treatable condition.1-7 The annual incidence of PE is 60 to 70 cases per 100 000. In the United States and Europe, PE accounts for 100 000 and 300 000 annual deaths, respectively.8-10 Consequently, prompt diagnosis and expeditious therapeutic intervention is of paramount importance for optimal patient management.11
Excluding PE is also of paramount importance because of the bleeding risks of anticoagulation and costs associated with treatment and monitoring. Various strategies are currently used to evaluate patients with suspected PE. Commonly used tests include D-dimer assays, compression ultrasonography (CUS), computed tomography pulmonary angiography (CTPA), and ventilation-perfusion (V/Q) scanning. The tests each have benefits and limitations. Imaging tests for PE such as CTPA and V/Q lung scanning are expensive, time-consuming, and are associated with radiation exposure. In addition, the contrast used in CTPA can cause nephrotoxicity and allergic-like reactions. Therefore, to exclude PE efficiently, patients undergo initial tests that are cost-effective with low risk; tests such as CTPA and V/Q are reserved for patients in whom PE was not initially excluded.12
The aim of this systematic review is to determine the accuracy of commonly available diagnostic tests for PE, which can be used to inform a combined strategy for diagnosis. Pooled estimates of sensitivity and specificity obtained in this systematic review were used to model different diagnostic strategies for patients with suspected PE. The results of modeling were used to inform evidence-based recommendations on diagnostic strategies for deep vein thrombosis (DVT) in the American Society of Hematology clinical practice guidelines for diagnosis of venous thromboembolism.13
Methods
Search strategy and data sources
We searched MEDLINE, EMBASE, and the Cochrane Central Register of Controlled Trials from inception until May 2019. We also manually searched the reference lists of relevant articles and existing reviews. Studies published in any language were included in this review. We limited the search to studies reporting data for accuracy of diagnostic tests. The complete search strategy is available in supplemental Material 1. The prespecified protocol for this review is registered on PROSPERO (registration number CRD42018084669). This review is reported in accordance with Preferred Reporting Items for Systematic Reviews and Meta-Analyses for diagnostic test accuracy guidelines.13
Study selection
Studies.
Studies reporting data on diagnostic test accuracy (randomized control trials, cohort studies, cross-sectional studies) for PE were eligible for inclusion in this systematic review.
Participants.
Adult patients ≥18 years of age, presenting to inpatient or outpatient settings with suspected first or recurrent episode of PE were eligible for inclusion
Index tests for diagnosis.
Studies assessing test accuracy of V/Q scan, multidetector CTPA, CUS, and D-dimer assays at standard cutoffs (Vidas ELISA Assay at 500 ng/mL, STA Liatest D-Di Assay at 500 ng/mL, Tina-quant D-dimer Assay at 500 ng/mL, Innovance D-dimer at 500 ng/mL, and HemoSIL D-dimer Assay at 230 ng/mL) to diagnose a first or recurrent episode of symptomatic PE.
Reference standards.
Angiography, positive lower extremity ultrasound for DVT in the setting of suspicion for PE, and/or clinical follow-up were eligible as a reference standard for V/Q scan or CTPA. V/Q scan, CTPA, compression ultrasound for DVT in the setting of suspicion for PE, and/or clinical follow-up were considered appropriate reference standards for D-dimer assays. If a reference diagnostic test was not conducted, clinical follow-up for symptoms alone was sufficient as a reference standard.
Exclusion criteria.
Exclusion criteria was determined by unanimous guideline panel consensus. We excluded studies that did not provide sufficient data to determine test accuracy (sensitivity and specificity) and abstracts published before 2014 because the complete studies were likely published in peer-reviewed journals. Studies with sample size <100 patients were excluded to increase feasibility. A sensitivity analysis was performed and indicated that this would not affect the pooled test accuracy estimates. The quality of small test accuracy studies informing a clinical practice guideline was a concern; therefore, these studies were excluded.
Patients that were asymptomatic and pregnant were excluded. Studies reporting on both adult and pediatric patients were eligible for inclusion but were excluded when >80% of the study sample was younger than 18 years of age or if the mean age was younger than 25 years. When possible, we extracted data separately for adult patients from these studies.
Studies that used unsuitable reference standards were excluded (V/Q single-photon emission CT, transthoracic ultrasound, single-detector CT, impedance plethysmography, and D-dimer). D-dimer studies were excluded if they used assays that are no longer in use and/or are not highly sensitive (MDA, Asserachrom, Dimertest I, Enzygnost, Fibrinostika FbDP, Acculot, Wellcotest, Minutex), if they used a nonquantitative assay (SimpliRed), or if they considered a positive threshold other than the defined clinical cutoffs.
We excluded studies evaluating V/Q test accuracy that were published before the year 2000 unless it included a screening process with chest radiograph or other testing before V/Q testing. Finally, we excluded studies that did not provide a breakdown of the V/Q scan interpretation (normal, low/intermediate, and high probability).
Screening and data extraction
Independent reviewers conducted title and abstract screening and full-text review in duplicate to identify eligible studies. Data extraction was also conducted independently and in duplicate and verified by a third author (R.M.). Disagreements were resolved by discussion to reach consensus, in consultation with 2 expert clinician scientists (R.M. and W.L.). Data extracted included general study characteristics (authors, publication year, country, study design), diagnostic index test and reference standard, prevalence of PE, and parameters to determine test accuracy (ie, sensitivity and specificity of the index test).
Risk of bias and certainty of evidence
We conducted the risk of bias assessment for diagnostic test accuracy studies using the Quality Assessment of Diagnostic Accuracy Studies-2 revised tool.14
The Grading of Recommendations Assessment, Development and Evaluation (GRADE) framework was used to assess overall certainty by evaluating the evidence for each outcome on the following domains: risk of bias, imprecision, inconsistency, indirectness, and publication bias.15,16
Data synthesis
The accuracy estimates from individual studies were combined quantitatively (pooled) for each test using OpenMetaAnalyst (http://www.cebm.brown.edu/openmeta/). We conducted a bivariate analysis for pooling sensitivity and specificity for each of the test comparisons to account for variation within and between studies. Forest plots were created for each comparison. The Breslow-Day test was used to measure the percentage of total variation across studies because of heterogeneity; however, the results did not influence our judgment of the pooled estimates because the literature has discouraged its use for test accuracy.17 To better illustrate the impact of the sensitivity and specificity, absolute differences in effects were calculated for each comparison as true positives, true negatives, false positives, and false negatives.
Diagnostic strategies for PE are based on assessment of the pretest probability (PTP) for individual patients, which provides an estimate of the expected prevalence of PE at a population level. Prevalence estimates for PE were obtained from a meta-analysis of 29 studies of 31 215 patients in which the 3-level Wells score was evaluated in 14 studies.18 The pooled prevalence of PE in these studies was 5.7% in the low PTP, 23.2% in the intermediate PTP, and 49.3% in the high PTP category. We used similar disease prevalence estimates to determine the absolute differences in effects among patients with clinical suspicion of PE: 5% corresponding approximately to low PTP, 20% for intermediate PTP, and 50% and 75% for high PTP. The review also discusses recurrent PE for which the prevalence was modeled at 30% and 40%. We calculated the absolute differences in effects for each comparison as true positives, true negatives, false positives, and false negatives. Here, we present the results for the low PTP population; results for intermediate and high PTP groups are reported in supplemental Material 2.
Results
Description of studies
Among the 15 453 nonduplicate records identified from the initial electronic database search and from other sources, 355 articles in full text were retrieved after title and abstract screening. An updated search of the electronic database was performed with 1391 nonduplicate records identified. Of these, 21 articles in full text were retrieved after title and abstract screening. After exclusion of articles, a total of 61 studies were included for data abstraction. A list of excluded studies is provided in supplemental Material 3. Reasons for exclusion at full-text review or data abstraction stages were ineligible study design (n = 67), study population (n = 45), diagnostic test (n = 46), full text not available (n = 19), or unacceptable reference standards and/or studies did not provide enough information to determine sensitivity and specificity (n = 139). Figure 1 shows the study flow diagram for included studies.
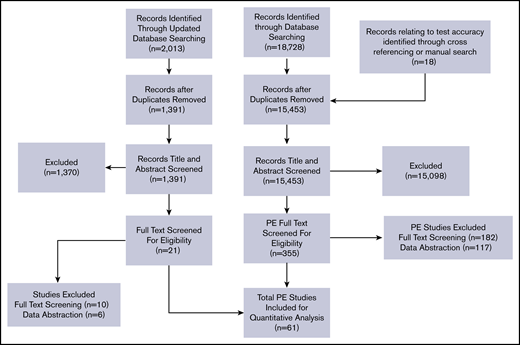
Preferred Reporting Items for Systematic Reviews and Meta-Analyses flow diagram for study selection.
Preferred Reporting Items for Systematic Reviews and Meta-Analyses flow diagram for study selection.
First-episode PE studies reported the test accuracy of the following index tests in comparison with a reference standard: 34 studies on D-dimer,19-52 1 study on age-adjusted D-dimer,43 16 studies on CTPA,26,28,35,38,42,43,53-62 7 studies on compression ultrasound,42,63-68 and 13 studies V/Q scan.26,53,57,67-76 Recurrent PE studies reported test accuracy from 3 studies.77-79 Table 1 summarizes general characteristics of included studies, as well the index and reference standards. The majority of included studies were judged to be low risk of bias for patient selection, index test, and reference standard interpretation. Although there was unclear reporting regarding flow and timing in some studies, the certainty of evidence was generally not downgraded for risk of bias. The complete risk of bias assessment for individual studies is included in supplemental Material 4.
Summary of included studies for the diagnosis of suspected pulmonary embolism
| Study author, year (reference) | Population | Clinical setting | Index test | Reference standard |
|---|---|---|---|---|
| 1. Abcarian et al, 2004 (19) | Patients with suspected PE | Inpatient and outpatient | D-dimer | Pulmonary CT angiography |
| 2. Anderson et al, 2007 (53) | Patients with suspected PE | Inpatient and outpatient | Pulmonary CT angiography | V/Q scan |
| 3. Bajc et al, 2002 (54) | Patients with suspected PE | Inpatient and outpatient | V/Q scan and helical computed tomography (CT) | V/Q scan and helical CT |
| 4. Blachere et al, 2000 (69) | Patients with suspected PE | Inpatient | Helical CT angiography, V/Q scan | Doppler sonography of the veins of the legs |
| Pulmonary angiography | ||||
| 5. Bounameaux et al, 1991 (70) | Patients with suspected PE | Inpatient and outpatient | V/Q scan | CTPA |
| 6. Bosson et al, 2005 (20) | Patients with suspected PE | Inpatient and outpatient | D-dimer | Doppler sonography of the veins of the legs |
| V/Q scan | ||||
| HCT | ||||
| Pulmonary angiography | ||||
| 7. Crane et al, 2018 (49) | Patients with suspected PE | Emergency department | D-dimer | CTPA |
| V/Q scan | ||||
| CUS | ||||
| 8. de Monyé et al, 2002 (22) | Patients with suspected PE | Inpatient and outpatient | D-dimer | CTPA |
| V/Q scan | ||||
| CUS | ||||
| 9. den Exter et al, 2013 (23) | Patients with suspected PE | Inpatient and outpatient | D-dimer | CTPA |
| 10. Di Nisio et al, 2005 (24) | Cancer patients with suspected PE | Inpatient and outpatient | D-dimer | Normal spiral CT scan and normal ultrasonography, or spiral CT or pulmonary angiography V/Q scan |
| 11. Dunn et al, 2002 (25) | Patients with suspected PE | Outpatient | D-dimer | V/Q scan, chest CT, or pulmonary angiography |
| 12. Elias et al, 2004 (26) | Patients with suspected PE | Inpatients and outpatients | Lower limb venous ultrasound | V/Q scan |
| D-dimer | ||||
| CT scan | ||||
| 13. Emet et al, 2007 (27) | Patient with prediagnosed PE | Outpatient | CT pulmonary angiogram | V/Q scan |
| D-dimer | ||||
| 14. Eng et al, 2009 (28) | Patients with suspected PE | Inpatient | D-dimer | CTPA |
| 15. Freitas et al, 1995 (71) | Patients with suspected PE | Unclear | V/Q scan | Pulmonary angiography |
| 16. Friera-Reyes et al, 2005 (29) | Patients with suspected PE | Outpatient | D-dimer | Chest radiograph, perfusion scintigraphy, venous ultrasound of lower limbs, spiral CT, and pulmonary arteriography |
| 17. Froehling et al, 2007 (30) | Patients with suspected PE | Inpatients and outpatients | D-dimer | CT angiography |
| 18. Garcia Bolado et al, 2003 (63) | Patients with suspected PE | Emergency department | CUS | CTPA |
| 19. Ghanima et al, 2006 (31) | Patients with suspected PE | Outpatients | D-dimer | Multislice CT |
| 20. Goekoop et al, 2007 (32) | Patients with suspected PE | Outpatients | D-dimer | CT scan |
| VQ scan | ||||
| 21. Guilabert et al, 2007 (67) | Patients with suspected PE | Inpatient | Multislice CT | VQ scan |
| Doppler US | ||||
| 22. Hantous-Zannad et al, 2010 (55) | Patients with suspected PE | Inpatient | CTPA | Unclear |
| 23. Jiménez et al, 2006 (56) | Patients with suspected PE | Unclear | CT angiogram | VQ scan |
| Doppler US | ||||
| 24. Kabrhel, 2008 (51) | Patients with suspected PE | Emergency department | D-dimer | CT angiogram |
| VQ scan | ||||
| Doppler US of leg veins | ||||
| 25. Kim et al, 1999 (64) | Patients with suspected PE | Inpatient and outpatient | Spiral CT scan | V/Q scan |
| Doppler US of leg veins | ||||
| Pulmonary angiography | ||||
| 26. Le Gal et al, 2006 (77) | Patient with clinically suspected recurrent acute PE | Outpatient | Doppler ultrasound of lower limbs | Multislice CT |
| 27. Leclercq et al, 2003 (33) | Patients with suspected PE | Inpatient and outpatient | D-dimer | VQ Scan Doppler Ultrasonography and pulmonary angiography |
| 28. Mac Gillavry et al, 2000 (65) | Patients with suspected PE | Inpatient and outpatient | Doppler ultrasonography | Perfusion lung scintigraph |
| Pulmonary angiography | ||||
| 29. Macdonald et al, 2005 (57) | Patients with suspected PE | Unclear | VQ scan | CT pulmonary angiography |
| 30. Megyeri et al, 2014 (59) | Patients with suspected PE | Unclear | CT pulmonary angiography | VQ scan |
| Doppler ultrasonography | ||||
| 31. Miron et al, 1999 (72) | Patients with suspected PE | Inpatients | D-dimer | V/Q scan |
| Doppler ultrasonography | ||||
| Pulmonary angiography | ||||
| 32. de Moerloose et al, 1996 (21) | Patients with suspected PE | Outpatient | D-dimer | V/Q scan |
| Doppler ultrasonography | ||||
| Pulmonary angiography | ||||
| 33. Moores et al, 2016 (58) | Patients with suspected PE | Outpatient | CTPA | V/Q scan |
| Venous ultrasonograph | ||||
| Pulmonary angiograph | ||||
| 34. Mos et al, 2014 (78) | Patient with clinically suspected recurrent acute PE | Inpatient | D-dimer | CTPA |
| 35. Nijkeuter et al, 2007 (79) | Patients with clinical suspicion of recurrent PE | Inpatient and outpatient | D-dimer | CTPA |
| 36. Oger et al, 1998 (34) | Patients with suspected PE | Outpatient | D-dimer | V/Q scan |
| Venous ultrasonograph | ||||
| Pulmonary angiography | ||||
| 37. Pacouret et al, 2002 (35) | Patients with suspected PE | Outpatient | D-dimer | Helicoidal thoracic scanner |
| Venous Doppler of the lower limbs | ||||
| Pulmonary scintigraphy | ||||
| 38. Palud et al, 2004 (36) | Patients with suspected PE | Unclear | D-dimer | CTPA |
| Pulmonary angiogram | ||||
| Doppler US | ||||
| 39. Parent et al, 2007 (37) | Patients with suspected PE | Inpatient and outpatient | D-dimer | CTPA |
| Doppler US | ||||
| Pulmonary angiogram | ||||
| V/Q lung scan | ||||
| 40. Pérez de Llano et al, 2006 (60) | Patients with suspected PE | Outpatient | Helical CT | Venous ultrasonography |
| 41. Pernod et al, 2017 (50) | Patients with suspected PE | Outpatient | D-dimer | CTPA |
| V/Q scan | ||||
| Pulmonary arteriography | ||||
| 42. Perrier et al, 1996 (68) | Patients with suspected PE | Outpatient | V/Q scan, D-dimer and Doppler ultrasonography | Pulmonary angiography |
| 43. Perrier et al, 1999 (39) | Patients with suspected PE | Outpatient | D-dimer, lower-limb venous compression ultrasonography, and V/Q scan | Phlebography and pulmonary angiography |
| 44. Perrier et al, 2004 (40) | Patients with suspected PE | Outpatient | D-dimer, lower limb venous ultrasonography, and helical CT | Pulmonary angiography |
| 45. Perrier et al, 2005 (38) | Patients with suspected PE | Outpatient | D-dimer measurement and multidetector-row CT | Lower-limb ultrasonography |
| 46. Quinn et al, 1999 (41) | Patients with suspected PE | Unclear | D-dimer | Pulmonary angiography |
| 47. Righini et al, 2008 (42) | Patients with suspected PE | Outpatient | D-dimer | Venous ultrasonography |
| 48. Righini et al, 2014 (43) | Patients with suspected PE | Outpatient | D-dimer | V/Q scan, CTPA, angiography |
| 49. Sijens et al, 2000 (44) | Patients with suspected PE | Inpatient | D-dimer | Pulmonary angiography |
| 50. Söderberg et al, 2009 (45) | Patients with suspected PE | Outpatient | D-dimer | CTPA, angiography |
| 51. Spies et al, 1986 (73) | Patients with suspected PE | Unclear | V/Q scan | Pulmonary angiography |
| 52. Stein et al, 2006 (61) | Patients with suspected PE | Inpatient and outpatient | Multidetector CTPA | V/Q scan, ultrasonography, pulmonary digital-subtraction angiography |
| 53. Subramaniam et al, 2007 (62) | Patients with suspected PE | Unclear | CTPA | Unclear |
| 54. Szturmowicz et al, 2015 (46) | Patients with suspected PE | Unclear | D-dimer | CTPA |
| 55. Toulon et al, 2004 (47) | Patients with suspected PE | Outpatient | D-dimer | V/Q scan, spiral CT, pulmonary digital-subtraction angiography. |
| 56. Turan et al, 2017 (52) | Patients with suspected PE | Outpatient | CTPA | D-dimer |
| 57. Turkstra et al, 1997 (66) | Patients with suspected PE | Inpatient and outpatient | Compression ultrasonography | V/Q scan and angiography |
| 58. van Rossum et al, 1996 (75) | Patients with suspected PE | Unclear | Spiral volumetric computed tomographic | V/Q scan, ultrasonography of the legs |
| 59. van Rossum et al, 1998 (74) | Patients with suspected PE | Mostly outpatient | Helical CT | V/Q scan |
| 60. Verschuren et al, 2003 (48) | Patients with suspected PE | Emergency department | D-dimer | CTPA |
| V/Q scan | ||||
| CUS | ||||
| Pulmonary arteriography | ||||
| 61. Wells et al, 2000 (76) | Patients with suspected PE | Unclear | D-dimer | V/Q scan, compression ultrasonography |
D-dimer
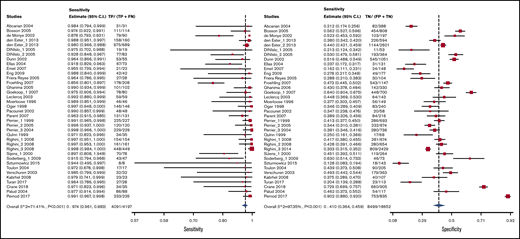
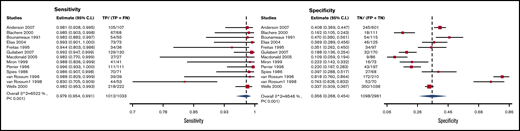
Test accuracy data for D-dimer were pooled from 34 studies, with a total of 22 849 participants.19-52 The Vidas D-dimer assay had a sensitivity of 0.97 (95% confidence interval [CI], 0.95-0.99) and a specificity of 0.41 (95% CI, 0.36-0.46), Tina-quant D-dimer had a sensitivity of 0.92 (95% CI, 0.83-0.96) and a specificity of 0.41 (95% CI, 0.39-0.60), and STA Liatest D-dimer had a sensitivity of 0.98 (95% CI, 0.93-0.99) and a specificity of 0.40 (95% CI, 0.32-0.49). The pooled estimates for D-dimer sensitivity and specificity were 0.97 (95% CI, 0.96-0.98) and 0.411 (95% CI, 0.36-0.46), respectively. Figure 2 shows the forest plot displaying the sensitivity and specificity from individual studies and the pooled estimates for all D-dimer assays. Figures 3-5 show the forest plots displaying sensitivity and specificity from individual studies for specific assays.
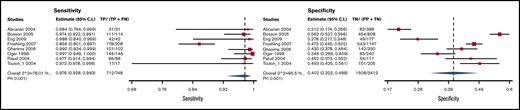
D-dimer results were illustrated for 1000 patients from a low-prevalence population undergoing the test, and absolute differences indicate a low (<5%) proportion of false-negative results and a high proportion of false-positive results (>5%). Overall, the test was shown to be highly sensitive but had low specificity. The certainty of evidence was moderate. Table 2 shows the summary of findings.
D-dimer test accuracy in a low-prevalence population
| Test result | No. of results per 1000 patients tested (95% CI) | No. of participants (studies) | Certainty of the evidence (GRADE) |
|---|---|---|---|
| Prevalence 5%*† in patients with suspected PE | |||
| True positives | 49 (48-49) | 22 849 (34) | ⨁⨁⨁◯ MODERATE‡§ |
| False negatives | 1 (1-2) | ||
| True negatives | 389 (352-437) | 22 849 (34) | ⨁⨁⨁◯ MODERATE‡§ |
| False positives | 561 (513-608) | ||
| Inconclusive test results | 0 | 22 849 (34) | — |
| Complications arising from the diagnostic test | Not reported |
Patient or population: patients with suspected PE. Setting: inpatient and outpatient. Pooled sensitivity: 0.97 (95% CI, 0.96-0.98). Pooled specificity: 0.41 (95% CI, 0.36-0.46). An interactive summary of findings is available at https://gdt.gradepro.org/presentations/#/isof/isof_4a1a37bd-1b30-40b7-adea-d5214ffb73c2-1581444096033?_k=f5c4gy.
GRADE, Grading of Recommendations Assessment, Development and Evaluation.
Ceriani E, et al. J Thromb Haemost. 2010;8(5):957. Pooled prevalence of PE with low PTP in North American studies 6.5% (5% used in table).
Disease prevalence applies to the index test in each pathway. Prevalence applied to the accuracy of each subsequent test depends on the result of the previous test in the pathway.
Certainty of evidence not downgraded for risk of bias, although few studies had a combination of reference standards that were judged to be acceptable by a panel of clinical experts.
Although there was inconsistency noted for sensitivity, it was judged as not serious and we did not downgrade the certainty of evidence. Certainty of evidence was downgraded for serious unexplained inconsistency in specificity, with a range from 12.8% to 64%.
Age-adjusted D-dimer
Test accuracy data for age-adjusted D-dimer were pooled from 1 study, with a total of 2885 participants.43 We did not include retrospective validation studies. The pooled estimates for age adjusted D-dimer sensitivity and specificity were 0.99 (95% CI, 0.98-1.00) and 0.47 (95% CI, 0.45-0.49), respectively. Figure 2 shows the forest plot displaying the sensitivity and specificity from individual studies and the pooled estimates.
Age-adjusted D-dimer results were illustrated for 1000 patients from a low-prevalence population undergoing the test, and absolute differences indicate a low (<5%) proportion of false-negative results and a high proportion of false-positive results (>5%). Overall, the test was shown to be highly sensitive but had low specificity. The certainty of evidence was high. Table 3 shows the summary of findings.
Age-adjusted D-dimer test accuracy in a low-prevalence population
| Test result | No. of results per 1000 patients tested (95% CI) | No. of participants (studies) | Certainty of the evidence (GRADE) |
|---|---|---|---|
| Prevalence 5%*† in patients with suspected PE | |||
| True positives | 50 (49-50) | 2885 (1) | ⨁⨁⨁⨁ HIGH‡ |
| False negatives | 0 (0-1) | ||
| True negatives | 446 (428-465) | 2885 (1) | ⨁⨁⨁⨁ HIGH‡ |
| False positives | 504 (485-522) | ||
| Inconclusive test results | 0 | 2885 (1) | — |
| Complications arising from the diagnostic test | Not reported | ||
Patient or population: patients with suspected PE. Setting: inpatient and outpatient. Pooled sensitivity: 0.99 (95% CI, 0.98-1.00). Pooled specificity: 0.47 (95% CI, 0.45-0.49). An interactive summary of findings is available at https://gdt.gradepro.org/presentations/#/isof/isof_a6f96835-4b9e-4342-b4ab-7dae1b5c9ead-1569977909216?_k=46z8fa.
Pooled prevalence of PE with low PTP in North American studies 6.5% (5% used in table).18
Disease prevalence applies to the index test in each pathway. Prevalence applied to the accuracy of each subsequent test depends on the result of the previous test in the pathway.
Certainty of evidence not downgraded for imprecision given the large population size, though only 1 prospective age-adjusted D-dimer study was identified for analysis.
CTPA
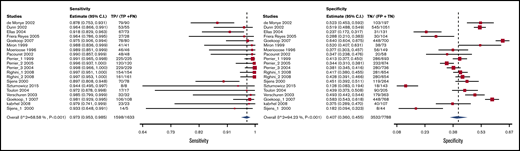
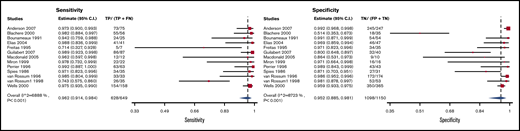
Test accuracy data for CTPA were pooled from 16 studies, with a total of 4392 participants.26,28,35,38,42,43,53-62 The pooled estimates for CTPA sensitivity and specificity were 0.94 (95% CI, 0.89-0.97) and 0.98 (95% CI, 0.97-0.99), respectively. Figure 6 shows the forest plot displaying the sensitivity and specificity from individual studies and the pooled estimates.
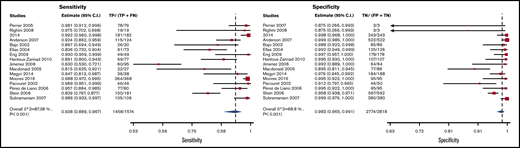
CTPA results were illustrated for 1000 patients from a low-prevalence population undergoing the test, and absolute differences indicate a low (<5%) proportion of false-negative and false-positive results. Overall, the test was shown to be highly sensitive and specific and the certainty of evidence was moderate. Table 4 shows the summary of findings.
CTPA test accuracy in a low-prevalence population
| Test result | No. of results per 1000 patients tested (95% CI) | No. of participants (studies) | Certainty of the evidence (GRADE) |
|---|---|---|---|
| Prevalence 5%*† in patients with suspected PE | |||
| True positives | 47 (45-49) | 4392 (16) | ⨁⨁⨁◯ MODERATE‡§ |
| False negatives | 3 (1-5) | ||
| True negatives | 931 (922-941) | 4392 (16) | ⨁⨁⨁◯ MODERATE‡§ |
| False positives | 19 (9-28) | ||
| Inconclusive test results | 115 | 4392 (16) | — |
| Complications arising from the diagnostic test | Not reported | ||
Patient or population: patients with suspected PE. Setting: inpatient and outpatient. Pooled sensitivity: 0.94 (95% CI, 0.89-0.97). Pooled specificity: 0.98 (95% CI, 0.97-0.99). An interactive summary of findings is available at: https://gdt.gradepro.org/presentations/#/isof/isof_1841b2e2-df16-431d-b809-de3913a3b6f5-1569994386148?_k=w5d920.
Pooled prevalence of PE with low PTP in North American studies 6.5% (5% used in table).18
Disease prevalence applies to the index test in each pathway. Prevalence applied to the accuracy of each subsequent test depends on the result of the previous test in the pathway.
Certainty of evidence not downgraded for risk of bias, although few studies had a combination of reference standards that were judged to be acceptable by a panel of clinical experts.
Certainty of evidence was downgraded for serious unexplained inconsistency in sensitivity, with a range from 63% to 99.2%. There was inconsistency also noted for specificity, but it was judged as not serious and we did not to downgrade the certainty of evidence.
Compression ultrasound
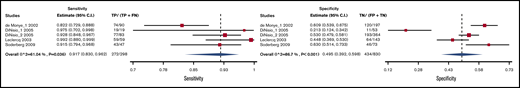
Test accuracy data for proximal vein CUS (ie, proximal to the calf veins [trifurcation veins and higher]) were pooled from 7 studies, with a total of 1715 participants.42,63-68 The pooled estimates for CUS sensitivity and specificity were 0.49 (95% CI, 0.31-0.66) and 0.96 (95% CI, 0.95-0.98), respectively. Figure 7 shows the forest plot displaying the sensitivity and specificity from individual studies and the pooled estimates.
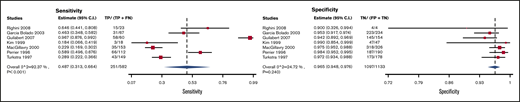
CUS results were illustrated for 1000 patients from a low-prevalence population undergoing the test, and absolute differences indicate a low (<5%) proportion of false-positive results and a high proportion of false-negative results (>5%). Overall, the test was shown to be highly specific but had low sensitivity. The certainty of evidence was low. Table 5 shows the summary of findings.
Proximal CUS sensitivity and specificity in a low-prevalence population
| Test result | No. of results per 1000 patients tested (95% CI) | No. of participants (studies) | Certainty of the evidence (GRADE) |
|---|---|---|---|
| Prevalence 5%*† in patients with suspected PE | |||
| True positives | 25 (16-33) | 1715 (7) | ⨁⨁◯◯ LOW‡§ |
| False negatives | 25 (17-34) | ||
| True negatives | 912 (903-931) | 1715 (7) | ⨁⨁◯◯ LOW‡§ |
| False positives | 38 (19-47) | ||
| Inconclusive test results | 0 | 1715 (7) | — |
| Complications arising from the diagnostic test | Not reported | ||
Patient or population: patients with suspected PE. Setting: inpatient and outpatient. Pooled sensitivity: 0.49 (95% CI, 0.31-0.66). Pooled specificity: 0.96 (95% CI, 0.95-0.98). An interactive summary of findings is available at: https://gdt.gradepro.org/presentations/#/isof/isof_4b33e40d-b17a-4359-964b-51aca44d75e4-1569994797123?_k=cykq2y.
Pooled prevalence of PE with low PTP in North American studies 6.5% (5% used in table).18
Disease prevalence applies to the index test in each pathway. Prevalence applied to the accuracy of each subsequent test depends on the result of the previous test in the pathway.
Certainty of evidence not downgraded for risk of bias, although few studies had a combination of reference standards that were judged to be acceptable by a panel of clinical experts.
Certainty of evidence was downgraded for serious unexplained inconsistency in sensitivity, with a range from 18.4% to 96.7%. There was inconsistency also noted for specificity, but it was judged as not serious and we did not to downgrade the certainty of evidence.
V/Q scan
Test accuracy data for V/Q scans were pooled from 13 studies, with a total of 3994 participants.26,53,57,67-76 Three variations of pooled estimates for sensitivity and specificity of V/Q scan were carried out.
V/Q scans for which high probability scans were considered positive and low/nondiagnostic/normal scans were considered negative had a sensitivity and specificity of 0.58 (95% CI, 0.50-0.66) and 0.98 (95% CI, 0.96-0.99), respectively. Figure 8 shows the forest plot displaying the sensitivity and specificity from individual studies and the pooled estimates. V/Q scan results were illustrated for 1000 patients from a low-prevalence population undergoing the test, and absolute differences indicate a low (<5%) proportion of false-positive results and a high proportion of false-negative results (>5%). Overall, the test was shown to be highly specific but had low sensitivity. The certainty of evidence was moderate. Table 6A shows the summary of findings.
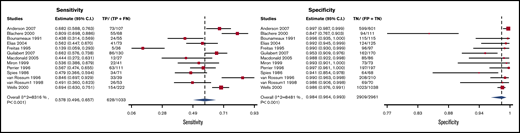
Forest plot for VQ1: high-probability scans considered positive and low/nondiagnostic/normal scans considered negative.
Forest plot for VQ1: high-probability scans considered positive and low/nondiagnostic/normal scans considered negative.
Ventilation/perfusion scan sensitivity and specificity for a low-prevalence population
| No. of results per 1000 patients tested (95% CI) | |||||||||
|---|---|---|---|---|---|---|---|---|---|
| Prevalence 5%*† in patients with suspected PE | No. of participants (studies) | Certainty of the evidence (GRADE) | |||||||
| Test result | A | B | C | A | B | C | A | B | C |
| True positives | 29 (25-33) | 49 (48-50) | 48 (46-49) | 3994 (13) | 3994 (13) | 1799 (13) | ⨁⨁⨁◯ MODERATE‡§ | ⨁⨁⨁◯ MODERATE‡|| | ⨁⨁⨁⨁ HIGH‡||¶ |
| False negatives | 21 (17-25) | 1 (0-2) | 2 (1-4) | ||||||
| True negatives | 931 (912-941) | 342 (257-428) | 903 (845-931) | 3994 (13) | 3994 (13) | 1799 (13) | ⨁⨁⨁◯ MODERATE‡§ | ⨁⨁⨁◯ MODERATE‡|| | ⨁⨁⨁⨁ HIGH‡||¶ |
| False positives | 19 (9-38) | 608 (522-693) | 47 (19-105) | ||||||
| Inconclusive test results | 1849 | 1849 | 0 | 3994 (13) | 3994 (13) | 1799 (13) | |||
| Complications arising from the diagnostic test | Not reported | ||||||||
Patient or population: patients with suspected PE. Setting: inpatient and outpatient. A: V/Q scan with high probability scan interpreted as positive, normal/low/nondiagnostic scan as negative. An interactive summary of findings is available at: https://gdt.gradepro.org/presentations/#/isof/isof_88bb7995-dec1-4116-9b07-a2f15691c2c4-1570046058781?_k=fmsw16. Pooled sensitivity of A: 0.58 (95% CI, 0.50-0.66); pooled specificity: 0.98 (95% CI, 0.96-0.99). B: V/Q scan with high/nondiagnostic/low probability scan interpreted as positive, normal scan as negative. An interactive summary of findings is available at: https://gdt.gradepro.org/presentations/#/isof/isof_2564a7dd-52d5-442b-bfee-0d6495de7cfc-1570045676857?_k=pihtmp. Pooled sensitivity of B: 0.98 (95% CI, 0.95-0.99); pooled specificity: 0.36 (95% CI, 0.27-0.45). C: V/Q scan with high probability scan as positive, normal scan as negative. An interactive summary of findings is available at: https://gdt.gradepro.org/presentations/#/isof/isof_3f842c9a-15d3-4b16-8ed5-0011f3157c53-1570045878061?_k=vgsgvi.
Pooled prevalence of PE with low PTP in North American studies 6.5% (5% used in table).18
Disease prevalence applies to the index test in each pathway. Prevalence applied to the accuracy of each subsequent test depends on the result of the previous test in the pathway.
Certainty of evidence not downgraded for risk of bias, although few studies had a combination of reference standards that were judged to be acceptable by a panel of clinical experts.
Certainty of evidence was downgraded for serious unexplained inconsistency in sensitivity, with a range from 13.9% to 84.6%. Minor inconsistency for specificity noted but judged to be insufficient to downgrade the certainty of evidence.
Although there was inconsistency noted for sensitivity, it was judged as not serious and we did not downgrade the certainty of evidence. Certainty of evidence was downgraded for serious unexplained inconsistency in specificity, with a range from 10.9% to 81.8%.
Although there was inconsistency noted for sensitivity, it was judged as not serious and we did not downgrade the certainty of evidence. There was inconsistency also noted for specificity, but it was judged as not serious and we did not to downgrade the certainty of evidence.
V/Q scans with high/nondiagnostic/low probability scans considered as positive and normal scans as negative had a sensitivity and specificity of 0.98 (95% CI, 0.95-0.99) and 0.36 (95% CI, 0.27-0.45), respectively. Figure 9 shows the forest plot displaying the sensitivity and specificity from individual studies and the pooled estimates. V/Q scan results were illustrated for 1000 patients from a low-prevalence population undergoing the test, and absolute differences indicate a low (<5%) proportion of false-negative results and a high proportion of false-positive results (>5%). Overall, the test was shown to be highly sensitive but had low specificity. The certainty of evidence was moderate. Table 6B shows the summary of findings.
Forest plot for VQ2: high/nondiagnostic/low probability scans considered as positive and normal scans as negative.
Forest plot for VQ2: high/nondiagnostic/low probability scans considered as positive and normal scans as negative.
V/Q scans for which high-probability scans were considered positive and normal scans as negative had a sensitivity and specificity of 0.96 (95% CI, 0.91-0.98) and 0.95 (95% CI, 0.89-0.98), respectively. Figure 10 shows the forest plot displaying the sensitivity and specificity from individual studies and the pooled estimates. V/Q scan results were illustrated for 1000 patients from a low-prevalence population undergoing the test, and absolute differences indicate a low (<5%) proportion of false-negative and false-positive results. Overall, the test was shown to be highly sensitive and specific and the certainty of evidence was moderate. The certainty of evidence was high. Table 6C shows the summary of findings.
Forest plot for VQ3: high-probability scans considered positive and normal scans considered negative.
Forest plot for VQ3: high-probability scans considered positive and normal scans considered negative.
Recurrent PE
Test accuracy data for recurrent PE were pooled from 3 studies.77-79 Tables 7 and 8 show the modeled data findings for this comparison.
Recurrent PE: D-dimer for patients with low clinical probability, CTPA for patients with low clinical probability and positive D-dimer, or high clinical probability sensitivity and specificity
| Test result | No. of results per 1000 patients tested (95% CI) | No. of participants (studies) | Certainty of the evidence (GRADE) | |
|---|---|---|---|---|
| Prevalence 30%*†‡ in patients suspected of having PE | Prevalence 40%†‡§ in patients suspected of having PE | |||
| True positives | 291 (282-294) | 388 (376-392) | 992 (3) | ⨁⨁⨁◯ MODERATE|| |
| False negatives | 9 (6-18) | 12 (8-24) | ||
| True negatives | 700 (693-700) | 600 (594-600) | 992 (3) | ⨁⨁⨁◯ MODERATE|| |
| False positives | 0 (0-7) | 0 (0-6) | ||
| Inconclusive test results | 3 | 992 (3) | — | |
| Complications arising from the diagnostic test | Not reported | |||
Patient or population: patients with suspected recurrent PE. Setting: inpatient and outpatient. Pooled sensitivity: 0.97 (95% CI, 0.94-0.98). Pooled specificity: 1.00 (95% CI, 0.99-1.00). An interactive summary of findings is available at: https://gdt.gradepro.org/presentations/#/isof/isof_e7c58633-0d3e-4209-9a2f-5f072eaca759-1569995555070?_k=3k1k5o.
Data from Mos et al.78
†Data from Nijkeuter et al.79
Disease prevalence applies to the index test in each pathway. Prevalence applied to the accuracy of the subsequent tests depends on the result of the previous test in the pathway.
Data from Le Gal et al.77
Certainty of evidence was downgraded for imprecision given the small population size from the 3 recurrent PE study identified for analysis.
D-dimer for recurrent PE sensitivity and specificity
| Test result | No. of results per 1000 patients tested (95% CI) | No. of participants (studies) | Certainty of the evidence (GRADE) | |
|---|---|---|---|---|
| Prevalence 30%*†‡ in patients suspected of having PE | Prevalence 40%†‡§ in patients suspected of having PE | |||
| True positives | 300 (291-300) | 400 (388-400) | 304 (1) | ⨁⨁◯◯ LOW||¶ |
| False negatives | 0 (0-9) | 0 (0-12) | ||
| True negatives | 189 (147-238) | 162 (126-204) | 304 (1) | ⨁⨁◯◯ LOW||¶ |
| False positives | 511 (462-553) | 438 (396-474) | ||
| Inconclusive test results | 0 | 304 (1) | ||
| Complications arising from the diagnostic test | Not reported | |||
Patient or population: patients with suspected recurrent pulmonary embolism. Setting: inpatient and outpatient. Pooled sensitivity: 1.00 (95% CI, 0.97-1.00). Pooled specificity: 0.27 (95% CI, 0.21-0.34). An interactive summary of findings is available at: https://gdt.gradepro.org/presentations/#/isof/isof_16692888-165a-4eaa-ac25-6823e63d0aff-1569995266014?_k=4hew36.
Data from Mos et al.78
Data from Nijkeuter et al.79
Disease prevalence applies to the index test in each pathway. Prevalence applied to the accuracy of the subsequent tests depends on the result of the previous test in the pathway.
Data from Le Gal et al.77
Certainty of evidence was downgraded for imprecision given the small population size from the 1 recurrent PE study identified for analysis.
Certainty of evidence was downgraded for risk of bias from a secondary analysis of 2 prospective multicenter studies with a mixed population of recurrent and first-time PE patients.
For the sequence of D-dimer testing for low clinical PTP patients, CTPA testing for low clinical PTP patients with positive D-dimer or high clinical PTP patients, the pooled estimates for sensitivity and specificity were 0.97 (95% CI, 0.94-0.98) and 1.00 (95% CI, 0.99-1.00), respectively. This diagnostic algorithm was illustrated for 1000 patients from a low-prevalence population undergoing the test, and absolute differences indicate a low (<5%) proportion of false-negative and false-positive results. Overall, the test was shown to be highly sensitive and specific and the certainty of evidence was moderate. The certainty of evidence was moderate. Table 7 shows the summary of findings.
For D-dimer alone, the pooled estimates for sensitivity and specificity were 1.00 (95% CI, 0.97-1.00) and 0.27 (95% CI, 0.21-0.34), respectively. The certainty of evidence was low for true positives, true negatives, false positives, and false negatives. D-dimer results were illustrated for 1000 patients from a low-prevalence population undergoing the test, and absolute differences indicate a low (<5%) proportion of false-negative results and a high proportion of false-positive results (>5%). Overall, the test was shown to be highly sensitive but had low specificity. The certainty of evidence was low. Table 8 shows the summary of findings.
Discussion
This review presents pooled estimates of test accuracy for commonly available diagnostic methods for PE. The certainty of evidence ranged from low to high for test accuracy. The only diagnostic test with a low certainty of evidence was CUS, whereas the other tests had moderate to high certainty of evidence. Of the evaluated tests, D-dimer had the highest sensitivity at 0.97 (95% CI, 0.96-0.98), with age-adjusted D-dimer having an even higher sensitivity of 0.99 (95% CI, 0.98-1.00). CTPA and V/Q scans (high probability scan as a positive and low/nondiagnostic/normal scan as negative) both had the highest specificity at 0.98 (95% CI, 0.97-0.99) and 0.98 (95% CI, 0.96-0.99), respectively. The sensitivity and specificity results obtained in this systematic review were used in a model to determine the effects of different strategies to diagnose patients suspected of having PE. The modeling results were used to make evidence-based recommendations on diagnostic test approaches to PE in the American Society of Hematology evidence-based guidelines.13
This review has several strengths. The comprehensive and systematic approach for identifying studies makes it unlikely that relevant studies were missed. We also attempted to include studies with insufficient information to abstract test accuracy by contacting researchers of those studies to obtain primary data. For example, in The Christopher Study,80 we were unable to abstract the patients that were low PTP with a positive D-dimer who underwent a CTPA from the high PTP patients that went straight to CTPA. We were unable to obtain the primary data; therefore, the study was excluded. Several post hoc analyses papers had the missing data, so these were included for analysis but the original study was excluded to avoid duplication. Additionally, we did not limit our review by language and translated articles that were not published in English. Finally, we assessed the certainty of evidence in this area and identified sources of bias.
There are a few limitations of the present review. The high sensitivity of age-adjusted D-dimer is limited by the fact that only 1 study evaluating age-adjusted D-dimer prospectively was identified for analysis. We excluded many emerging and promising modalities such as magnetic resonance imaging (and V/Q single-photon emission CT) because limited data are available. In addition, many of the studies that were included did not have an actual reference test. Occasionally, studies used follow up (eg, 3 months, 6 months) as a reference standard to testing, which was deemed acceptable by the panel. Clinically insignificant PE may be missed with follow-up as a reference, but this was acceptable because it determines the performance of the test in a clinically significant setting. Last, the diagnostic test accuracy estimates were determined for a test done in a standalone manner, and we did not consider combinations of tests in a pathway for establishing a diagnosis of PE. This may be required, for example, in patients who have a low PTP but have a positive D-dimer. The pooled sensitivity and specificity estimates of the tests from this review only apply when the test is performed alone, which may be applicable in certain populations. For example, compression ultrasound is rarely used as a standalone test for the diagnosis of PE; however, certain clinical conditions may necessitate the use of compression ultrasound alone (eg, patients who cannot initially undergo any direct lung imaging because of renal failure or pregnancy). The results in this review can be used to model various diagnostic strategies to inform clinical decision-making. Ultimately, the diagnostic tests will be used in a strategic approach based on clinical pretest probability and with consideration of availability, cost, and patient and provider values and preferences.
In conclusion, this systematic review synthesizes and evaluates the accuracy of commonly used tests for the diagnosis of PE. Estimates of sensitivity and specificity from this review were used to model diagnostic strategies and inform evidence-based recommendations for a clinical practice guideline.13 The prevalence or pretest probability for PE along with the sensitivity and specificity estimates will influence clinical decision-making and patient management.
Acknowledgments
The systematic review team would like to acknowledge the Canadian Agency for Drugs and Technologies in Health team for their assistance with data management and organization of the manuscript.
This systematic review was conducted to support the development of the American Society of Hematology (ASH) 2018 guidelines for management of venous thromboembolism: diagnosis of venous thromboembolism. The entire guideline development process was funded by ASH. Through the McMaster GRADE Center, some researchers received salary (Parth Patel, Payal Patel, C.B., M.B., W.W., H.B., and J.V.) or grant support (R.A.M. and H.J.S.); others participated to fulfill requirements of an academic degree or program or volunteered their time.
Authorship
Contribution: Parth Patel contributed to study design, search strategy, study selection, data extraction, statistical analysis, and drafting the report; Parth Patel, M.B., C.B., H.B., R.A.M., M.A.K., N.M.H., Y.N.A.J., and Payal Patel contributed to study design, study selection, data extraction, statistical analysis, and critical revision of the report; J.V., D.W., H.A., M.T., M.B., W.B., R. Khatib, R. Kehar, R.P., A.S., and A.M. contributed to study selection and data extraction; and W.W., W.L., G.L.G., S.M.B., L.B.H., J.K., E.L., M.R., H.J.S., and R.A.M. contributed to the study design, interpretation of the results, and critical revision of the report.
Conflict-of-interest disclosure: The authors declare no competing financial interests.
Correspondence: Reem A. Mustafa, Division of Nephrology and Hypertension, Department of Medicine, University of Kansas Medical Center, 3901 Rainbow Blvd, MS3002, Kansas City, KS 66160; e-mail: ramustafa@gmail.com.

