

Key Points
CD4+ and CD8+ T cells with a T memory stem cell–like phenotype are expanded at the onset of aGVHD.
Molecular profiles of T cells at aGVHD onset are characterized by decreased TGF-β and increased NF-κB signaling.

Abstract
The cellular and molecular processes involved in acute graft-versus-host disease (aGVHD) development early after allogeneic hematopoietic cell transplantation (HCT) in humans remain largely unknown. We have performed multiparameter immunophenotyping and molecular profiling of CD4+ and CD8+ T cells in 2 independent cohorts of patients undergoing HCT, as well as in their HLA-identical sibling donors. Cellular profiling using spectral flow cytometry showed an incomplete reconstitution of the T-cell compartment in recipients without aGVHD early after transplantation, as well as a shift toward an effector memory phenotype, paralleled by depletion of the naive T-cell pool. Molecular profiling of T-cell populations in donors vs recipients without aGVHD revealed increased pathway activity of >40 gene modules in recipients. These pathways were associated in particular with T-cell activation, adhesion, migration, and effector functions. Cellular profiles from recipients developing aGVHD displayed an enrichment of cells with a T memory stem cell–like phenotype compared with recipients without aGVHD. Comparison of gene profiles from these recipients revealed that transforming growth factor-β (TGF-β) signaling was most significantly downregulated, whereas the pathway activity of NF-κB–associated transcription factors and signaling pathways were increased, at aGVHD onset. This study suggests that the integration of cellular and molecular profiles provides new insights into the development of aGVHD in humans.
Introduction
Allogeneic hematopoietic cell transplantation (allo-HCT) is a curative treatment for many malignant and nonmalignant hematologic disorders.1-3 However, its success is hindered by graft-versus-host disease (GVHD), a potentially fatal complication deriving from alloreactive donor T cells attacking recipient tissues.4 Despite advances in the field of hematopoietic cell transplantation (HCT) and GVHD prophylaxis, acute GVHD (aGVHD) remains a major contributing factor to nonrelapse morbidity and mortality, affecting 30% to 50% of allo-HCT patients3,5 ; it is also a leading cause of death after allo-HCT, with a mortality of nearly 20%.1 Most of our knowledge about aGVHD pathophysiology derives from animal models.6,7 The complex and multifactorial nature of aGVHD, together with limited access to biological specimens, makes the study of the mechanisms involved in the development of human aGVHD particularly challenging. Although donor T cells are critical to the pathophysiology of acute and chronic GVHD,3,8-10 the precise mechanisms underlying their functions and the immune evasion leading to alloreactivity that occurs in allo-HCT recipients, despite immunosuppressive prophylaxis, are unclear.
Here, we investigated the phenotypic and molecular characteristics of immune cells in patients after allo-HCT, as well as in their HLA-identical sibling donors, with the goal of defining the early immune parameters associated with the development of aGVHD. We analyzed 2 cohorts of donor-recipient pairs: a multicentric cohort from 13 French transplantation centers and a monocentric cohort from the Saint-Louis Hospital. We performed multiparameter immunophenotyping using spectral flow cytometry to define the frequencies of different T-cell subpopulations and gene-expression profiling of T-cell populations involved in aGVHD pathogenesis.
Our data demonstrate that the integrated analysis of the distribution of different immune cell subsets with spectral flow cytometry, together with gene-expression profiling, can contribute to elucidate the processes involved in the early immune reconstitution and aGVHD development in humans.
Materials and methods
Patients
Two independent cohorts of patients undergoing allogeneic HCT and their respective identical sibling donors were included in this study. We recently described the metabolomics serum analyses of these 2 cohorts.11 Patient and donor characteristics are presented in Table 1. Cohort 1 includes 38 donor-recipient pairs for whom peripheral blood mononuclear cells (PBMCs) were provided by the CRYOSTEM biobank (https://doi.org/10.25718/cryostem-collection/2018). Cohort 2 includes 37 donor-recipient pairs for whom PBMCs samples were prospectively collected at Saint-Louis Hospital and cryopreserved. Blood samples from the donors were collected before the transplantation procedure, and samples from the recipients were collected at aGVHD onset or at day 90 post-HCT, for the patients who did not develop aGVHD. Details about the HCT procedure and aGVHD diagnosis are provided in supplemental Material and methods.
Patient and donor characteristics
| Variable | Cohort 1 (multicentric) | Cohort 2 (monocentric) | ||
|---|---|---|---|---|
| Donors (n = 39) | Recipients (n = 38) | Donors (n = 42) | Recipients (n = 37) | |
| Age, median (range), y | 49.5 (14-65) | 46 (17-68) | 52.5 (15-67) | 53 (22-67) |
| Sex | ||||
| Female | 18 (46.1) | 19 (50) | 24 (57.1) | 19 (51.4) |
| Male | 20 (51.3) | 19 (50) | 18 (42.9) | 18 (48.6) |
| Unknown | 1 (2.6) | — | — | — |
| HLA-identical sibling donor, % | 100 | 100 | ||
| Graft type | ||||
| Bone marrow | 11 (28.9) | 3 (8.1) | ||
| Peripheral blood | 26 (68.5) | 34 (91.9) | ||
| Unknown | 1 (2.6) | — | ||
| Sex match | ||||
| Male to male | 10 (26.3) | 7 (18.9) | ||
| Female to female | 9 (23.7) | 11 (29.7) | ||
| Male to female | 10 (26.3) | 8 (21.7) | ||
| Female to male | 8 (21.1) | 11 (29.7) | ||
| Unknown | 1 (2.6) | — | ||
| Conditioning regimen | ||||
| Reduced intensity | 17 (44.8) | 32 (86.5) | ||
| Myeloablative | 20 (52.6) | 5 (13.5) | ||
| Unknown | 1 (2.6) | — | ||
| Total body irradiation | ||||
| Yes | 12 (31.6) | 4 (10.8) | ||
| No | 25 (65.8) | 33 (89.2) | ||
| Unknown | 1 (2.6) | — | ||
| Chimerism, median (range), % | ||||
| No GVHD | 100 (86-100) | 100 (60-100) | ||
| GVHD | 100 (81-100) | 100 (97-100) | ||
| Unknown | 4 (10.5) | — | ||
| GVHD status | ||||
| GVHD | 16 (42.1) | 19 (51.4) | ||
| No GVHD | 22 (57.9) | 18 (48.6) | ||
| GVHD grade | ||||
| Grade 1 | 8 (50) | 1 (5.3) | ||
| Grade 2 | 5 (31.1) | 16 (84.1) | ||
| Grade 3 | 1 (6.3) | 1 (5.3) | ||
| Grade 4 | 1 (6.3) | 1 (5.3) | ||
| Unknown | 1 (6.3) | — | ||
| Delay sample-graft, median (range), d | ||||
| Donors | −27 (−136 to 0) | −27 (−119 to −1) | ||
| GVHD onset | 29 (12-91) | 36 (9-94) | ||
| No GVHD | 91 (27-108) | 90 (77-95) | ||
| GVHD prophylaxis | ||||
| CSA | 7 (18.4) | 2 (5.4) | ||
| CSA+MMF | 8 (21.1) | 26 (70.3) | ||
| CSA+MTX | 22 (57.9) | 8 (21.6) | ||
| None | 0 | 1 (2.7) | ||
| Unknown | 1 (2.6) | — | ||
| Diagnosis | ||||
| Acute leukemia | 17 (44.7) | 13 (35.2) | ||
| Myeloproliferative neoplasm | 3 (7.9) | 8 (21.6) | ||
| Lymphoma | 8 (21.1) | 5 (13.5) | ||
| Myeloma | 2 (5.3) | 3 (8.1) | ||
| Myelodysplastic syndrome | 4 (10.5) | 2 (5.4) | ||
| Aplastic anemia | 1 (2.6) | 3 (8.1) | ||
| Chronic lymphoid leukemia | 1 (2.6) | 2 (5.4) | ||
| Other diagnosis | 2 (5.3) | 1 (2.7) | ||
| CMV serostatus | ||||
| Positive | 22 (56.4) | 20 (52.6) | 23 (54.8) | 29 (78.4) |
| Negative | 16 (41) | 16 (42.1) | 19 (45.2) | 8 (21.6) |
| Unknown | 1 (2.6) | 2 (5.3) | — | — |
| CMV status mismatch | ||||
| D+/R+ | 13 (34.2) | 21 (56.8) | ||
| D−/R− | 8 (21.1) | 7 (18.9) | ||
| D+/R− | 8 (21.1) | 1 (2.7) | ||
| D−/R+ | 7 (18.4) | 8 (21.6) | ||
Unless otherwise noted, data are n (%).
CMV, cytomegalovirus; CSA, cyclosporine A; D, donor; MMF, mycophenolate mofetil; MTX, methotrexate; R, recipient; —, none; −, negative; +, positive.
All patients gave their written consent for clinical research. This noninterventional research study, with no additional clinical procedure, was carried out in accordance with the Declaration of Helsinki. Data analyses were carried out using a database with all patient identifiers removed. This study was declared to the Commission National Informatique et Liberté and was approved by the local ethics committee and Institutional Review Board (IRB 00003835).
Spectral flow cytometry
Multicolor flow cytometric analysis was performed using a SP6800 Spectral Cell Analyzer (Sony Biotechnology), as described in detail in supplemental Material and methods. Cells were stained with the following anti-human monoclonal antibodies: anti-CD95, anti-CD3, anti-CD45RO, anti-CD8, anti-CD279 (PD1), anti-CD27, anti-CD196 (CCR6), anti-CD4, anti-CD45RA, and anti-CD122 (interleukin-2RB [IL-2RB]). A dump channel included anti-CD11c, anti-CD14, anti-CD19, and anti-CD34.
A second antibody panel, including intracellular markers, was used to analyze regulatory T cells (Tregs) with the following anti-human monoclonal antibodies: anti-CD25, anti-CD3, anti-CD4, anti-CD8, anti-CD27, anti-CD279 (PD1), anti-CD45RA, anti-CD278 (ICOS), and anti-CD127. After permeabilization, cells were stained with anti-FOXP3, anti-Ki67, and anti-CD152 (CTLA4).
Cell isolation and gene-expression analysis
Gene expression in sorted CD4+ and CD8+ T cells was assessed using the nCounter Human Immunology V2 codeset (NanoString Technologies), as described previously12-14 (see supplemental Material and methods for details).
Results
The T-cell compartment is skewed toward an effector memory phenotype early after HCT in patients without aGVHD
We evaluated the reconstitution patterns of different T-cell subsets at day 90 after transplantation in 2 independent cohorts of patients undergoing allo-HCT, as well as in their respective identical sibling donors. To avoid potential confounding effects related to aGVHD, only donor-recipient pairs without aGVHD were included in this analysis. Donor and patient characteristics and the study design are shown in Table 1 and supplemental Figure 1, respectively.
Cellular profiling of recipients 3 months post-HCT showed an incomplete reconstitution of the T-cell compartment, with decreased CD3+ T lymphocytes, compared with their respective donors. Within the CD3+ T-cell population, significantly decreased frequencies of CD4+ T cells and increased frequencies of CD8+ T cells were observed in both cohorts (Figure 1A; supplemental Figure 2A), resulting in an inversion of the normal CD4/CD8 ratio (Figure 1B; supplemental Figure 2B).
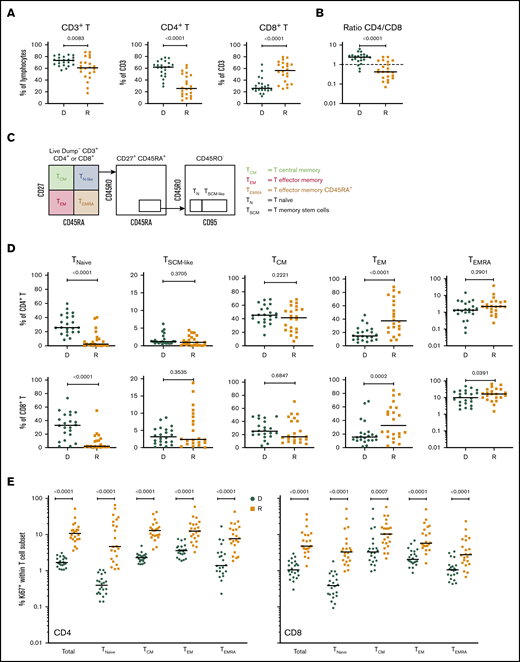
T-cell compartment in recipients without aGVHD after HCT. Shown are results for donor/recipient couples without aGVHD from cohort 1. (A) Frequency of CD3+ T cells within the lymphocyte population (left panel) and frequencies of CD4+ (middle panel) and CD8+ (right panel) T cells within CD3+ T cells. (B) Ratio of CD4+/CD8+ T cells in recipients (R) at day 90 post-HCT compared with their respective sibling donors (D). (C) Gating strategy used to identify naive and memory subsets within the CD4+ and CD8+ T-cell compartments in donors and recipients after transplantation by polychromatic flow cytometry. (D) Frequencies of TNaive, TSCM-like, TCM, TEM, and TEMRA cells within the CD4+ (upper panels) and CD8+ (lower panels) T-cell compartments in recipients (R) at day 90 post-HCT compared with their respective sibling donors (D). (E) Frequency of proliferating Ki-67+ cells in total CD4+ and CD8+ T cells and in the different naive and memory subsets in CD4+ (left panel) and CD8+ (right panel) compartments in donors and recipients. The frequency of Ki-67+ cells is represented as the percentage of Ki-67–expressing cells within total CD4+ or CD8+ T cells and as the percentage Ki-67–expressing cells within the parent gate for TNaive, TCM, TEM, and TEMRA cell subsets. Horizontal lines indicate the median. P values were calculated using the Wilcoxon matched-pairs Student t test (donor vs respective recipient). Differences are considered significant for P < .05.
T-cell compartment in recipients without aGVHD after HCT. Shown are results for donor/recipient couples without aGVHD from cohort 1. (A) Frequency of CD3+ T cells within the lymphocyte population (left panel) and frequencies of CD4+ (middle panel) and CD8+ (right panel) T cells within CD3+ T cells. (B) Ratio of CD4+/CD8+ T cells in recipients (R) at day 90 post-HCT compared with their respective sibling donors (D). (C) Gating strategy used to identify naive and memory subsets within the CD4+ and CD8+ T-cell compartments in donors and recipients after transplantation by polychromatic flow cytometry. (D) Frequencies of TNaive, TSCM-like, TCM, TEM, and TEMRA cells within the CD4+ (upper panels) and CD8+ (lower panels) T-cell compartments in recipients (R) at day 90 post-HCT compared with their respective sibling donors (D). (E) Frequency of proliferating Ki-67+ cells in total CD4+ and CD8+ T cells and in the different naive and memory subsets in CD4+ (left panel) and CD8+ (right panel) compartments in donors and recipients. The frequency of Ki-67+ cells is represented as the percentage of Ki-67–expressing cells within total CD4+ or CD8+ T cells and as the percentage Ki-67–expressing cells within the parent gate for TNaive, TCM, TEM, and TEMRA cell subsets. Horizontal lines indicate the median. P values were calculated using the Wilcoxon matched-pairs Student t test (donor vs respective recipient). Differences are considered significant for P < .05.
We next assessed whether early T-cell reconstitution was associated with imbalances in the distributions of naive and memory T-cell subsets in recipients after transplantation. Compared with their donors, recipients had a significant reduction in CD4+ and CD8+ naive T (TNaive) cells, paralleled by an increase in effector memory T cells (TEMs), in both cohorts (Figure 1C-D; supplemental Figure 2C). We also observed an increase in the terminally differentiated effector memory cells re-expressing CD45RA (TEMRA) subset in recipients; it was more pronounced within the CD8+ population, but it was also present in the CD4+ T-cell compartment, in particular in cohort 2 (Figure 1D; supplemental Figure 2D). Analysis of Ki-67 expression revealed a strong increase in the proliferation of CD4+ and CD8+ TNaive cell and memory T-cell subsets in recipients compared with their donors (Figure 1E; supplemental Figure 2D). A significant reduction in CD4+ and CD8+ TNaive cells and an increase in effector CD4+ T cells were also observed in recipients at the onset of aGVHD compared with their donors in both cohorts (supplemental Figure 3).
Increased Treg proliferation and expression of functional markers in recipients after HCT
Given the importance of Tregs in GVHD prevention and HCT outcome,13,15,16 we investigated CD4+FOXP3+ Tregs in recipients without aGVHD compared with their sibling donors. Recipients showed a significant increase in CD4+FOXP3+ Tregs compared with their donors (Figure 2A), and the CD4+FOXP3+ Treg subset displayed increased frequency of Ki-67+ cells in the recipients early post-HCT compared with their donors (Figure 2B). Our data also revealed an increased frequency of Ki-67+ cells within Tregs compared with conventional CD4+ T cells (Tconvs) in recipients following transplantation (Figure 2C, left panel). These data indicate that, in the lymphopenic environment of the host, Tconvs and Tregs undergo strong proliferation compared with healthy donors. The ratio of proliferating Tregs/Tconvs is higher in donors than in recipients (Figure 2C, right panel) because of the low proliferation of Tconvs in donors (Figure 1E). In recipients without aGVHD, an enrichment of Tregs expressing the functional markers CTLA4, ICOS, and PD-1 was also observed (Figure 2D), suggesting a counterbalancing mechanism to suppress alloreactivity and maintain tolerance in the proinflammatory environment of the host.
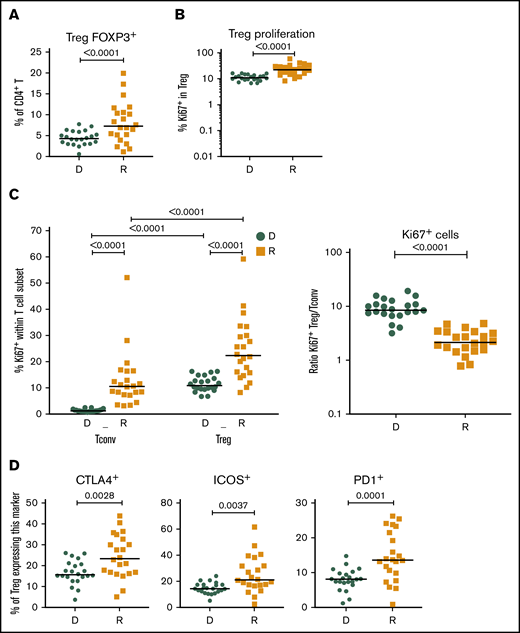
Treg homeostasis in recipients without aGVHD after HCT. Shown are results for donor/recipients couples without aGVHD from cohort 1. (A) Frequency of FOXP3+ cells within the CD4+ population in donors (D) and recipients (R) at day 90 post-HCT. (B) Frequencies of Ki-67+, within the CD4+ FOXP3+ Treg population, in donors (D) and recipients (R) at day 90 post-HCT. (C) Frequency of proliferating (Ki-67+) cells within the CD4+FOXP3+ Treg and CD4+FOXP3− Tconv populations in donors (D) and recipients (R) (left panel) and ratios of proliferating (Ki-67+) Treg/Tconv in donors (D) and recipients (R) at day 90 post-HCT (right panel). (D) Frequencies of CTLA4+, ICOS+, and PD1+ cells within the CD4+FOXP3+ Treg population in donors (D) and recipients (R) at day 90 post-HCT. Horizontal lines indicate the median. P values were calculated using a Wilcoxon matched-pairs Student t test or a Mann-Whitney U test. Differences are considered significant for P < .05.
Treg homeostasis in recipients without aGVHD after HCT. Shown are results for donor/recipients couples without aGVHD from cohort 1. (A) Frequency of FOXP3+ cells within the CD4+ population in donors (D) and recipients (R) at day 90 post-HCT. (B) Frequencies of Ki-67+, within the CD4+ FOXP3+ Treg population, in donors (D) and recipients (R) at day 90 post-HCT. (C) Frequency of proliferating (Ki-67+) cells within the CD4+FOXP3+ Treg and CD4+FOXP3− Tconv populations in donors (D) and recipients (R) (left panel) and ratios of proliferating (Ki-67+) Treg/Tconv in donors (D) and recipients (R) at day 90 post-HCT (right panel). (D) Frequencies of CTLA4+, ICOS+, and PD1+ cells within the CD4+FOXP3+ Treg population in donors (D) and recipients (R) at day 90 post-HCT. Horizontal lines indicate the median. P values were calculated using a Wilcoxon matched-pairs Student t test or a Mann-Whitney U test. Differences are considered significant for P < .05.
Major changes in the T-cell gene-expression profiles in patients without aGVHD compared with their sibling donors
To gain insight into the molecular changes associated with T-cell expansion early after HCT, we performed gene-expression profiling on sorted CD4+ and CD8+ T cells from donors before transplant and on day 90 post-HCT from recipients without aGVHD. Principal component analysis revealed a clear separation of the CD4+ and CD8+ T-cell gene-expression profiles, whereas samples from the 2 cohorts are homogeneously mixed, indicating the absence of “batch effects” between cohorts (supplemental Figure 4A). Principal component analysis also showed a clear separation between donor and recipient samples in CD4+ and CD8+ T-cell populations (supplemental Figure 4B).
Differential expression analysis showed that, in recipients, the majority of the genes analyzed are upregulated and only few genes are downregulated in the CD4+ and CD8+ T-cell populations. Importantly, a high degree of overlap of the differentially expressed genes between the 2 cohorts was observed, with changes in gene expression occurring in the same direction (supplemental Figure 4C-D), demonstrating the robustness of our observations.
A modular transcriptional framework reveals altered biological pathways and molecular processes in T cells following HCT
To characterize the signaling pathways and the molecular functions that are altered in T cells after transplantation, we performed a pathway analysis on the T-cell gene-expression profiles from donors and recipients using Quantitative Set Analysis for Gene Expression (QuSAGE),17 which quantifies gene module activity as a shift in the mean differential expression of the individual genes included in the module. We designed 51 gene modules by grouping genes belonging to specific signaling pathways, associated with particular cellular phenotypes, or with specific cellular functions, according to Molecular Signatures Database annotations18 and based on current knowledge in the literature (supplemental Table 1), and compared T-cell gene-expression profiles in recipients without aGVHD and in their sibling donors.
In CD4+ T cells, QuSAGE revealed 46 modules with statistically significantly increased pathway activity in recipients compared with donors. Conversely, only few gene sets showed decreased pathway activity, and none of these reached statistical significance (Figure 3A).
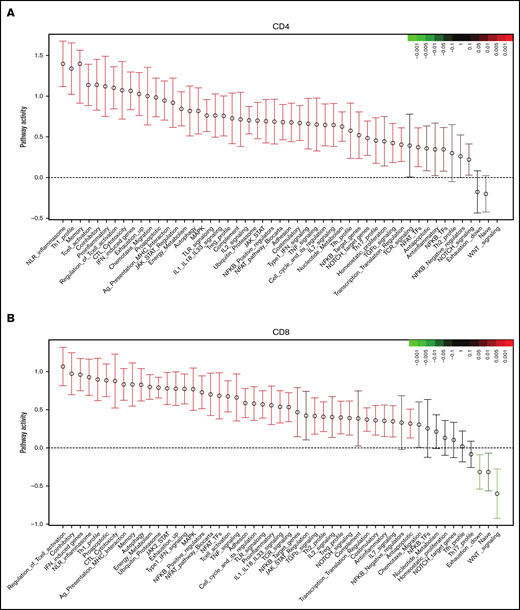
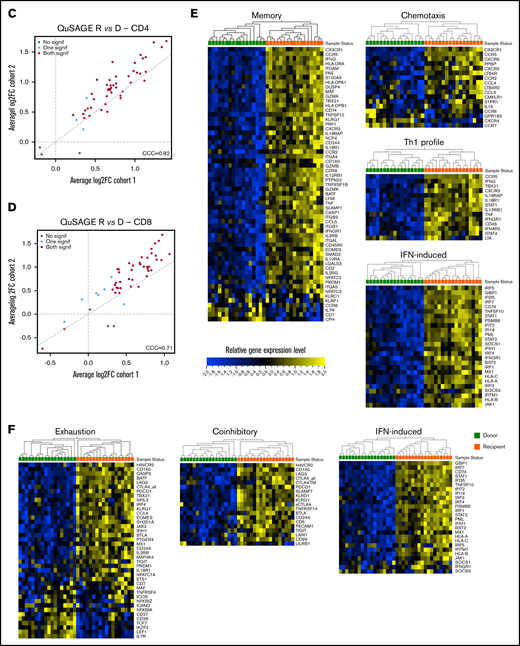
Molecular signature of T cells in recipients without aGVHD after HCT compared with their donors. QuSAGE of CD4+ (A) and CD8+ (B) T-cell gene-expression profiles in recipients at day 90 post-HCT compared with their respective donors before transplant in cohort 1. For each pathway, the mean fold change and the 95% confidence intervals are plotted and color-coded according to their FDR-corrected P values compared with 0. Red and green bars indicate a statistically significant increased or decreased pathway activity, respectively, in recipients compared with donors. Correlation between cohorts 1 and 2 for QuSAGE in CD4+ (C) and CD8+ (D) T cells. Red dots correspond to modules significantly enriched (FDR ≤ 0.05) in both cohorts, blue dots correspond to modules enriched in only 1 cohort, and black dots correspond to modules not enriched. The concordance correlation coefficient (CCC) is displayed to quantify the reproducibility of the results between the 2 cohorts. Relative gene-expression levels of genes in selected enriched modules in recipients at day 90 post-HCT compared with their respective donors before transplant in cohort 1 in CD4+ (E) and CD8+ (F) T cells. In the heat maps, columns represent samples and are ordered by hierarchical clustering, whereas rows represent genes and are ranked by fold change. Yellow indicates high levels of expression, and blue indicates low levels of expression. Ag, antigen; CTL, cytotoxic T lymphocyte; MHC, major histocompatibility complex; TCR, T-cell receptor; TF, transcription factor; TGF, transforming growth factor; TLR, Toll-like receptor; TNF, tumor necrosis factor.
Molecular signature of T cells in recipients without aGVHD after HCT compared with their donors. QuSAGE of CD4+ (A) and CD8+ (B) T-cell gene-expression profiles in recipients at day 90 post-HCT compared with their respective donors before transplant in cohort 1. For each pathway, the mean fold change and the 95% confidence intervals are plotted and color-coded according to their FDR-corrected P values compared with 0. Red and green bars indicate a statistically significant increased or decreased pathway activity, respectively, in recipients compared with donors. Correlation between cohorts 1 and 2 for QuSAGE in CD4+ (C) and CD8+ (D) T cells. Red dots correspond to modules significantly enriched (FDR ≤ 0.05) in both cohorts, blue dots correspond to modules enriched in only 1 cohort, and black dots correspond to modules not enriched. The concordance correlation coefficient (CCC) is displayed to quantify the reproducibility of the results between the 2 cohorts. Relative gene-expression levels of genes in selected enriched modules in recipients at day 90 post-HCT compared with their respective donors before transplant in cohort 1 in CD4+ (E) and CD8+ (F) T cells. In the heat maps, columns represent samples and are ordered by hierarchical clustering, whereas rows represent genes and are ranked by fold change. Yellow indicates high levels of expression, and blue indicates low levels of expression. Ag, antigen; CTL, cytotoxic T lymphocyte; MHC, major histocompatibility complex; TCR, T-cell receptor; TF, transcription factor; TGF, transforming growth factor; TLR, Toll-like receptor; TNF, tumor necrosis factor.
Among the modules with the greatest increase in pathway activity in recipients and the lowest false discovery rate (FDR), were the “NLR inflammasome,” the “T helper 1 (Th1) profile,” and the “Memory” module, which includes genes enriched in memory T cells, followed by gene sets related to T-cell activation and cytotoxicity, interferon (IFN)-induced genes, genes associated with exhausted cells, and proapoptotic genes. The modules showing reduced pathway activity in recipients were the “Naive” module, regrouping genes upregulated in TNaive cells, and the “WNT signaling” module (Figure 3A; supplemental Table 2).
QuSAGE of the gene-expression profiles of CD8+ T cells (Figure 3B) showed that 43 gene modules were significantly different between donors and recipients: 40 had significantly increased pathway activity and 3 displayed significantly decreased pathway activity in recipients. Among the gene sets with the strongest and most significant increases in pathway activity, we found genes related to T-cell activation and coinhibitory molecules, IFN-induced genes, genes upregulated in memory T cells, proapoptotic genes, and genes upregulated in exhausted cells (“Exhaustion_up”). Interestingly, in CD8+ T cells, we also observed modules displaying a significant reduction in pathway activity in recipients compared with donors. In particular, the “WNT signaling” module, the “Naive” module, and the “Exhaustion_down” module, including genes downregulated in exhausted T cells, had decreased pathway activity (Figure 3B; supplemental Table 3). Among the 40 gene modules upregulated in CD8+ T cells, 38 were also upregulated in CD4+ T cells, suggesting a large overlap in the signaling pathways affected by HCT in the 2 T-cell subsets (supplemental Figure 5).
The pathway activity of the gene modules showed a good correlation in the 2 cohorts (Figure 3C-D). Moreover, the ranking of the modules based on the pathway activity is similar (supplemental Figure 6A-B; supplemental Tables 2 through 5), indicating that the gene-expression signature associated with HCT and immune reconstitution is reproduced in 2 independent cohorts.
Closer inspection of individual genes within enriched modules showed that CD4+ T cells in recipients displayed a gene-expression profile skewed toward the Th1 phenotype, with upregulation of genes such as TBX21, IFNG, and CXCR3. We also observed upregulation of genes involved in T-cell migration, such as the chemokine receptors CX3CR1, CCR5, CXCR3, CCR2, and CCR6, as well as many IFN-induced genes (Figure 3E).
Within the CD8+ subset (Figure 3F), we noted upregulation of IFN-induced genes, as well as an enrichment of inhibitory receptors (HAVCR2, CD160, PDCD1, CTLA4, LAG3, KLRD1, CD244, KLRG1, SLAMF7) and genes associated with exhausted cells (HAVCR2, BATF, CD160, PDCD1, CTLA4, EOMES, TBX21, LAG3, CASP3, CD244, KLRG1, SH2D1A)19-22 .
Consistent with the flow cytometry data showing a depletion of the TNaive cell pool and an increase in cells with an effector memory phenotype after HCT (Figure 1D), we observed an enrichment of many genes upregulated in memory cells (eg, CD45R0, CD74, KLRG1, IL2RB, FAS), whereas TNaive cell–associated genes (eg, CCR7, LEF1, TCF7)23-27 were underrepresented in recipients (Figure 3E-F; supplemental Figure 7).
Cellular correlates of aGVHD onset in recipients following HCT
To identify potential “pathogenic” T-cell subsets associated with aGVHD onset, we next assessed whether the frequency of the different T-cell subsets and their proliferative status were altered in recipients developing aGVHD, before administration of any steroid therapy, compared with patients without aGVHD.
To increase the power of our analysis, we combined the samples from the 2 cohorts. We focused our analysis on recipients with grade 2-4 aGVHD to better identify changes associated with aGVHD. Compared with recipients without aGVHD (n = 36), at aGVHD onset, patients (n = 22) showed significantly increased frequencies of CD4+ T cells and decreased CD8+ T cells (supplemental Figure 8A), leading to a CD4/CD8 ratio generally >1 (supplemental Figure 8B). This contrasts with the posttransplant situation in patients without aGVHD, which is characterized by an inverted CD4/CD8 ratio (Figure 1B).
Analysis of the TNaive cell and memory T-cell subsets revealed that, at aGVHD onset, recipients have significant increases in cells with a T memory stem cell-like (TSCM-like) or a central memory T cell (TCM) phenotype compared with recipients without aGVHD, whereas TEM cells were decreased in the CD4+ and CD8+ compartments (supplemental Figure 8C). Increased cell proliferation was also observed at aGVHD onset in CD4+ and CD8+ compartments for TNaive, TCM, and TEM subsets, as well as within the CD4+ compartment for the TEMRA subset (supplemental Figure 8D). Very similar results were obtained when the recipient/donor ratios of cell populations were compared for No GVHD couples vs aGVHD couples (Figure 4). In particular, we noted a significant expansion of TSCM-like relative to the donor sample in the CD4 and CD8 compartments in aGVHD couples (Figure 4).
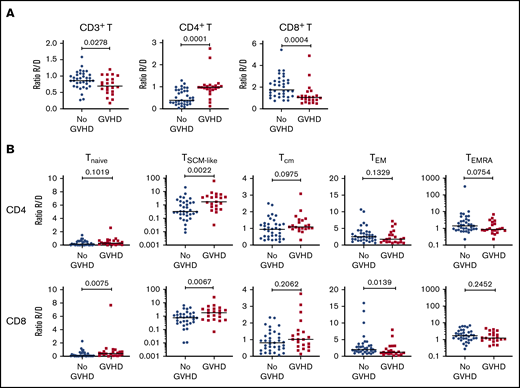
Cellular correlates of aGVHD onset. (A) Ratios of the frequency of CD3+ T cells within lymphocytes (left panel), CD4+ T cells within CD3+ T cells (middle panel), and CD8+ T cells within CD3+ T cells (right panel) between recipients and donors (R/D) in aGVHD vs No aGVHD couples. (B) Ratios of the frequency of TNaive, TSCM-like, TCM, TEM, and TEMRA cells within CD4+ cells (upper panels) and CD8+ cells (lower panels) between R/D in aGVHD vs No aGVHD couples. Horizontal lines indicate the median. For this analysis, samples from the 2 cohorts were pooled. All recipients without aGVHD or with grade ≥2 aGVHD were included in the analysis (No GVHD, n = 36; GVHD, n = 22). P values were calculated using the Mann-Whitney U test; differences are considered significant for P < .05.
Cellular correlates of aGVHD onset. (A) Ratios of the frequency of CD3+ T cells within lymphocytes (left panel), CD4+ T cells within CD3+ T cells (middle panel), and CD8+ T cells within CD3+ T cells (right panel) between recipients and donors (R/D) in aGVHD vs No aGVHD couples. (B) Ratios of the frequency of TNaive, TSCM-like, TCM, TEM, and TEMRA cells within CD4+ cells (upper panels) and CD8+ cells (lower panels) between R/D in aGVHD vs No aGVHD couples. Horizontal lines indicate the median. For this analysis, samples from the 2 cohorts were pooled. All recipients without aGVHD or with grade ≥2 aGVHD were included in the analysis (No GVHD, n = 36; GVHD, n = 22). P values were calculated using the Mann-Whitney U test; differences are considered significant for P < .05.
T-cell transcriptional profiling at aGVHD onset reveals upregulation of proinflammatory mediators and downregulation of genes involved in immune regulation
The mechanisms underlying the immune escape and alloreactivity that occur, despite ongoing immunosuppression, and lead to aGVHD development in humans are still unclear. We performed gene-expression profiling on sorted CD4+ and CD8+ T cells from recipients without aGVHD and at aGVHD onset, before the start of steroid therapy. We used the same inclusion criteria as for the previous cellular profiling analysis (Figure 4; supplemental Figure 8D).
Gene-expression profiles of CD4+ T cells showed differential expression of 18 genes in patients with aGVHD compared with No GVHD recipients (FDR < 0.05). Of these, 2 were expressed at higher levels and 16 were expressed at lower levels in patients with aGVHD (Figure 5A). QuSAGE revealed 6 modules with significantly decreased pathway activity at aGVHD onset. Interestingly, genes associated with “transforming growth factor-β (TGF-β) signaling” were downregulated most significantly (Figure 5B; supplemental Table 6). Closer inspection of the differentially expressed transcripts within this module showed that CD4+ T cells from recipients at aGVHD onset had significantly lower expression levels of genes encoding TGFBR1, SMAD3, and IGF2R compared with the No GVHD group (Figure 5C). In contrast, we noticed increased levels of genes involved in the NF-κB signaling pathway (eg, BCL10 and BCL3) at aGVHD onset. Expression of PSMD7, encoding a component of the 26S proteasome, and of ICOS (Figure 5D), a member of the CD28 superfamily, induced in CD4+ and CD8+ T cells during T-cell activation,28 was also higher at aGVHD onset.
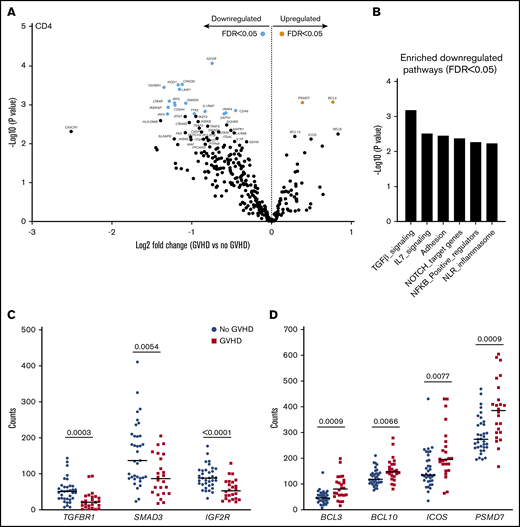
CD4+T-cell gene-expression signature at aGVHD onset. For this analysis, samples from the 2 cohorts were pooled. All recipients without aGVHD or with grade ≥2 aGVHD were included in the analysis (No GVHD, n = 35; GVHD, n = 24). (A) Gene-expression profiles of CD4+ T cells from 24 patients at aGVHD onset compared with 35 patients without aGVHD in cohorts 1 and 2. Orange and light blue dots represent transcripts that were significantly up- and downregulated in recipients at aGVHD onset compared with No GVHD recipients, respectively, with FDR < 0.05. P values were calculated using an unpaired Student t test. Adjusted P values (FDR) were calculated using the Benjamini-Hochberg method to correct for multiple comparisons. (B) Results of QuSAGE conducted on CD4+ T-cell gene-expression profiles from aGVHD and No GVHD recipients. Plotted is the negative logarithm to the base 10 of the P values for the 6 modules with significantly different pathway activity (FDR < 0.05) at GVHD onset compared with No GVHD recipients. (C) Transcript levels of TGFBR1, SMAD3, and IGF2R in CD4+ T cells from recipients without aGVHD (No GVHD) and at aGVHD onset (GVHD). These genes showed decreased expression at aGVHD onset compared with recipients without GVHD (P < .05; FDR < 0.1). (D) Transcript levels of BCL3, BCL10, ICOS, and PSMD7 in CD4+ T cells from recipients without aGVHD and at aGVHD onset. These genes showed increased expression at aGVHD onset compared with recipients without aGVHD (P < .05; FDR < 0.1). P values were calculated using an unpaired Student t test. Adjusted P values (FDR) were calculated using the Benjamini-Hochberg method to correct for multiple comparisons. Nominal P values are shown in panels B and D.
CD4+T-cell gene-expression signature at aGVHD onset. For this analysis, samples from the 2 cohorts were pooled. All recipients without aGVHD or with grade ≥2 aGVHD were included in the analysis (No GVHD, n = 35; GVHD, n = 24). (A) Gene-expression profiles of CD4+ T cells from 24 patients at aGVHD onset compared with 35 patients without aGVHD in cohorts 1 and 2. Orange and light blue dots represent transcripts that were significantly up- and downregulated in recipients at aGVHD onset compared with No GVHD recipients, respectively, with FDR < 0.05. P values were calculated using an unpaired Student t test. Adjusted P values (FDR) were calculated using the Benjamini-Hochberg method to correct for multiple comparisons. (B) Results of QuSAGE conducted on CD4+ T-cell gene-expression profiles from aGVHD and No GVHD recipients. Plotted is the negative logarithm to the base 10 of the P values for the 6 modules with significantly different pathway activity (FDR < 0.05) at GVHD onset compared with No GVHD recipients. (C) Transcript levels of TGFBR1, SMAD3, and IGF2R in CD4+ T cells from recipients without aGVHD (No GVHD) and at aGVHD onset (GVHD). These genes showed decreased expression at aGVHD onset compared with recipients without GVHD (P < .05; FDR < 0.1). (D) Transcript levels of BCL3, BCL10, ICOS, and PSMD7 in CD4+ T cells from recipients without aGVHD and at aGVHD onset. These genes showed increased expression at aGVHD onset compared with recipients without aGVHD (P < .05; FDR < 0.1). P values were calculated using an unpaired Student t test. Adjusted P values (FDR) were calculated using the Benjamini-Hochberg method to correct for multiple comparisons. Nominal P values are shown in panels B and D.
CD8+ T cells from recipients at aGVHD onset showed differential expression of 134 genes compared with recipients without aGVHD (FDR < 0.05): higher expression levels for 23 genes and lower levels for 111 transcripts at aGVHD onset (Figure 6A). Among the transcripts with higher levels in patients with aGVHD were genes involved in NF-κB signaling (NFKB1, BCL3) and the negative regulator NFKBIA. Similarly to CD4+ T cells, PSMD7 and ICOS showed higher expression in patients with aGVHD. In addition, CD8+ T cells displayed increased expression of the costimulatory molecule CD28, the inflammatory mediator MIF, and the glycolytic enzyme GAPDH (Figure 6B). The switch from oxidative phosphorylation to aerobic glycolysis is a hallmark of T-cell activation, and aerobic glycolysis was shown to facilitate full effector status and IFN-γ production in T cells.29
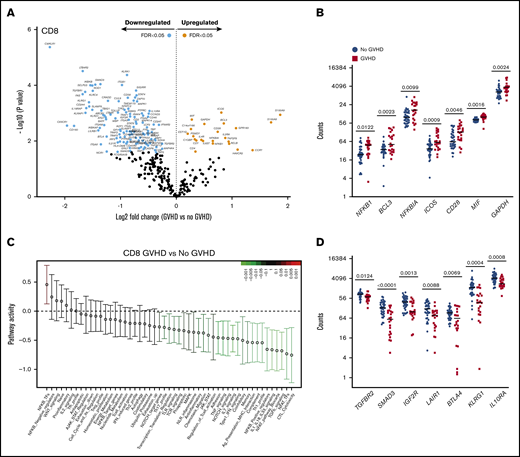
CD8+T-cell gene-expression signature at aGVHD onset. For this analysis, samples from the 2 cohorts were pooled. All recipients without aGVHD or with aGVHD grade ≥2 were included in the analysis (No GVHD, n = 36; GVHD, n = 22). (A) Gene-expression profiles of CD8+ T cells from 22 patients at aGVHD onset compared with 36 patients without aGVHD in cohorts 1 and 2. Orange and light blue dots represent transcripts that were significantly up- or downregulated in recipients at aGVHD onset compared with No GVHD recipients, respectively, with FDR < 0.05. P values were calculated using an unpaired Student t test. Adjusted P values (FDR) were calculated using the Benjamini-Hochberg method to correct for multiple comparisons. (B) Transcript levels of NFKB1, BCL3, NFKBIA, ICOS, CD28, MIF, and GAPDH in CD8+ T cells from recipients without aGVHD and at aGVHD onset. These genes showed increased expression at aGVHD onset compared with recipients without GVHD (P < .05; FDR < 0.05). (C) QuSAGE of CD8+ T-cell gene-expression profiles in recipients at aGVHD onset compared with recipients without aGVHD from cohorts 1 and 2. For each pathway, the mean fold change and the 95% confidence intervals are plotted and color-coded according to their FDR-corrected P values compared with 0. Red and green bars indicate a statistically significant increased or decreased pathway activity, respectively, in recipients at aGVHD onset compared with recipients without GVHD. (D) Transcript levels of TGFBR2, SMAD3, IGFR2, LAIR1, BTLA, KLRG1, and IL10RA in CD8+ T cells from recipients without aGVHD and at aGVHD onset. These genes showed decreased expression at aGVHD onset compared with recipients without aGVHD (P < .05; FDR < 0.05). P values were calculated using an unpaired Student t test. Adjusted P values (FDR) were calculated using the Benjamini-Hochberg method to correct for multiple comparisons. Nominal P values are shown in panels C and D. Tfh, T follicular helper cell.
CD8+T-cell gene-expression signature at aGVHD onset. For this analysis, samples from the 2 cohorts were pooled. All recipients without aGVHD or with aGVHD grade ≥2 were included in the analysis (No GVHD, n = 36; GVHD, n = 22). (A) Gene-expression profiles of CD8+ T cells from 22 patients at aGVHD onset compared with 36 patients without aGVHD in cohorts 1 and 2. Orange and light blue dots represent transcripts that were significantly up- or downregulated in recipients at aGVHD onset compared with No GVHD recipients, respectively, with FDR < 0.05. P values were calculated using an unpaired Student t test. Adjusted P values (FDR) were calculated using the Benjamini-Hochberg method to correct for multiple comparisons. (B) Transcript levels of NFKB1, BCL3, NFKBIA, ICOS, CD28, MIF, and GAPDH in CD8+ T cells from recipients without aGVHD and at aGVHD onset. These genes showed increased expression at aGVHD onset compared with recipients without GVHD (P < .05; FDR < 0.05). (C) QuSAGE of CD8+ T-cell gene-expression profiles in recipients at aGVHD onset compared with recipients without aGVHD from cohorts 1 and 2. For each pathway, the mean fold change and the 95% confidence intervals are plotted and color-coded according to their FDR-corrected P values compared with 0. Red and green bars indicate a statistically significant increased or decreased pathway activity, respectively, in recipients at aGVHD onset compared with recipients without GVHD. (D) Transcript levels of TGFBR2, SMAD3, IGFR2, LAIR1, BTLA, KLRG1, and IL10RA in CD8+ T cells from recipients without aGVHD and at aGVHD onset. These genes showed decreased expression at aGVHD onset compared with recipients without aGVHD (P < .05; FDR < 0.05). P values were calculated using an unpaired Student t test. Adjusted P values (FDR) were calculated using the Benjamini-Hochberg method to correct for multiple comparisons. Nominal P values are shown in panels C and D. Tfh, T follicular helper cell.
QuSAGE identified 24 gene modules that were significantly different between patients with and without aGVHD (Figure 6C; supplemental Table 7). Of these, 23 modules had significantly decreased pathway activity, and only 1 module had significantly higher activity, at aGVHD onset. The latter is the “NF-κB–TFs” module, which includes the NF-κB transcription factors NFKB1, NFKB2, RELA, and RELB, suggesting an important role for the NF-κB signaling pathway in alloreactive T cells mediating aGVHD in humans.
Similarly to CD4+ T cells, the “TGF-β signaling” module was most significantly downregulated in CD8+ T cells at aGVHD onset (Figure 6C; supplemental Table 7; P = .00005; FDR = 0.002). We also observed the “Coinhibitory” and “Anti-inflammatory” modules among those with significantly lower pathway activity. Transcript levels of representative genes belonging to these modules are shown in Figure 6D. We found downregulation of genes involved in TGF-β signaling (TGFBR2, SMAD3, IGF2R), as well as genes encoding inhibitory receptors (LAIR1, BTLA, KLRG1)30-33 and molecules mediating immunosuppressive signals (IL10RA),34 suggesting that decreased expression of genes involved in regulation and dampening of immune responses may be implicated in the development of aGVHD.
Discussion
In this study, we investigated the cellular and molecular mechanisms underlying aGVHD development or the absence of significant aGVHD at 3 months posttransplant in 2 cohorts of patients undergoing allo-HCT from their HLA-identical sibling donors. We provide one of the first transcriptional analyses of sorted CD4+ and CD8+ T cells showing striking differences between healthy donors and recipients without aGVHD, as well as noticeable differences in patients with and without aGVHD. To the best of our knowledge, an analysis of T-cell gene-expression profiles at steady-state in healthy donors vs allogeneic recipients without aGVHD in the same system has not been performed.
Although previous work in an experimental mouse model has demonstrated that naive cells are more likely to respond to weak- or low-affinity antigens in lymphopenic conditions,35 and that homeostatic proliferation of TNaive cells is associated with the acquisition of a memory-like phenotype in these conditions,36 data on early immune reconstitution are scarce. The largest cohort analyzed so far,37 included only the simultaneous study of 5 surface T-cell markers; most studies aiming to analyze T-cell reconstitution posttransplantation were performed at a later time point.3,8,16,38 The simultaneous analysis of multiple surface and intracellular markers of Tregs and Tconvs was facilitated by the use of spectral flow cytometry, which allowed the analysis of limited numbers of cells for each patient sample. The introduction of mass cytometry would allow an even more comprehensive analysis of immune cells38 ; however, this technology was not accessible when this study was designed.
In patients without aGVHD, we found an incomplete reconstitution of the T-cell compartment after transplant with a bias toward an effector/memory phenotype and a depletion of TNaive cells compared with their sibling donors. We noted increased proliferation of all CD4+ and CD8+ TNaive and T memory subsets analyzed in recipients compared with donors. In particular, we found high proliferation of the Treg compartment, confirming our previous results and those from other investigators.13,16 Increased T-cell proliferation in recipients after HCT could be driven by increased availability of the homeostatic cytokines IL-7 and IL-15 after transplantation,16,39,40 as well as stimulation by the host alloantigens. Tregs in recipients may also acquire increased activity, as shown by increased expression of CTLA4 and ICOS, molecules of key importance for their suppressive functions.41,42
To investigate the molecular mechanisms underlying T-cell expansion after HCT, we analyzed gene expression in sorted CD4+ and CD8+ T cells from donors before transplant and from patients without aGVHD on day 90 post-HCT, using nCounter assays. This approach is well adapted to the analysis of the low T-cell numbers recovered, in particular in recipients post-HCT, and is very robust because no enzymatic reaction or polymerase chain reaction amplification is needed.14,43 Our gene-expression analysis revealed that HCT is associated with major transcriptional changes in CD4+ and CD8+ T cells in recipients compared with their donors.
We found that donor T cells react to the environment of the host by acquiring an activated phenotype with upregulation of genes associated with T-cell activation and its regulation, adhesion, and migration, as well as effector functions, especially linked to a Th1 cell profile and cytotoxicity. Consistent with our flow cytometry data, we observed an enrichment of many genes reported to be expressed in memory T cells and an underrepresentation of genes associated with TNaive cells. The increased activation may be associated with T-cell dysfunction, as suggested by the increased expression of proapoptotic genes and genes upregulated in exhausted cells.
Analysis of the different TNaive cell and memory T-cell subsets in recipients, using spectral flow cytometry, revealed that patients had a significant increase in CD4+ and CD8+ cells with a TSCM-like phenotype at aGVHD onset compared with recipients without aGVHD. T memory stem cells (TSCM) have been shown to sustain alloreactive T cells mediating GVHD upon serial transplantation into allogeneic hosts in mice.27 Gattinoni and colleagues reported the identification of TSCM in humans,44 but an association between this cell subset and human aGVHD has not been described. The ability of TSCM to sustain the generation of all memory and effector T-cell subsets while maintaining their own pool through self-renewal has important implications for aGVHD pathophysiology.27,44,45 TSCM cells could represent a cellular reservoir for alloreactive T cells in recipients developing GVHD, sustaining the production of alloreactive donor T cells in the presence of persistent antigens in hosts. Further investigation including additional markers for a more detailed phenotypic characterization, together with functional studies, may elucidate the role of this cell subset in aGVHD.
To investigate genes and pathways involved in aGVHD pathogenesis, we performed gene-expression profiling of sorted CD4+ and CD8+ T cells from recipients without aGVHD and at aGVHD onset, before the start of steroid therapy. With regard to the cellular profiling, we focused this analysis on recipients with grades 2-4 aGVHD.
Perreault et al performed CD4+ and CD8+ T-cell gene-expression profiling of donors and found that TGF-β signaling and genes implicated in cell proliferation characterized “dangerous” donors with regard to the recipient’s risk for developing chronic GVHD.46 Only a few other studies in small cohorts have analyzed the gene-expression profile associated with aGVHD in humans.47-49 These studies used microarray analyses of PBMCs47,49 or microbead-enriched immune cell subpopulations48 ; the sets of genes that were up- or downregulated before or at aGVHD onset in the different studies are not consistent, possibly because of the heterogeneity of the patient populations.
Our analysis of signaling pathways associated with aGVHD onset also showed downregulation of genes involved in TGF-β signaling,46 whereas genes involved in the NF-κB signaling pathway, which plays a central role in mediating T-cell receptor signaling and T-cell activation and differentiation,50 were upregulated at aGVHD onset. These data support an important role for the NF-κB pathway in alloreactive CD4+ and CD8+ T cells mediating human aGVHD. Consistently, inhibition of NF-κB was shown to protect mice from lethal GVHD.51
We noted that the proteasome subunit PSMD7 is expressed at higher levels in CD4+ and CD8+ T cells at aGVHD onset. Proteasome activity has been shown to induce memory at the expense of effector T-cell differentiation in a mouse model,52 consistent with the downregulation of the gene module “CTL cytotoxicity” that we observed at aGVHD onset in CD8+ T cells. These data are further corroborated by the higher frequencies of TSCM-like and TCM subsets and the lower frequencies of TEMs at aGVHD onset. Together, these findings may suggest an important role for memory T-cell subsets in aGVHD pathogenesis.
Finally, we found higher expression of ICOS in CD4+ and CD8+ T cells at aGVHD onset. This observation may be of particular interest, because previous studies in mouse models have established that using neutralizing anti-ICOS antibodies to block ICOS significantly ameliorated GVHD in multiple strain combinations, even when used in a therapeutic setting (injection 5 days after transplantation).53,54 More recently, Burlion and colleagues demonstrated that blockade of human ICOS prevented GVHD in a xenogeneic GVHD model, in which human PBMCs were transferred into irradiated immunocompromised NOD.SCID.γc−/− mice.55 Importantly, ICOS blockade did not reduce the graft-versus-leukemia effect. Higher ICOS expression in T cells at aGVHD onset may provide additional evidence to explore ICOS blockade as a therapeutic strategy for aGVHD treatment.
This study has some limitations. One issue is how to compare human immune dysregulation at disease onset. We designed the study to be able to compare our findings at disease onset with 2 “comparators”: the immune system at “baseline” (ie, data recovered from the donor samples) and recipients without aGVHD at day 90. Comparing patients at the onset of aGVHD with those without aGVHD leads to intrinsic differences between groups of patients (supplemental Figure 1B). Furthermore, we acknowledge that using day-90 profiles in patients without aGVHD as a comparator for profiles of patients with aGVHD at disease onset can be criticized. However, other comparators, such as patients without aGVHD at the same mean elapse time as those with aGVHD, was not chosen because these “non-GVHD” controls may eventually develop GVHD a few days after sampling at a time during which the processes were already ongoing. This was a discovery-driven study; future studies may address these potential confounders. In particular, future studies should be designed to include prospective phenotypic and molecular evaluation of T-cell subsets (including TSCM) at different time points (including disease onset) in all patients, considering for analyses patients classified as “no GVHD, active GVHD, or before the onset of GVHD” at a given time point. Other transplant-related factors (including the heterogeneity of GVHD prophylaxes) may have influenced our results, in particular in patients without aGVHD. This exploratory study was not designed or powered to evaluate these factors in multivariate analyses (which better reflect the multifactorial nature of allo-HCT).
However, this is the first study to integrate spectral flow cytometry and gene-expression profiling in the investigation of aGVHD at disease onset. Our data suggest that the integrated analysis of the distribution of different immune cell subsets with flow cytometry, together with gene-expression profiling, can contribute to the elucidation of the processes involved in aGVHD development in humans. Assessment of other potentially interesting cell subsets (eg, B-cell subsets, innate lymphoid cells), as well as single-cell gene expression and epigenetics analyses, will be of particular importance for future investigations to elucidate disease processes in humans and guide novel strategies for the prevention and treatment of GVHD.
Data sharing requests should be sent to Lars Rogge (lars.rogge@pasteur.fr) or Gérard Socié (gerard.socie@aphp.fr).
Acknowledgments
The authors thank all the members of the CRYOSTEM Consortium and the Francophone Society of Marrow Transplantations and Cellular Therapy for providing patient samples used in this study, as well as the Center for Translational Science/Cytometry Biomarkers Unit of Technology and Service (Institut Pasteur) for support in conducting this study.
This work was supported by grants from the Agence National de la Recherche (ANR-PRTS 13002), the Institut National du Cancer (INCa 2014-1-PL BIO-07-IP-1), and the Direction Générale de l’Offre de Soins, as well as by institutional funds from Institut Pasteur. E.L. was supported by a grant from the Université Paris Diderot and the Ministère de la Recherche. G.S. received a research grant from ALEXION Pharmaceuticals. The CRYOSTEM project is supported by a grant from the Institut National du Cancer and the Agence Nationale de la Recherche and is under the auspices of the Société Francophone de Greffe de Moelle et de Thérapie Cellulaire.
Authorship
Contribution: E.L. and C.L. performed experiments; E.L., C.L., D.M., E.B., and L.R. collected and analyzed the data; H.V. performed bioinformatics analyses; E.L., C.L., and H.V. prepared the figures; D.M. and G.S. had overall medical oversight, provided patient samples and clinical data, performed clinical data analysis, and revised the manuscript; R.P.d.L coordinated the CRYOSTEM Consortium and provided access to samples from cohort 1; E.L., E.B., G.S., and L.R. wrote the manuscript; L.R. and G.S. conceived the project, secured funding, and supervised the work; and all authors approved the final version of the manuscript.
Conflict-of-interest disclosure: The authors declare no competing financial interests.
A complete list of the members of the CRYOSTEM Consortium appears in the supplemental Data.
Correspondence: Lars Rogge, Immunoregulation Unit, Department of Immunology, Institut Pasteur, 25 Rue du Docteur Roux, 75015 Paris, France; e-mail: lars.rogge@pasteur.fr; and Gérard Socié, Service d’Hématologie Greffe, Hôpital Saint Louis, 1 Av Claude Vellefaux, 75010 Paris, France; e-mail: gerard.socie@aphp.fr.

