

Key Points
IDH1/2 mutations increase H3K79me2 and are found in 30% of KMT2APTD AMLs; however, mIDH1/2 and KMT2A alterations do not cooperate directly.
H3K79me2 is tightly regulated in KMT2A-rearrangement AML. Both decreases and increases result in decreased expression of KMT2A target genes.
Visual Abstract

Abstract
Understanding mechanisms of cooperation between oncogenes is critical for the development of novel therapies and rational combinations. Acute myeloid leukemia (AML) cells with KMT2A-fusions and KMT2A partial tandem duplications (KMT2APTD) are known to depend on the histone methyltransferase DOT1L, which methylates histone 3 lysine 79 (H3K79). About 30% of KMT2APTD AMLs carry mutations in IDH1/2 (mIDH1/2). Previous studies showed that 2-hydroxyglutarate produced by mIDH1/2 increases H3K79 methylation, and mIDH1/2 patient samples are sensitive to DOT1L inhibition. Together, these findings suggested that stabilization or increases in H3K79 methylation associated with IDH mutations support the proliferation of leukemias dependent on this mark. However, we found that mIDH1/2 and KMT2A alterations failed to cooperate in an experimental model. Instead, mIDH1/2 and 2-hydroxyglutarate exert toxic effects, specifically on KMT2A-rearranged AML cells (fusions/partial tandem duplications). Mechanistically, we uncover an epigenetic barrier to efficient cooperation; mIDH1/2 expression is associated with high global histone 3 lysine 79 dimethylation (H3K79me2) levels, whereas global H3K79me2 is obligate low in KMT2A-rearranged AML. Increasing H3K79me2 levels, specifically in KMT2A-rearrangement leukemias, resulted in transcriptional downregulation of KMT2A target genes and impaired leukemia cell growth. Our study details a complex genetic and epigenetic interaction of 2 classes of oncogenes, IDH1/2 mutations and KMT2A rearrangements, that is unexpected based on the high percentage of IDH mutations in KMT2APTD AML. KMT2A rearrangements are associated with a trend toward lower response rates to mIDH1/2 inhibitors. The substantial adaptation that has to occur for 2 initially counteracting mutations to be tolerated within the same leukemic cell may provide at least a partial explanation for this observation.
Introduction
Acute myeloid leukemia (AML) with rearrangements of the mixed lineage leukemia gene (MLL-r or KMT2A-r) are critically dependent on histone 3 lysine 79 dimethylation (H3K79me2), a histone modification that is associated with actively transcribed genes.1-6 Multiple studies have identified high levels of H3K79me2 specifically on genomic targets bound by KMT2A-fusion(s) (KMT2A-F), most notably the HOXA cluster.1,7,8 This epigenetic lesion can be targeted via inhibition of DOT1L, the only known histone 3 lysine 79 (H3K79) methyltransferase.9-11 Although H3K79 methylation is associated with active transcription, loss or inhibition of DOT1L and the subsequent decrease in H3K79me2 levels do not affect transcription of most genes. Rather, reduced H3K79me2 specifically affects transcription of KMT2A targets, leading to loss of expression of essential target genes, such as HOXA9 and MEIS1.1,8,12,13
KMT2A rearrangements encompass fusions and KMT2A partial tandem duplications (KMT2APTD). KMT2A-F account for 70% of infant leukemias and slightly less than 10% of childhood and adult leukemias. KMT2A-F are strongly transforming, and leukemias with KMT2A-F typically have few co-occurring mutations. In contrast, KMT2APTD are less strongly transforming in model systems and are predominantly found in older adults with multiple co-occurring mutations. The second most common alteration found with KMT2APTD is mutations in isocitrate dehydrogenase 1 or 2 (IDH1/2), occurring in 31% of patients.14 A single point mutation in the active site of IDH1/2 enables it to reduce α-ketoglutarate (αKG) to 2-hydroxyglutarate (2HG), a competitive inhibitor of αKG.15,16 Numerous enzymes rely on αKG as a cofactor; it affects cellular processes ranging from DNA, RNA, and histone methylation, to redox balance, mitochondrial respiration, and HIF signaling.17-20
Interestingly, a biological effect of mutant IDH1/2 (mIDH1/2) that has been consistently reported is an increase in H3K79me2 levels. This was observed upon exposure of glioma cell lines to 2HG,21 introduction of mIDH1 or mIDH2 into 3T3 cells,22 and in hematopoietic cells from mIDH1 knock-in mice.23 Furthermore, Sarkaria et al found patient samples with mIDH1/2 to be sensitive to DOT1L inhibition, even in the absence of a KMT2A alteration.24 This suggests that the increase in H3K79 methylation associated with IDH mutations is functionally relevant, because leukemia cells in that study did not tolerate inhibition of the methyltransferase placing this mark. Together, these data suggest that mIDH1/2 could cooperate with KMT2A rearrangements, particularly KMT2APTD, which are more reliant on co-occurring mutations, and that mIDH1/2’s effects on H3K79 methylation could provide a mechanism of cooperation.
Here, we present evidence that there is no short-term oncogenic cooperation between mIDH1/2 and KMT2A rearrangements, which is unexpected, particularly for KMT2APTD, given the high rate of IDH1/2 mutations in clinical samples. The antagonism can be explained, in part, by our finding that the H3K79me2 level in KMT2A-rearranged AML is unexpectedly low and precisely regulated; increases and decreases are not tolerated.
Methods
Human samples
Samples from AML patients were obtained from diagnostic procedures at the University of Colorado Hospital, Colorado Children’s Hospital, and the Hospital of the University of Pennsylvania, with patient informed consent according to the Declaration of Helsinki and Institutional Review Board approval from all participating centers. Additional samples were obtained from The Cancer Genome Atlas.
Cell culture and cell lines
Human AML cell lines EOL-1, THP1, MV4;11, U937, 31P, Kasumi, and human and mouse fibroblast cell lines 293T and 3T3 were maintained under standard culture conditions. Murine leukemia cells were maintained with cytokines, as previously described.1
Generation of murine leukemia
All animal experiments were performed in compliance with institutional guidelines and regulations and after approval from the appropriate Institutional Review Board (Institutional Animal Care and Use Committee). Murine KMT2A-MLLT3 (MLL-AF9) leukemias were generated by transducing lineage−Sca1+cKit+ (LSK) bone marrow cells from C57BL/6 mice with MSCV-KMT2A-MLLT3-IRES-GFP or MSCV-KMT2A-MLLT3-IRES-YFP. GFP+ or YFP+ cells were sorted, expanded in cytokine-supplemented media for 2 to 4 days, and transplanted into C57BL/6 sublethally irradiated (550 cGy) recipients (1 × 10⁵ cells per mouse). Murine HOXA9/MEIS1 were generated by cotransducing LSK cells with MSCV-HOXA9-IRES-GFP and MSVC-MEIS1-IRES-puro. Transduced cells were plated in puromycin from hour 24 to hour 72 after transduction, sorted for GFP, and transplanted as above. Fully transformed leukemias were isolated from leukemic animals (termed “murine KMT2A-MLLT3 AML” or “murine HOXA9/MEIS1 AML”).
For coexpression experiments, LSK cells from C57BL/6 mice were transduced with MSCV-KMT2A-MLLT3-IRES-GFP + MSCV-NRASQ61K-IRES-puro, MSCV-KMT2A-MLLT3-IRES-YFP + MSCV-IDH1-R132H-IRES-GFP, or MSCV-KMT2A-MLLT3-IRES-YFP + MSCV-IRES-GFP. Cells were sorted and transplanted as above.
For experiments in the IDH2R140 conditional knock-in model, LSK cells or granulocyte macrophage progenitors (GMPs) from C57BL/6 Vav1-Cre;Idh2R140Q/WT knock-in mice or wild-type (WT) littermate controls were transduced with MSCV-KMT2A-MLLT3-IRES-GFP and transplanted as detailed above, at 1 × 10⁵ or 1 × 10⁴ cells per mouse. Mice were monitored daily for signs of leukemia progression. Additional details can be found in supplemental Materials and methods.
In vitro assays
RNA purification, complementary DNA synthesis, quantitative reverse-transcription polymerase chain reaction, histone and protein extraction, western blotting, and retroviral and lentiviral overexpression were performed using standard protocols. H3K79me2 chromatin immunoprecipitation (ChIP) was performed using an internal spike-in control for normalization. Leukemia cells were mixed with Drosophila S2 cells as spike-in controls at a 2:1 ratio prior to cross-linking. Cross-linking and precipitation were performed as previously described.25 For more detailed protocols, see supplemental Materials and methods.
Competition assay
Cells and concentrated virus were plated together on a RetroNectin-coated plate for 48 hours, and the indicated population (intermediate, high, or bulk) was sorted. Nontransduced (NT) cells were sorted on singlets. Cells were counted by trypan blue exclusion staining, and the indicated populations were plated together in a single well at a 1:1 ratio. To verify the starting ratio, fluorescence-activated cell sorting analysis was performed (day 0). Every 3 days the cells were counted by trypan blue exclusion staining, a set number was replated in fresh media, and the remaining cells were analyzed by fluorescence-activated cell sorting to determine the ratio of each population.
2HG assay
Cell-permeable 2HG was dissolved in phosphate-buffered saline to a concentration of 50 mM. After 48 hours, cells were counted by trypan blue exclusion staining and replated in fresh media with fresh 2HG. At 96 hours, final counts or an XTT assay was performed.
RNA sequencing analysis
Library preparation was performed on polyadenylic acid–selected messenger RNA (mRNA) species (eukaryotic), and multiplexed sequencing was conducted on an Illumina HiSeq Sequencer to a read depth of 20 to 30 million per sample. Raw fastq files were aligned using STAR26 against the human genome assembly GRCh37 reference using default parameters and were quantified by applying Kallisto version 0.45.0.27 Output from Kallisto was directly imported into DESeq228 to detect differentially expressed genes with a false discovery rate <0.05. All analyses were carried out using R version 3.5.2. Gene set enrichment analysis (GSEA) was carried out using GSEA standalone software and “GSEAPreranked” tool,29,30 following its instruction manual online. We used “stat” field from the output of DESeq2 as input for GSEA software. As suggested in the GSEA software instruction manual, we selected “classic” as our parameter for enrichment score.
ChIP sequencing analysis
For experiments using an internal Drosophila spike-in control, raw fastq files were aligned against human and Drosophila genomes using BWA version 1.19.0.31 After sorting the output of the raw alignments, we separated reads aligned to human genome from Drosophila genome. We applied Model-based Analysis of ChIP-seq32 to predict histone marker binding peaks. We removed any peaks identified overlapping ENCODE blacklist (http://mitra.stanford.edu/kundaje/akundaje/release/blacklists/hg38human/hg38.blacklist.bed.gz). Homer33 (annotatePeaks.pl) was used to annotate identified ChIP sequencing (ChIP-seq) peak regions using Model-based Analysis of ChIP-seq. ngs.plot34 was used to plot ChIP-seq data average profiles and heat maps. We used the htseq-count program from HTSeq package35 to count reads aligned to each exon of the entire Drosophila genome and then we used DESeq2 to estimate each experiment’s size factor (estimateSizeFactors function of DESeq2). The RNA-sequencing (RNA-seq) and ChIP-seq alignment files were visualized using the Integrative Genomics Viewer program.36
Results
Patients samples with mIDH1/2 have high H3K79me2 levels
Three independent groups have reported increased H3K79me2 levels in different in vitro and in vivo models IDH1/2 mutations.21-23 To determine whether this finding extends to human leukemias, we analyzed the global levels of H3K79me2 in 8 patient samples: 4 with mIDH1/2 and 4 without. Full characterization of the patient samples can be found in supplemental Table 1. Global H3K79me2 was increased in the mIDH1/2 samples compared with IDH1/2 WT samples (Figure 1A). This finding provides a potential mechanism for the previously noted sensitivity of mIDH patient samples to DOT1L inhibition.24
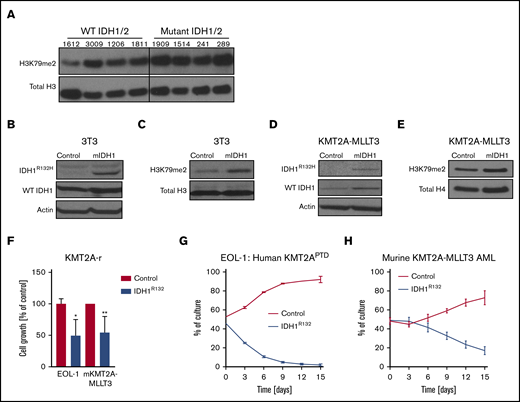
Mutant IDH1 impairs growth in KMT2A-r cells. (A) Western blot analysis of global H3K79me2 in patient AML samples with or without mutations in IDH1/2. Previously banked bone marrow samples from patients with AML were thawed and directly analyzed by western blotting. Characterization of patient samples can be found in supplemental Table 1. Western blot analysis of 3T3 cells transduced with IDH1R132H or control for IDH1R132H and total IDH1 (mutant + WT) (B) and H3K79me2 (C). 3T3 cells were sorted 4 days after retroviral transduction with IDH1R132 and were subjected to western blotting. Western blot analysis of murine KMT2A-MLLT3 AML cells transduced with IDH1R132H or control for IDH1R132H and total IDH1 (mutant + WT) (D) and for H3K79me2 (E). Fully transformed murine KMT2A-MLLT3 AML cells were isolated from mice and transduced with IDH1R132-GFP or GFP-only control vector. Cells were sorted 4 days after retroviral transduction and subjected to western blotting. (F) Growth of IDH1R132-transduced sorted EOL-1 (human KMT2APTD cell line) and murine KMT2A-MLLT3 AML cells as a percentage of empty vector control 12 days after transduction. Error bars represent standard deviation (SD). (G-H) Flow data from competition assay. EOL-1 cells (G) or murine KMT2A-MLLT3 AML cells (H) were transduced with IDH1R132 or the control vector, sorted, mixed 1:1, and plated together. The coculture was analyzed by flow cytometry every 3 days. Error bars represent SD. *P < .01, **P < .001; Student t test.
mIDH1 and 2HG inhibit growth in human KMT2A-r cell lines
Given the well-documented role of H3K79 methylation in KMT2A-r AML (fusions and PTDs), as well as the previously reported cooperation between mIDH2 and HOXA9 in murine models,37-39 we sought to investigate the effect of mIDH1/2 on AML with KMT2A rearrangements. We first verified the functionality of our IDH1R132 vector in 3T3 cells (Figure 1B-C) and then introduced IDH1R132 into the KMT2APTD human cell line EOL-1 and murine KMT2A-MLLT3 (MLL-AF9) AML cells (Figure 1D-F; supplemental Figure 1A). To our surprise, expression of IDH1R132 resulted in significantly decreased growth compared with cells transduced with an empty vector control (Figure 1F). We next evaluated cell growth in a competition assay. In this assay, leukemia cells transduced with IDH1R132 or the control vector were plated together in an equal ratio. We used flow cytometry to evaluate the percentages of each cell population in the well over 2 weeks. IDH1R132-expressing cells were rapidly lost relative to the control vector–expressing cells (Figure 1G-H). Representative flow plots from days 0, 3, and 12 demonstrate loss of the IDH1R132-GFP–expressing population (supplemental Figure 1B-G).
To extend our findings to additional cell lines and exclude vector toxicity as a confounding variable, we also treated human AML cell lines with 2HG. We observed a specific decrease in growth in the cell lines with KMT2A-F but not in Kasumi (RUNX1-RUNX1T1) control cells (supplemental Figure 1H). These data demonstrate that the addition of mutant IDH1 or 2HG to a fully established KMT2A-MLLT3 or KMT2APTD AML is detrimental. Interestingly, Su et al also noted a deleterious effect of mutant IDH1/2 and 2HG on growth on some cell lines in a much larger panel of cell lines.19 The investigators attributed the difference between 2HG-sensitive and 2HG-resistant cell lines to baseline MYC protein levels that are further decreased by 2HG’s effects on MYC mRNA methylation via inhibition of FTO. We noticed that the majority of the sensitive cells used by Su et al harbored a KMT2A rearrangement or a CALM-AF10 fusion. The only exceptions were 2 APML samples; however, IDH1/2 mutations do not co-occur with PML-RARA. We asked whether KMT2A-r patient samples exhibit lower MYC mRNA consistently in publicly available databases or lower MYC protein levels compared with other subtypes of AML. In a small panel of patient samples, we did not find a correlation between KMT2A status and MYC protein levels (supplemental Figure 2A). We also did not find a consistent relationship between myc mRNA expression and KMT2A rearrangement in several publicly available data sets levels (supplemental Figure 2B-F). In summary, we determined that the introduction of mutant IDH1 or the addition of 2HG specifically slows the growth of KMT2A-rearranged cells (PTD and fusions).
No functional cooperation between KMT2A-MLLT3 and mutant IDH1/2 in vivo
The adverse effects of 2HG or the presence of an IDH1 mutation on growth of KMT2A-rearranged cells was surprising, given the high frequency of IDH1/2 mutations found with KMT2APTD. Therefore, we asked whether the contribution of mIDH1/2 to in vivo leukemia may be different from its effects on in vitro growth. Alternatively, we hypothesized that the order of mutations could influence cooperation. In patients, mutations in IDH1 or IDH2 are typically an initiating event, followed by acquisition of KMT2APTD.14 Thus, the introduction of mIDH1 into KMT2APTD or KMT2A-F AML cells does not follow the order of mutations most commonly observed in patients, yet the order of mutations is of biological significance in other subtypes of AML.40,41
Therefore, we extended our experiments to an in vivo murine model that allowed us to modulate the order of mutations and assess effects in vivo. Despite the known biological differences between KMT2A-F and KMT2APTD AML, our data in Figure 1 demonstrate that both are sensitive to 2HG or the introduction of mutant IDH1/2. This suggests a shared underlying biology that can be interrogated in KMT2A-F or KMT2APTD models. Therefore, because of size constraints of KMT2APTD, which cannot be packaged in a viral vector, we used KMT2A-MLLT3 in vivo. We first cotransduced murine LSK cells with KMT2A-MLLT3 and IDH1R132 or an empty control vector to determine whether mIDH1 would affect leukemic onset in vivo. KMT2A-MLLT3 is a powerful oncogene that does not need a “second hit” in this model. However, the leukemia can be substantially accelerated when a second cooperating oncogene is introduced. For example, retroviral overexpression of KMT2A-MLLT3 cooperates with RAS mutations, such as NRASQ61K, leading to an accelerated leukemia onset in vivo (supplemental Figure 3A). Furthermore, retroviral overexpression of mutant IDH2 increases penetrance and accelerates leukemia when combined with retroviral overexpression of HOXA9, a critical downstream mediator of the oncogenic effect of KMT2A rearrangements.38 Therefore, both oncogenes have a track record of reading out in vivo cooperation when used in a murine retroviral overexpression model. However, when we cotransduced mIDH1 and KMT2A-MLLT3, we did not find any difference in in vivo disease latency (supplemental Figure 3B-C).
To test whether the order of mutations influences leukemogenesis, we transformed Vav1-Cre Idh2R140Q/WT knock-in (Idh2R140Q) or WT littermate control LSK cells with KMT2A-MLLT3 (Figure 2A). Because of the hematopoiesis-specific activity of Vav1-Cre, LSK cells from Idh2R140Q mice had been continuously exposed to elevated levels of 2HG prior to the introduction of KMT2A-MLLT3. The allelic structure of this model precisely recapitulates the human disease (1 mutant allele and 1 WT allele). The Idh2R140Q/WT knock-in model has been shown to recapitulate the human disease and to cooperate with other common co-occurring oncogenes.42,43 We found that Idh2R140Q + KMT2A-MLLT3 leukemia cells yielded substantially fewer colonies and numbers of cells at the first plating in methylcellulose compared with WT + KMT2A-MLLT3 cells (Figure 2B-C). Fewer colonies were consistently observed with different donors and mirrored the decreased cell growth observed in the human KMT2APTD EOL-1 and murine KMT2A-MLLT3 AML cells expressing IDH1R132 in Figure 1F. The growth difference was compensated for at the second through fourth replatings. We transplanted mice with 100 000 or 10 000 Idh2 or WT + KMT2A-MLLT3–transduced LSK cells but did not find any significant differences in survival with either cell number (Figure 2D; supplemental Figure 3D). Characterization of the mice at time of death did not reveal any significant differences in spleen weights or percentage of GFP in the bone marrow between the 2 groups with either cell number transplanted (supplemental Figure 3E-F).
![Mutant Idh2 does not cooperate with KMT2A-MLLT3 in vitro or in vivo. (A) Schematic diagram of experimental workflow. LSK cells or GMPs from WT or Vav1-Cre;Idh2R140Q/WT mice were transduced with KMT2A-MLLT3-GFP, sorted, and transplanted into sublethally irradiated WT recipients or plated in methylcellulose for colony-formation assays. (B-C) Colony formation and serial replating of LSK cells from Vav1-Cre;Idh2R140Q/WT or WT control mice transduced with KMT2A-MLLT3. Number of colonies (B) and number of cells (C) at each plating, per 500 cells plated in methyl cellulose of KMT2A-MLLT3–transformed LSK cells from 2 individual experiments. Cells were replated every 5 days. Error bars represent SD. (D) Survival of sublethally irradiated mice transplanted with 10 000 Vav1-Cre;Idh2R140Q/WT LSK cells transduced with KMT2A-MLLT3 (n = 5) or transplanted with 10 000 WT LSK cells transduced with KMT2A-MLLT3 (n = 5). (E) Growth of WT + KMT2A-MLLT3 and Vav1-Cre;Idh2R140Q/WT + KMT2A-MLLT3 leukemic cells [derived from leukemic mice in (D)] were treated with increasing concentrations of DOT1L inhibitor (EPZ5676). Cells were counted every 3 days using trypan blue, and 10 000 cells were replated and treated with fresh compound. Error bars represent SD. (F) Growth of WT + KMT2A-MLLT3 and Vav1-Cre;Idh2R140Q/WT + KMT2A-MLLT3 leukemic cells [from (D)] treated with increasing concentrations of mutant IDH2 inhibitor (AGI-6780). Cells were counted every 3 days using trypan blue, and 10 000 cells were replated and treated with fresh compound. Error bars represent the SD of technical duplicates. (G-H) Colony formation and serial replating of GMPs from Vav1-Cre;Idh2R140Q/WT or WT control mice transduced with KMT2A-MLLT3. Number of colonies (G) and number of cells (H) at each plating, per 500 cells plated in methyl cellulose of KMT2A-MLLT3–transformed GMPs from 2 individual transplants. Cells were replated every 5 days. Error bars represent SD. (I) Survival of sublethally irradiated mice transplanted with 10 000 Vav1-Cre;Idh2R140Q/WT GMPs transduced with KMT2A-MLLT3 (n = 5) or with 10 000 WT GMPs transduced with KMT2A-MLLT3 (n = 5). *P < .01, **P < .001; Student t test. DMSO, dimethyl sulfoxide; ns, not significant.](https://ash.silverchair-cdn.com/ash/content_public/journal/bloodadvances/4/13/10.1182_bloodadvances.2020001922/1/m_advancesadv2020001922f2.png?Expires=1764980608&Signature=grxcZg8VOzxGy7sVDoE1YQTMv7BGR0qJIh9JYeAPIKU6dqfp6~eRSfw-IlytqbZzgXaBSLOGyVQDPOQWGlDQeR1QRE4ZVaLByOPVIaDSWtTcpJDHWIi5MC5ntu9JhqyMt2AvHat4joR8mRGBs513xvgji3AYyGs2-GPtReWCwtrQxYXdbp1jQAoXTYpX9gLOhiTY4X32CIRTs7DLedXhUH-vGf04TiD4bOFEVAJ8RmOmFmZkIVfBFD00Ovn7G3u4vLkf2TPw-Jh5GruJfO5eo97q-45a6XW2aU3Sl7PYXA1TZlIHx9GEWdSLl7ZgbhUB36Cjj6kaMh0honYeaNMekA__&Key-Pair-Id=APKAIE5G5CRDK6RD3PGA)
Mutant Idh2 does not cooperate with KMT2A-MLLT3 in vitro or in vivo. (A) Schematic diagram of experimental workflow. LSK cells or GMPs from WT or Vav1-Cre;Idh2R140Q/WT mice were transduced with KMT2A-MLLT3-GFP, sorted, and transplanted into sublethally irradiated WT recipients or plated in methylcellulose for colony-formation assays. (B-C) Colony formation and serial replating of LSK cells from Vav1-Cre;Idh2R140Q/WT or WT control mice transduced with KMT2A-MLLT3. Number of colonies (B) and number of cells (C) at each plating, per 500 cells plated in methyl cellulose of KMT2A-MLLT3–transformed LSK cells from 2 individual experiments. Cells were replated every 5 days. Error bars represent SD. (D) Survival of sublethally irradiated mice transplanted with 10 000 Vav1-Cre;Idh2R140Q/WT LSK cells transduced with KMT2A-MLLT3 (n = 5) or transplanted with 10 000 WT LSK cells transduced with KMT2A-MLLT3 (n = 5). (E) Growth of WT + KMT2A-MLLT3 and Vav1-Cre;Idh2R140Q/WT + KMT2A-MLLT3 leukemic cells [derived from leukemic mice in (D)] were treated with increasing concentrations of DOT1L inhibitor (EPZ5676). Cells were counted every 3 days using trypan blue, and 10 000 cells were replated and treated with fresh compound. Error bars represent SD. (F) Growth of WT + KMT2A-MLLT3 and Vav1-Cre;Idh2R140Q/WT + KMT2A-MLLT3 leukemic cells [from (D)] treated with increasing concentrations of mutant IDH2 inhibitor (AGI-6780). Cells were counted every 3 days using trypan blue, and 10 000 cells were replated and treated with fresh compound. Error bars represent the SD of technical duplicates. (G-H) Colony formation and serial replating of GMPs from Vav1-Cre;Idh2R140Q/WT or WT control mice transduced with KMT2A-MLLT3. Number of colonies (G) and number of cells (H) at each plating, per 500 cells plated in methyl cellulose of KMT2A-MLLT3–transformed GMPs from 2 individual transplants. Cells were replated every 5 days. Error bars represent SD. (I) Survival of sublethally irradiated mice transplanted with 10 000 Vav1-Cre;Idh2R140Q/WT GMPs transduced with KMT2A-MLLT3 (n = 5) or with 10 000 WT GMPs transduced with KMT2A-MLLT3 (n = 5). *P < .01, **P < .001; Student t test. DMSO, dimethyl sulfoxide; ns, not significant.
We next tested whether the presence of an IDH1/2 mutation preceding the introduction of KMT2A-MLLT3 induced a dependence on mIDH, similar to the effects observed by Kats and colleagues when transducing IDHR140 LSK cells with the KMT2A-targets HOXA9 and MEIS1.39 We found that leukemias were sensitive to DOT1L, but not mIDH2, inhibition (Figure 2E-F). The lack of dependency on mIDH2 contrasts with HOXA9/MEIS1-driven AML initiated on an Idh2R140Q background, which developed a dependency on Idh2R140Q.39
LSK-derived KMT2A-MLLT3 leukemias are very aggressive, suggesting that a very subtle contribution to transformation/leukemia initiation could be missed. Therefore, we used GMPs as cell of origin and transplanted a cell number that resulted in delayed leukemia onset and incomplete penetrance of WT control donor–derived leukemias compared with LSK-derived leukemias. In this setting, Vav1-Cre Idh2R140Q/WT donor GMPs failed to give rise to leukemia in the transplanted animals (Figure 2G-I). Therefore, we conclude from our murine in vivo models that IDH1R132 and Idh2R140 do not cooperate with KMT2A-F, regardless of in vitro/in vivo context, cell of origin, or order of mutations.
Overexpression of mutant IDH results in downregulation of DOT1L- dependent genes
We noticed that H3K79me2 was increased in 3T3 cells consistent with previous reports21,38,39 (Figure 1B-C). However, although there was a trend toward H3K79me2 increases in murine KMT2A-MLLT3 AML cells when IDH1R132H was expressed, this was much less pronounced and consistent than expected across multiple experiments (supplemental Figure 3G-H). We wondered whether, rather than supporting KMT2A-F–mediated transcription, the expression of mIDH1/2 might interfere with it. Therefore, we asked how the expression of DOT1L/H3K79me2-dependent genes is affected by the introduction of IDH1R132 into a KMT2A-MLLT3 AML. We found that the canonical KMT2A target genes HOXA9, HOXA10, and MEIS1 were downregulated upon introduction of mIDH1R132 (Figure 3A). RNA-seq analysis revealed that gene sets that are dependent on DOT1L1 and HOXA944 in murine leukemia are downregulated upon overexpression of IDH1R132 (Figure 3B-C; supplemental Table 2). Effects on H3K79 methylation may be much more variable than anticipated, and toxic 2HG effects on KMT2A-rearranged cells could be mediated by mechanisms other than H3K79 methylation. However, our observations are also consistent with a model in which increases in H3K79 methylation levels are not tolerated in KMT2A-rearranged AML, because they result in a paradoxical downregulation of DOT1L-dependent genes, and cells with high H3K79 methylation are negatively selected.
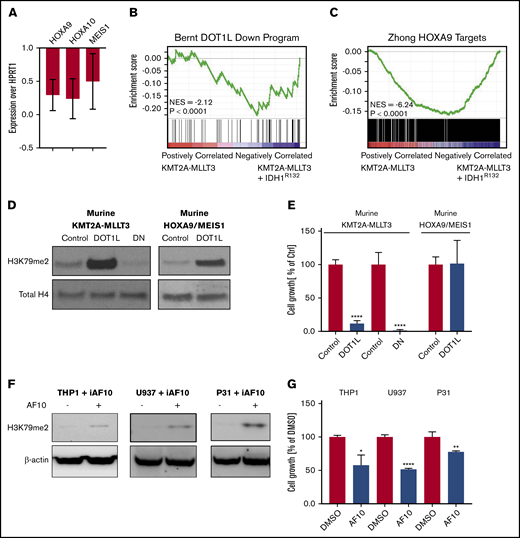
Overexpression of mutant IDH1, DOT1L, or dominant-negative DOT1L results in downregulation of DOT1L-dependent genes. (A) Analysis of KMT2A-target genes after introduction of mIDH1. Quantitative reverse-transcription polymerase chain reaction (qRT-PCR) of DOT1L targets genes (Hoxa9, Hoxa10, and Meis1) 5 days after introducing IDH1R132 into 2 individual murine KMT2A-MLLT3 leukemias. Expression levels are shown as fold change over empty vector control cells. Error bars represent SD. (B-C) Analysis of KMT2A-target genes after introduction of mIDH1 (RNA-seq). RNA was collected 5 days after introducing IDHR132 into 4 individual murine KMT2A-MLLT3 leukemias and submitted to sequencing. (B) GSEA plot showing genes that are downregulated upon DOT1L deletion1 are negatively enriched when IDH1R132 is overexpressed. (C) GSEA plot showing negative enrichment of HOXA9-bound genes44 when IDH1R132 is overexpressed. (D-E) Effect of directly increasing H3K79 methylation through overexpression of DOT1L on growth of murine KMT2A-MLLT3 AML cells. Western blot analysis for H3K79me2 (D) and growth of murine KMT2A-MLLT3 AML cells (E) when DOT1L is overexpressed for 4 days. DOT1L-DN served as positive control, decreasing H3K79 methylation and growth of murine KMT2A-MLLT3 AML cells. Murine HOXA9/MEIS1 AML cells serve as negative control for the growth assay, because the key KMT2A targets HOXA9 and MEIS1 in these cells are driven by the MSCV retroviral promoter and are insensitive to epigenetics regulation via the modulation of H3K79me2.1 Growth of DOT1L- or DOT1L-DN–transduced KMT2A-MLLT3 and HOXA9/MEIS1 leukemia cells as a percentage of empty vector control–transduced cells at day 12. Error bars represent SD. (F-G) Effect of indirectly increasing H3K79 methylation through overexpression of AF10, a cofactor of DOT1L, on the growth of the human KMT2A-MLLT3–rearranged AML cell line THP1, as well as the CALM-AF10–rearranged U937 and 31P cell lines. Western blot analysis of H3K79me2 (F) and growth of THP1, U937, and 31P cells treated with doxycycline for 3 days to induce AF10 expression (G). Error bars represent SD. *P < .01, **P < .001, ****P < .00001; Student t test. iAF10, induced AF10.
Increasing H3K79me2 leads to decreased growth of KMT2A-rearranged AML cells
To directly test whether increasing H3K79 methylation negatively affected KMT2A-r AML cells, we assessed the effect of DOT1L overexpression in KMT2A-MLLT3 AML. We transduced murine KMT2A-MLLT3 AML cells with DOT1L (DOT1L). A dominant-negative mutant of DOT1L (DOT1L-DN)3,45 served as positive control (overexpression of DOT1L-DN results in a decrease in H3K79me2, which, in turn, negatively affects KMT2A-F target gene transcription and cell growth); an empty control vector served as negative control (no change in H3K79me2). As an H3K79me2-independent control,1 we also transduced murine HOXA9/MEIS1 AML cells with DOT1L. As expected, overexpression of WT DOT1L in the murine KMT2A-MLLT3 AML cells increased H3K79 methylation, whereas overexpression of DOT1L-DN3,45 severely reduced H3K79 methylation (Figure 3D). Interestingly, increases and decreases in H3K79 methylation severely impaired the growth of murine KMT2A-MLLT3 AML cells (Figure 3E). Growth of the HOXA9/MEIS1 control was unaffected by overexpression of DOT1L. When plated in a competition assay against NT cells, DOT1L-transduced cells were rapidly and completely lost (supplemental Figure 4A-C,G). The empty vector transduced control cells; on the other hand, slightly expanded and then remained at a constant percentage in culture (supplemental Figure 4D-F,H). Overexpression of DOT1L resulted in a substantial increase in H3K79me2. To determine whether moderate increases in H3K79me2 would also be detrimental to growth, we sorted intermediate and high DOT1L-transduced populations (supplemental Figure 5A). We found that even a moderate increase in H3K79me2 levels inhibited growth (supplemental Figure 5B-K).
It is possible that overexpressing DOT1L could have detrimental effects on cell growth that are unrelated to its methyltransferase activity. To exclude this possibility, we sought to increase H3K79 methylation levels indirectly. DOT1L is the only known methyltransferase for H3K79, effecting mono-, di-, and trimethylation. DOT1L is part of a larger complex46 that includes the proteins AF10 and AF17 as core members. Di- and trimethylation of H3K79 require the full complex, including DOT1L and AF10.47-49 This afforded us the opportunity to test whether increasing H3K79 dimethylation levels indirectly through overexpression of AF10, rather than DOT1L, also impaired the growth of the KMT2A-rearranged cells. To this end, we used human KMT2A-MLLT3–rearranged THP1 cells that were stably transduced with a doxycycline-inducible AF10 complementary DNA construct. Induction of AF10 resulted in a modest increase in H3K79 methylation and a reduction in growth (Figure 3F-G).
In addition to serving as DOT1L cofactor, AF10 is a relatively frequent fusion partner of KMT2A.50 It also fuses to CALM in a subset of AML and T-cell acute lymphoblastic leukemia.51 Similar to KMT2A-rearranged AML, CALM-AF10 leukemias share a HOXA cluster–centered transcriptional profile, aberrantly high H3K79 methylation levels on loci bound by the fusion, and sensitivity to DOT1L inhibition.49,52-54 CALM-AF10 leukemias were previously described to have an exceptionally low global H3K79 methylation level.51 This was interpreted as likely resulting from the loss of 1 AF10 allele through its participation in the fusion. We wondered whether the low H3K79 methylation levels were functionally relevant and not an inert consequence of the fusion. Indeed, overexpression of AF10 in the CALM-AF10 AML cell lines U937 and 31P increased H3K79 methylation and resulted in growth inhibition similar to that observed in the KMT2A-F model (Figure 3F-G). Thus, we find that decreases and increases in H3K79me2 levels are not tolerated in KMT2A-rearranged and CALM-AF10 leukemias.
Increased H3K79me2 leads to decreased expression of KMT2A-F target genes
We next asked how a global increase in H3K79me2 affects locus-specific H3K79 methylation. To this end, we used ChIP-seq to analyze the genome-wide localization of H3K79me2 in murine KMT2A-MLLT3 AML cells overexpressing DOT1L. ChIP-seq was performed 4 days after transduction with DOT1L, before the onset of any proliferative or phenotypic changes. As a control, we transduced cells with the dominant-negative vector, DOT1L-DN. A Drosophila cell spike-in was used to normalize results. We found that in DOT1L transduced leukemias, H3K79me2 predominantly increased on non-KMT2A target loci, whereas overexpression of DOT1L-DN reduced the peak height over fusion targets. In both conditions, the difference between fusion targets and other genomic loci was effectively blunted (Figure 4A-C; supplemental Figure 6A-E; supplemental Table 3). GSEA analysis of KMT2A-MLLT3 fusion targets (“Bernt KMT2A-MLLT3 targets”)1 and DOT1L-dependent genes (“Bernt DOT1L-Down program”) demonstrated negative enrichment that was remarkably similar in DOT1L- and DOT1L-DN–overexpressing cells, despite diametrically opposed effects on global H3K79 methylation levels (Figure 4D-G; supplemental Figure 6F-I; supplemental Table 2). Thus, decreasing fusion target H3K79 methylation or increasing global H3K79 methylation blunts the distinction between KMT2A-target and -nontarget genes, leading to a collapse of the leukemogenic program (supplemental Table 4).
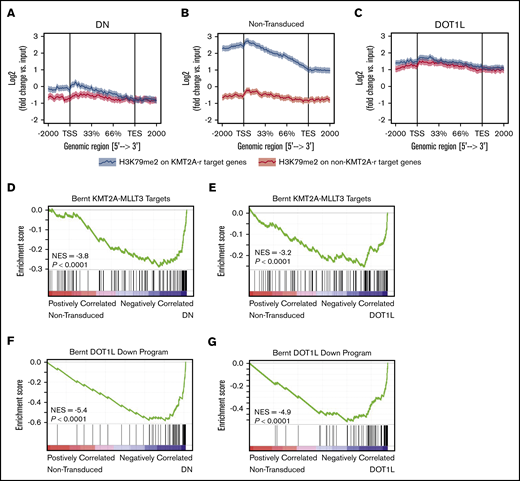
Increasing H3K79me2 decreases the differential between KMT2A-MLLT3 targets and nontarget genes. Effect of directly increasing H3K79 methylation through overexpression of DOT1L on H3K79me2 profiles and the expression of KMT2A target genes in murine KMT2A-MLLT3 AML cells. Fully transformed AML cells isolated from moribund mice transplanted with KMT2A-MLLT3–transduced LSK cells were transduced with DOT1L or DOT1L-DN (control). Cells were sorted into high- and moderate-overexpressing compartments and analyzed 4 days after transduction. The sort strategy is shown in supplemental Figure 5A. Results are shown for high overexpression of DOT1L or DOT1L-DN; results for high- and moderate-overexpressing compartments are shown in supplemental Figure 5A. ChIP-seq signal height and position relative to the transcription start site (TSS) are shown for known KMT2A-MLLT3 target genes or matched nontarget genes. High overexpression of DOT1L-DN (A), NT cells (B), and DOT1L (C). GSEA plots showing negative enrichment of genes bound to the KMT2A-F1 in samples with overexpressed DOT1L-DN (D) or DOT1L (E). GSEA plots showing that genes downregulated upon DOT1L deletion1 are negatively enriched when DOT1L-DN (F) or DOTIL (G) is overexpressed. DN, dominant negative.
Primary KMT2A-rearranged patient samples have low global H3K79 methylation levels
The well-documented low global H3K79me2 levels in CALM-AF10 AML and the inability of CALM-AF10– and KMT2A-r–driven leukemia to tolerate increased H3K79me2 levels prompted us to interrogate global H3K79me2 levels in 2 independent cohorts of primary AML patient samples by western blotting. We found that patient samples with KMT2A rearrangements had globally low levels of H3K79me2 compared with controls (Figure 5A-B). KMT2APTD had higher levels than fusions, and addition of mIDH1/2 did not affect the level of H3K79 methylation (Figure 5C). Quantification of all western blots with patient samples confirmed that patients with KMT2A rearrangements (fusions and PTDs) had statistically significantly lower H3K79me2 levels compared with other AMLs (Figure 5D). We confirmed these results in a third independent sample set using immunohistochemistry (Figure 5E-F).
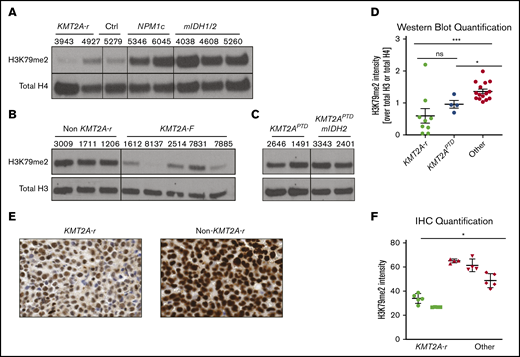
KMT2A-r AML has significantly lower levels of H3K79me2. (A) Western blot analysis for H3K79me2 in a cohort of AML patient samples from the University of Pennsylvania (A), the University of Colorado (B), and the Cancer Genome Atlas (C). See supplemental Table 1 for additional details about all patient samples. (D) Quantification of H3K79me2 levels in all patients’ western blots compared with total H3 or total H4 (Figures 1A, 6G-H). *P < .01, **P < .001; Student t test. (E) H3K79me2 immunohistochemistry of representative patient samples with and without a KMT2A-r. (F) Quantification of H3K79me2 immunohistochemistry staining. Four to 6 individual areas were analyzed for each slide. Average intensity of H3K79me2 over all areas is shown for each patient. KMT2A-r samples (n = 2), non–KMT2A-r samples (n = 3). *P < .05; Student t test.
Discussion
Our data provide strong evidence for a model in which the high and broad peaks of H3K79 methylation in KMT2A- and CALM-AF10–rearranged AML are maintained in the context of obligate low global levels of H3K79me2. CALM-AF10 fusion leukemias were previously reported to have exceptionally low global H3K79me2 levels, whereas methylation is concentrated and locally high on the CALM-AF10 fusion bound loci.51,52 AF10 is a cofactor of DOT1L that is required for higher-order H3K79 methylation (H3K79me2 and H3K79me3).49 The globally low levels of H3K79me2 were interpreted as being a direct consequence of the involvement of AF10 in the fusion, by effectively resulting in the loss of 1 allele of AF10, by redistributing AF10, or both.51 We found that globally low, but locus-specific high, levels of H3K79me2 extend to KMT2A-rearranged AML. Furthermore, the globally low H3K79 methylation levels in these leukemias are functionally relevant, and increases are not tolerated. This suggests that transformation mediated by KMT2A rearrangements requires a very tight and locus-specific dysregulation of H3K79me2.
2HG, which increased H3K79 methylation in other contexts, slowed the growth of KMT2A-F and KMT2APTD cell lines, and mIDH1/2 failed to directly cooperate with KMT2A-F, despite documented cooperation with HOXA9 or HOXA9/MEIS1.38,39 Su et al also noticed the toxic effects of 2HG on a subset of AML and proposed low baseline levels of MYC expression, combined with impaired MYC translation via 2HG-mediated FTO inhibition, as a mechanism.19 Interestingly, nearly all cell lines sensitive to 2HG in that study had KMT2A or CALM-AF10 fusion, the only exception being 2 APML cell lines. In our hands, KMT2A status in patient samples correlated more tightly with low H3K79me2 levels than with MYC protein levels. However, more than 1 mechanism may mediate the toxic effect of 2HG on KMT2A-r cells.
The toxic effects of 2HG on KMT2A-rearranged cells (fusions and PTDs) would suggest that the 2 mutations should be mutually exclusive. Nevertheless, mIDH1/2 are found in 30% of KMT2APTD AMLs.14 This appears to be counterintuitive; however, it is noteworthy that KMT2A-F, in contrast to KMT2APTD leukemias, is rarely found with mIDH1/2.55,56 KMT2A-F are powerfully transforming oncogenic events that do not require cooperating mutations.57 In this context, it is likely that mIDH1/2 do not provide a selective advantage. In contrast, the higher number of co-occurring mutations, as well as model systems, suggests that KMT2APTD and mIDH1/2 cannot mediate full transformation alone. The effects of mIDH1/2 are highly pleiotropic; DNA, RNA, and histone methylation, HIF1α signaling, mitochondrial respiration, the mitochondrial apoptotic threshold, and amino acid metabolism are altered, and all have been implicated in modulating oncogenic phenotypes.16,17,20,21,58-61 Some of these effects constitute vulnerabilities rather than contribute to transformation.20,62,63 The sum of mIDH1/2 pro-oncogenic effects in KMT2APTD may outweigh mIDH1/2-induced antileukemic effects in the face of intense selective pressure (Figure 6). A second, and not mutually exclusive, possibility is that the epigenetic dysregulation induced by mIDH1/2 increases the likelihood of acquiring additional mutations, including internal duplications, such as FLT3ITD and KMT2APTD. Mutant IDH1/2–mediated inhibition of TET2 is well accepted as the primary oncogenic mechanism, and TET2 and mIDH1/2 are typically founder mutations that are found at similar frequencies in AML. Yet, the frequency of TET2 mutations in clonal hematopoiesis of indeterminate potential is much higher than that of mIDH1/2.64 This discrepancy suggests that mIDH1/2 mediates a more rapid progression to AML, presumably through non–TET2-based mechanisms. Indeed, mIDH1/2 have been shown to increase H3K9me3, which leads to an accumulation of DNA damage.18 Chromatin also plays a role in preventing DNA amplification.65 Finally, H3K79me2 is correlated with localization of stalled TOP2 at the topoisomerase inhibitor–mediated breakpoints (including the breakpoint cluster region in the KMT2A locus).66 Thus, chromatin effects of mIDH1/2 could contribute to genomic instability and the acquisition of internal amplifications of FLT3 and KMT2A, without necessarily cooperating with the resultant alteration (Figure 6).

Diverse effects of IDH mutations during leukemogenesis. IDH1/2 mutations induce proleukemogenic effects, which include inhibition of TET2 function, splicing, and HIF signaling. However, several mIDH1/2-induced molecular changes also have antileukemic effects in the right context. These include inhibition of cytochrome c-oxidase (which lowers the mitochondrial apoptotic threshold), inhibition of FTO (which interferes with myc and CEBPα mRNA stability), and increased H3K79 methylation. Increased H3K79 methylation and FTO inhibition are particularly detrimental in KMT2A-rearranged cells, resulting in a failure of short-term cooperation between the 2 oncogenes, as well as 2HG’s toxic effects on KMT2A-rearranged cells (fusions and PTDs). Despite the acute lack of cooperation and 2HG’s toxic effects, a substantial number of KMT2APTD patients have IDH1/2 mutations. Two hypothetical and not mutually exclusive models could explain this finding. On one hand, detrimental chromatin and mRNA methylation effects may be rapidly compensated for under selective pressure (left panel). On the other hand, aberrant chromatin and DNA methylation induce dysfunctional hematopoiesis and impaired genome stability, resulting in the emergence of additional mutations (right panel). Eventually, mIDH1/2 AML with a high mutation burden may not be dependent on the initiating genetic event, as suggested by the increased risk of resistance to mIDH1/2 inhibitor in these patients. CNV, copy number variation; SNV, single nucleotide variation.
Recently, Amatangelo et al investigated predictors of treatment failure to IDH inhibitor and found that the higher the number of additional mutations, the lower the likelihood of response to IDH inhibitor.67 This is consistent with a model in which the progressive acquisition of mutations ultimately results in an upfront mIDH/2HG-independent leukemia (Figure 6, right panel). With respect to individual mutations, NRAS/KRAS mutations were the only alteration associated with a statistically significant increase in nonresponse to IDH inhibition. However, the study also identified a group of patients with cytogenetic/molecular alterations that were associated with lower response rates, although this failed to reach statistical significance. This included mutations in RUNX1, ASXL1, and KMT2A rearrangements (mostly PTDs).67
In summary, we find that >30% of KMT2APTD AMLs contain a co-occurring mutation that produces a metabolite that is acutely toxic specifically to KMT2A-rearranged cells. This intriguing and novel finding has implications for our understanding of AML biology.
We further find an unanticipated reliance of KMT2A and CALM-AF10–rearranged leukemias on globally low, but locus-specific high, levels of H3K79 methylation. This requirement for a locus-specific differential, rather than absolute levels, has critical implications for the study of histone modifications in AML, as well as for clinical biomarker development. The number of small molecule inhibitors targeting histone methyltransferases and demethylases (EZH2, DOT1L, LSD1, PRMT5, PRMT1) that are in early-phase clinical trials is expanding rapidly, and several highly promising targets are in preclinical development (WHSC1/NSD2/MMSET, G9a). Our data clearly demonstrate that a sophisticated understanding of global, as well as locus-specific, histone posttranslational modifications is critical to the design of meaningful read-outs for the clinical development of epigenetics therapies.
RNA-seq and ChIP-seq data reported in this article have been deposited in the Gene Expression Omnibus database (accession number GSE134046).
Data sharing requests should be sent to Kathrin M. Bernt (berntk@e-mail.chop.edu).
Acknowledgments
The authors thank Craig Jordan, Martin Carroll, and Tim Ley for providing AML patient samples; Kelly Higa for the mDH1/2 plasmids; Patricia Ernst for the KMT2A-MLLT3-YFP plasmid; and Craig Thompson and Andrew Intlekofer for providing Idh2R140Q mice. The authors also thank Brett Stevens, Karen Helm, and the staff at the University of Colorado Flow Core, as well as Florin Tuluc and the staff at the Children’s Hospital of Philadelphia Flow Core, for assistance with cell sorting. They also thank all of the veterinary staff at the University of Colorado and The Children’s Hospital of Philadelphia for assistance with caring for the mice.
This work was supported by start-up funds from the University of Colorado Denver, Hematology/Oncology Section and the Children’s Hospital Colorado Research Institute (K.M.B.), the University of Colorado Predoctoral Training Program in Molecular Biology (National Institutes of Health [NIH]/National Institute of General Medical Sciences grant T32 GM008730) (M.C.K.), NIH/National Cancer Institute (NCI) grants R37 CA251543 and K08 CA201483 (A.M.I.), Memorial Sloan Kettering Cancer Center Support grant P30 CA008748 from the NIH/NCI (A.M.I.), start-up funds from the Children’s Hospital of Philadelphia Department of Pediatrics and the Division of Oncology (K.M.B.), Abramson Cancer Research Center Support Grant P30 CA016520-42 from the NIH/NCI (K.M.B.), and NIH/NCI grant R01 CA201230 (K.M.B.).
Authorship
Contribution: M.C.K., S.S.R., and K.M.B. designed experiments; M.C.K., S.S.R., M.K.B., C.L., T.P., T.S., and S.P.S. conducted experiments; A.M.I. participated in establishing Idh2R140Q knockin leukemias; H.M.X. performed biocomputational analyses; and M.C.K. and K.M.B. wrote the manuscript.
Conflict-of-interest disclosure: K.M.B. has acted as a consultant for Novartis and Agios. A.M.I. has acted as a consultant for Foundation Medicine, Inc. The remaining authors declare no competing financial interests.
Correspondence: Kathrin M. Bernt, Division of Oncology–Center for Childhood Cancer Research, Children’s Hospital of Philadelphia, 3501 Civic Center Blvd, CTRB 3064, Philadelphia, PA 19104; e-mail: berntk@email.chop.edu.

