

Key Points
Toxicity burdens in DLBCL patients treated with CAR T cells are high; however, most toxicities are manageable and rarely cause mortality.
A uniform toxicity assessment is crucial for monitoring adverse events and improving experience in patients receiving CD19 CAR T cells.
Visual Abstract

Abstract
Cytokine release syndrome (CRS) immune effector cell–associated neurotoxicity syndrome are the most notable toxicities of CD19 chimeric antigen receptor (CAR) T-cell therapy. In addition, CAR T-cell–mediated toxicities can involve any organ system, with varied impacts on outcomes, depending on patient factors and involved organs. We performed detailed analysis of organ-specific toxicities and their association with outcomes in 60 patients with diffuse large B-cell lymphoma (DLBCL) treated with CD19 CAR T cells by assessing all toxicities in organ-based groups during the first year posttreatment. We observed 539 grade ≥2 and 289 grade ≥3 toxicities. Common grade ≥3 toxicities included hematological, metabolic, infectious, and neurological complications, with corresponding 1-year cumulative incidence of 57.7%, 54.8%, 35.4%, and 18.3%, respectively. Patients with impaired performance status had a higher risk of grade ≥3 metabolic complications, whereas elevated lactate dehydrogenase was associated with higher risks of grade ≥3 neurological and pulmonary toxicities. CRS was associated with higher incidence of grade ≥3 metabolic, pulmonary, and neurologic complications. The 1-year nonrelapse mortality and overall survival were 1.7% and 69%, respectively. Only grade ≥3 pulmonary toxicities were associated with an increased mortality risk. In summary, toxicity burdens after CD19 CAR T-cell therapy were high and varied by organ systems. Most toxicities were manageable and were rarely associated with mortality. Our study emphasizes the importance of toxicity assessment, which could serve as a benchmark for further research to reduce symptom burdens and improve tolerability in patients treated with CAR T cells.
Introduction
CD19 chimeric antigen receptor (CAR) T cells have transformed the treatment landscape of relapsed/refractory (R/R) diffuse large B-cell lymphoma (DLBCL), providing excellent antilymphoma activity and potential cure for these high-risk patients.1 However, CAR T cells are associated with unique immune-mediated toxicities, notably the cytokine release syndrome (CRS) and immune effector cell–associated neurotoxicity syndrome (ICANS).2 Although CAR T-cell–associated immune-mediated adverse events have a wide array of clinical presentations mimicking systemic inflammatory response syndromes (ie, fever, cardiopulmonary compromise, and neurological disarray), any organ system can be affected.3 Data on the organ-specific toxicity burden of CAR T cells, including optimal management and the impact on long-term outcomes, are limited. We hypothesized that CAR T-cell–associated adverse events have heterogeneous presentations and variable effects on outcomes among affected patients. Herein, we comprehensively describe toxicity patterns stratified by organ involvement and their association with survival outcomes in DLBCL patients treated with 2 US Food and Drug Administration (FDA)-approved CD19 CAR T-cell products.
Patients and methods
In this retrospective study, we included 60 consecutive adult patients with R/R DLBCL who were treated with FDA-approved CD19 CAR T cells, axicabtagene ciloleucel (Kite; Gilead), or tisagenlecleucel (Novartis) at Memorial Sloan Kettering Cancer Center between January 2018 and June 2019. All patients were discussed at the service consensus meeting. Although there were no strict guidelines regarding CAR T-cell product selection, the choice depended upon several factors, including the patient’s underlying characteristics, product availability, and logistics. All patients signed informed consent for treatment and the Institutional Review Board approved the study.
Toxicity assessment and grading
We retrospectively extracted detailed data from the clinical database and individual patients’ electronic medical records. Three authors (K.W., M.P., and M.G.-R.) independently reviewed each individual patient record. K.W. reviewed records of all 60 individual patients for toxicity abstraction. M.P. and M.G.-R. independently reviewed and recorded toxicities of 30 overlapping patients for interobserver data-accuracy assessment. Toxicities were stratified according to 17 predefined organ systems (supplemental Table 1) and sorted into 5 grades according to the National Cancer Institute (NCI) Common Terminology Criteria for Adverse Events (CTCAE) version 5.0.4 Toxicities grade ≥2 were prospectively reviewed from the day of CAR T-cell infusion, except cytopenias, which were recorded starting from day +31 post–CAR T cell. All febrile episodes were recorded as an infectious complication. In an attempt to maximize the accuracy, we separated febrile episodes during the first 30 days into fever with confirmed source/pathogens and fever without identifiable source or organism as fever without source/pathogen could overlap with the presentation of CRS. Fever is a hallmark of CRS diagnosis. However, clinicians are often unable to exclude concomitant infectious etiologies and treat patients with antimicrobials as well as antipyretics. All toxicities were captured from the CAR T-cell infusion date to 1 year after CAR T-cell infusion or at the time of systemic relapse, treatment reinitiation, death, or last follow-up before 1 year, whichever came first. All toxicities were stratified into 4 different periods: days 0 to 30, days 31 to 100, days 101 to 180, and days 181 to 365. Interinvestigator grading of 30 overlapped patients was reviewed by author M.-A.P. to ensure consistency and accuracy. If there was discordance of toxicity assessment between 3 authors, M.-A.P. provided the final consensus of the toxicity grading and classification. All discrepancies were reviewed by 3 authors to reach conclusions. After a final review of conflicting findings, the interpretation variability in interinvestigator toxicities was <5%. CRS and ICANS were separately graded according to American Society for Transplantation and Cellular Therapy (ASTCT) grading,5,6 and events with all grades were recorded.
Cumulative incidence of toxicities was defined as the proportion of patients who developed toxicity during the period between day 0 (CAR T-cell infusion date) to 1-year post–CAR T cell. Nonrelapse mortality (NRM) was defined as the proportion of patients who died of other causes unrelated to disease relapse/recurrence. Event-free survival (EFS) was defined as the time from the day of CAR T-cell infusion to progression, relapse, or death from any causes. Overall survival (OS) was defined as the time from the CAR T-cell infusion date to death from any causes.
Statistical analysis
Continuous data were presented in the median with range; categorical variables were described as proportions. Cumulative incidences of time to first toxicity for each organ-based group were calculated and compared between a variety of covariates using cause-specific hazard models. Competing events for cumulative incidence of toxicities included systemic relapse/progression and death. Kaplan-Meier survival analysis was used to estimate EFS and OS. The association between the respective toxicities and each outcome was assessed using time-dependent covariates within the Cox model. All analyses were conducted using R version 3.6.1 (R Foundation for Statistical Computing, Vienna, Austria).
Results
Baseline characteristics are summarized in Table 1. The median age of patients at the time of CAR T-cell therapy was 63 years (range, 19-85 years). Of 60 patients, 38 (63.3%) were older than 60 years old. The median Eastern Cooperative Oncology Group (ECOG) performance status was 1 (range, 0-3) and the median number of prior to treatments was 3 (range, 2-9). Sixteen patients (26.7%) had hematopoietic stem cell transplant (HCT) prior to CAR T-cell therapy, including 12 with prior autologous HCT, 4 with prior allogeneic HCT (1 of which had both). Thirty-eight patients (63.3%) received bridging therapy before CAR T cells, including immunochemotherapy (n = 23), immunomodulatory/targeted therapy (n = 11), and radiation monotherapy (n = 4). Forty-three patients (71.7%) were treated with axicabtagene ciloleucel. CRS and ICANS (all grades) were observed in 48 patients (80%) and 24 patients (40%), respectively. The median onset date of CRS and ICANS was 2 days (0-11 days) and 5 days (1-21 days) after the CAR T-cell infusion, respectively. Of 48 patients who developed CRS, only 7 (14.5%) were grade 3 or higher according to ASTCT grading criteria. ICANS grade ≥2 were observed in 18 patients.
Baseline characteristics of large B-cell lymphoma treated with CD19 CAR T cells
| Baseline parameters | N = 60 (%) |
|---|---|
| Median age at CAR T cell (range), y | 63 (19.5-85.9) |
| Male:female sex | 42:18 |
| Histopathological diagnosis | |
| De novo diffuse large B-cell lymphoma | 35 (58.3) |
| Transformed indolent lymphoma | 25 (41.7) |
| Stage | |
| 1-2 | 14 (23.3) |
| 3-4 | 38 (63.3) |
| Not available | 8 (13.3) |
| ECOG performance status | |
| 0-1 | 44 (73.3) |
| 2 | 10 (16.7) |
| 3 | 2 (3.3) |
| Not available | 4 (6.7) |
| Median no. of prior treatments (range) | 3 (2-9) |
| Response to prior treatments | |
| Primary refractory disease | 10 (16.7) |
| Relapsed disease | 50 (83.3) |
| Presence of bulky disease | |
| Yes | 9 (15.0) |
| No | 45 (75.0) |
| Not available | 6 (10.0) |
| LDH before lymphodepletion | |
| Normal | 30 (50.0) |
| Elevated | 30 (50.0) |
| History of HCT | |
| Yes | 16 (26.7) |
| No | 44 (73.3) |
| Bridging treatment before CAR T-cell therapy | |
| High-intensity systemic therapy | 23 (38.3) |
| Low-intensity systemic therapy* | 11 (18.3) |
| Radiotherapy* | 5 (8.3) |
| No bridging therapy or systemic corticosteroid | 22 (36.7) |
| Lymphodepletion chemotherapy | |
| Fludarabine/cyclophosphamide | 57 (95.0) |
| Bendamustine | 3 95.0) |
| CAR T-cell product | |
| Axicabtagene ciloleucel | 43 (71.7) |
| Tisagenlecleucel | 17 (28.3) |
One patient received combined treatment modalities.
There were 539 grade ≥2 adverse events observed in 59 patients during the study period (250 grade 2, 254 grade 3, 33 grade 4, and 2 grade 5). One patient did not develop any grade ≥2 toxicities. Figure 1A-B illustrate the distribution of overall toxicities and organ-based toxicities by severity. Toxicities were observed in each patient with a median of 5 organ systems involved (range 1-9), and 50% of patients had 5 or more organ systems affected (Figure 1C). Among these 539 events, metabolic complications were the most frequent toxicities with a total of 141 events followed by infectious (125 events) and hematologic (101 events) complications. When considering only grade ≥3 toxicities, metabolic adverse events remained the most common complication (81 events). Most toxicities occurred within 100 days after CAR T-cell therapy (n = 471; 87.2%) (supplemental Figure 1). The 1-year cumulative incidence of grade 3 or higher metabolic, hematologic, infection, neurological, cardiovascular, and pulmonary toxicities were 54.4%, 53.3%, 35.9%, 18.3%, 16.7%, and 13.3%, respectively (Figure 2). Supplemental Figure 2 illustrates the 1-year cumulative incidence of grade ≥2 toxicities. The number of cases with toxicities grade ≥3 and the median duration of organ toxicities before recovery to grade ≤1 are shown in Figure 3. All CRS was observed during the first 30 days, with a cumulative incidence of 80.0%. Table 2 and supplemental Table 2 summarize the incidence of toxicities grade ≥3 at different time points and by patient characteristics.
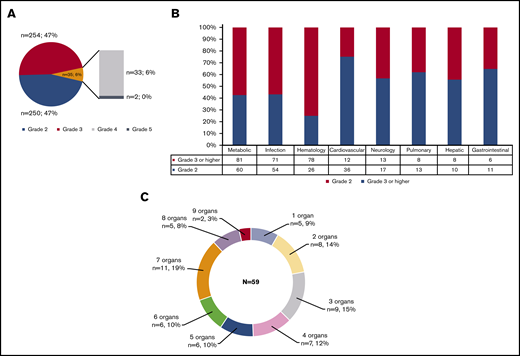
Distribution of toxicities grade ≥2 according to NCI CTCAE version 5.0 criteria. (A) Overall toxicities. (B) Organ-based stratification. (C) Number of organ involvement.
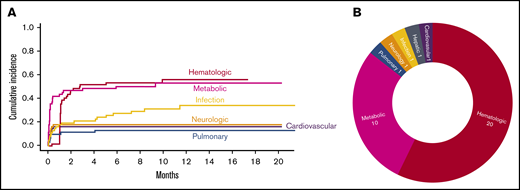
Severe toxicities after CAR T cells. (A) Cumulative incidence of toxicities grade ≥3 with an incidence of >10% as stratified by organ systems. (B) Severe toxicities grade 4 and grade 5 as stratified by organ system.
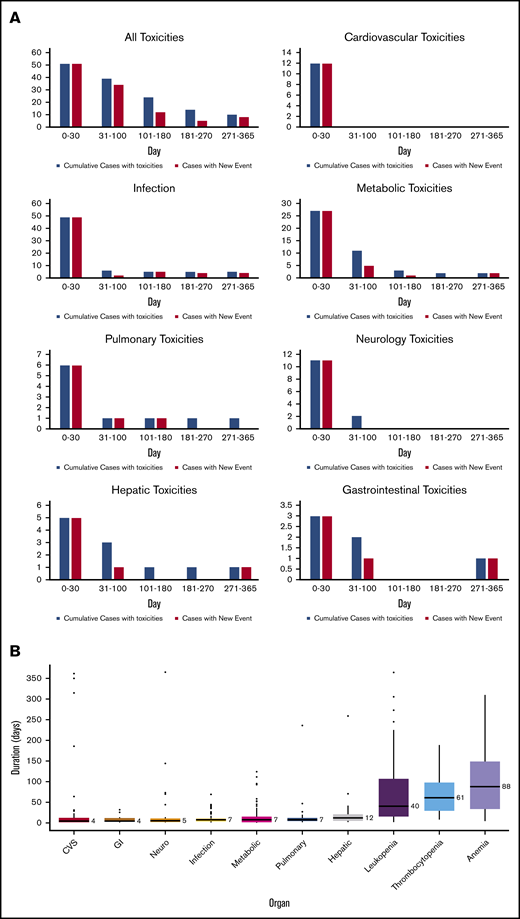
Detailed organ toxicities after CD19 CAR T cells. (A) Number of patients with organ toxicities at each time point after CAR T-cell infusion (blue indicates total numbers of patients with toxicities at each time point; red indicates numbers of patients with new toxicity occurring during that individual time point). (B) The median duration of recovery of toxicities to grade ≤1 by organ systems (number on the right side of each boxplot indicates the median duration in days).
Cumulative incidence of toxicities over time after CAR T-cell infusion
| Toxicities by system | 1 mo, % (95% CI) | 3 mo, % (95% CI) | 6 mo, % (95% CI) | 1 y, % (95% CI) | ||||
|---|---|---|---|---|---|---|---|---|
| Grade ≥2 | Grade ≥3 | Grade ≥2 | Grade ≥3 | Grade ≥2 | Grade ≥3 | Grade ≥2 | Grade ≥3 | |
| Cardiovascular based | 53.3 (39.8-65.1) | 16.7 (8.5-27.2) | 53.3 (39.8-65.1) | 16.7 (8.5-27.2) | 53.3 (39.8-65.1) | 16.7 (8.5-27.2) | 53.3 (39.8-65.1) | 16.7 (8.5-27.2) |
| Metabolic based | 73.3 (59.9-82.9) | 45.0 (32.0-57.1) | 75.0 (61.7-84.3) | 48.3 (35.1-60.3) | 78.5 (65.3-87.2) | 51.8 (38.3-63.7) | 78.5 (65.3-87.2) | 54.8 (40.5-67.1) |
| Hematologic based | 15.0 (7.3-25.2) | 1.7 (0.1-7.9) | 66.7 (53.0-77.2) | 53.3 (39.8-65.1) | 66.7 (53.0-77.2) | 55.0 (41.4-66.7) | 69.7 (55.0-80.4) | 57.7 (43.4-69.9) |
| Pulmonary based | 28.3 (17.5-40.1) | 10.0 (4.0-19.2) | 30.0 (18.9-41.9) | 11.7 (5.1-21.2) | 31.7 (20.3-43.6) | 13.3 (6.2-23.3) | 36.3 (23.8-48.9) | 13.3 (6.2-23.3) |
| Neurology based | 40.0 (27.5-52.2) | 18.3 (9.7-29.1) | 41.7 (29.0-53.8) | 18.3 (9.7-29.1) | 43.3 (30.5-55.5) | 18.3 (9.7-29.1) | 46.0 (32.5-58.5) | 18.3 (9.7-29.1) |
| Infection with identified pathogen/source | 48.3 (35.1-60.3) | 18.3 (9.7-29.1) | 53.3 (39.8-65.1) | 21.7 (12.2-32.9) | 58.3 (44.6-69.8) | 28.3 (17.5-40.1) | 63.1 (48.6-74.6) | 35.4 (22.6-48.4) |
Metabolic toxicities
Among 141 metabolic complications, electrolyte abnormalities were the most common adverse events (n = 85; 60.3%), followed by hyperglycemia and hypoalbuminemia. There were 60 grade 2, 71 grade 3, and 10 grade 4 toxicities, respectively. The most common electrolyte derangement was hypophosphatemia, followed by hyponatremia and hypocalcemia, respectively. Hyperglycemia requiring insulin therapy was observed in 20 patients.
Infections
There were 125 infectious complications observed in 53 patients, which included 54 grade 2, 70 grade 3, and 1 grade 5, with a median onset of 12 days after CAR T-cell infusion. Eighty infection episodes occurred within 30 days after CAR T-cell infusion. Of 80 infection episodes during the first 30 days, 44 (55.0%) were neutropenic fever without localizing organs or unidentified pathogens, and therefore could be associated with CRS. The only 1 observed grade 5 infection was influenza A pneumonia that occurred in 1 patient around 5 months after CAR T-cell therapy. Bacteria was the most frequently identified causative pathogen of infection, observed in 30 patients. The cumulative incidence of overall, bacterial, viral, and fungal infection at 1 year were 63.3%, 57.2%, 44.7%, and 4%, respectively.
Hematologic toxicities
There were 104 hematologic toxicities (26 grade 2, 58 grade 3, and 20 grade 4). Thirty patients had prolonged cytopenia grade ≥2 involving at least 1 cell lineage at baseline before the initiation of lymphodepletion chemotherapy, including anemia (n = 24), leukopenia (n = 10), neutropenia (n = 7), and thrombocytopenia (n = 6). During the first 30 days, 59 patients (98%) developed at least 1 lineage cytopenia grade ≥2 (54 with anemia, 58 with leukopenia or neutropenia, and 36 with thrombocytopenia). A total of 94 persistent or recurrent cytopenic events after day +30 post–CAR T-cell therapy were observed in 38 patients (grade ≥3; n = 33). Most (90.4%) persistent/delayed-onset cytopenias occurred between day +31 and +180 post–CAR T-cell infusion. Among 33 patients who had grade ≥3 cytopenia after day +30, 10 were persistent cytopenia grade ≥3, extending beyond the first 30-day window post–CAR T-cell therapy (anemia, n = 8; leukopenia, n = 6; neutropenia, n = 2; thrombocytopenia, n = 8). Leukopenia with neutropenia was the most common cytopenia (70%) followed by thrombocytopenia (56.7%) and anemia (46.7%). Grade 4 cytopenia were observed in 16 patients (leukopenia, n = 4; neutropenia, n = 10; thrombocytopenia, n = 9). Eleven patients required blood product transfusion after day +30 post–CAR T-cell infusion (red blood cell, n = 11; platelet, n = 10). Twenty-two patients received at least 1 dose of granulocyte colony-stimulating factor for persistent or delayed-onset neutropenia after day +30. Other hematologic adverse events included coagulation abnormalities (n = 8) and deep vein thrombosis (n = 2). Of 8 patients who developed laboratory coagulation defects, only 1 patient had clinically significant disseminated intravascular coagulopathy.
Cardiovascular toxicities
Forty-eight cardiovascular adverse events were observed in 32 patients. Approximately 75% were grade 2 toxicities. Hypotension was the most common presentation (n = 28), and 80% were fluid responsive. A total of 27 hypotensive episodes occurred within the first 2 weeks and were associated with CRS. Atrial fibrillation and hypertension were observed in 7 and 5 patients, respectively. Other uncommon complications included syncopal episodes (n = 3), left ventricular dysfunction (n = 3), pericardial effusion (n = 1), and ventricular arrhythmia (n = 1).
Neurologic toxicities
There were 30 neurologic toxicities. Most neurologic manifestations occurred within 30 days after CAR T-cell therapy and were attributed to ICANS. The most prevalent neurologic presentation was confusion/cognitive impairment (n = 11) followed by headache (n = 6), aphasia (n = 3), and seizure (n = 2). Approximately 60% of events were grade 2 toxicities.
Pulmonary toxicities
Pulmonary toxicities were observed in 21 patients. Hypoxia was the most frequent complication (n = 18), 16 of which were associated with CRS and occurred within 10 days after CAR T-cell infusion. Other less common pulmonary events included pneumomediastinum (n = 1), pulmonary embolism (n = 1), isolated pleural effusion (n = 1), and allergic rhinitis (n = 1).
Hepatic toxicities
There were 19 hepatic adverse events seen in 15 patients (10 grade 2, 7 grade 3, and 1 grade 5). Elevated hepatic enzymes was the most common abnormality (n = 9). One patient developed fatal portal vein thrombosis resulting in acute fulminant hepatic failure. The cause of portal vein thrombosis in this patient was undetermined.
Gastrointestinal toxicities
Seventeen gastrointestinal toxicities were observed (11 grade 2 and 6 grade 3). The 3 most common adverse events included diarrhea (n = 8), pancreatitis (n = 2), and constipation (n = 2). Other rare complications consisted of perianal fistula, esophagitis, and vomiting.
Miscellaneous toxicities
Significant fatigue or physical deconditioning was observed in 10 patients, of whom one-half required medical intervention, including rehabilitation for an extended duration (grade 3). Anorexia with significant weight loss (≥5% reduction from baseline weight) was reported for a total of 7 occurrences. There were 5 events of psychiatric disorders requiring pharmacologic intervention, which included anxiety (n = 2), insomnia (n = 2), and depression (n = 1). Two episodes of renal insufficiency were seen, both of which were grade 2 and did not require renal replacement therapy. There were no instances of tumor lysis syndrome. Adrenal insufficiency requiring steroid replacement was noted in 1 patient.
Risk factors for severe toxicities (grade ≥3) in patients treated with CAR T-cell therapy
We evaluated the association between baseline characteristics and the occurrence of grade ≥3 toxicity in each organ system. Factors included in the Cox regression analysis included age, sex, type of CAR T-cell product, prior treatment, history of HCT, baseline lactate dehydrogenase (LDH), performance status, bridging chemotherapy, and time from leukapheresis to infusion (Table 3). The incidence of severe toxicities by organ systems was comparable between axicabtagene ciloleucel and tisagenlecleucel. Supplemental Figure 3 shows the distribution of organ toxicities grade ≥3 observed between 2 CAR T-cell products. The incidence of metabolic complications was higher in patients with impaired performance status (hazard ratio [HR], 2.4; 95% confidence interval [CI], 1.09-5.35). Patients with normal baseline LDH before lymphodepletion chemotherapy had a lower incidence of neurologic (HR, 0.19; 95% CI, 0.04-0.89) and pulmonary complications (HR, 0.12; 95% CI, 0.01-0.99) compared with patients with elevated LDH at baseline (Table 3). Patients with CRS had higher risk of developing severe (grade ≥3) metabolic (HR, 2.2; 95% CI, 1.1-4.8), pulmonary (HR, 8.0; 95% CI, 1.4-47.0), and neurologic (HR, 22.5; 95% CI, 2.8-178.3) complications. The distribution of organ toxicities by the occurrence of CRS is shown in supplemental Figure 4. Supplemental Table 3 shows the univariate Cox regression analysis between patient’s characteristics and toxicities grade ≥2.
Cox proportional hazard analysis of risk factors for severe (grade ≥3) CAR T-cell–associated organ-based toxicities
| HR (95% CI) | ||||||
|---|---|---|---|---|---|---|
| Cardiovascular | Metabolic | Hematologic | Infection with source | Neurologic | Pulmonary | |
| Age, ≥60 vs <60 y | 1.39 (0.37-5.24) | 1.43 (0.68-3.02) | 0.73 (0.37-1.45) | 0.78 (0.32-1.94) | 2.88 (0.62-13.3) | 1.75 (0.35-8.70) |
| CAR T-cell product, tisagenlecleucel vs axicabtagene ciloleucel | N/A* | 0.62 (0.27-1.44) | 0.46 (0.19-1.13) | 0.96 (0.35-2.64) | 0.23 (0.03-1.80) | 0.89 (0.18-4.43) |
| Prior therapy, ≥3 vs <3) | 1.73 (0.36-8.21) | 1.45 (0.65-3.24) | 0.88 (0.43-1.82) | 2.96 (1.02-9.78) | 1.16 (0.31-4.38) | N/A* |
| History of SCT, yes vs no | 0.66 (0.15-3.00) | 1.12 (0.52-2.42) | 1.38 (0.67-2.84) | 1.11 (0.43-2.90) | 0.61 (0.13-2.82) | 1.74 (0.43-7.29) |
| Baseline LDH, normal vs high | 0.65 (0.19-2.24) | 0.53 (0.26-1.07) | 0.55 (0.28-1.08) | 1.13 (0.42-2.41) | 0.19 (0.04-0.89) | 0.12 (0.01-0.99) |
| Performance status, ≥2 vs 0-1 | 0.42 (0.05-3.32) | 2.41 (1.09-5.35) | 0.94 (0.38-2.30) | 1.88 (0.53-6.71) | 2.82 (0.80-10.0) | 1.46 (0.28-7.54) |
| Bridging therapy before CAR T cell, yes vs no | 2.56 (0.54-12.0) | 1.24 (0.61-2.50) | 1.29 (0.62-2.68) | 0.49 (0.20-1.17) | 6.40 (0.82-50.1) | 4.40 (0.54-35.8) |
| Time from leukapheresis to CAR T-cell infusion, d | 0.88 (0.79-0.99) | 0.99 (0.96-1.02) | 0.99 (0.96-1.02) | 1.00 (0.97-1.04) | 0.97 (0.91-1.03) | 0.95 (0.87-1.03) |
| CRS, yes vs no | 2.64 (0.72-9.75) | 2.25 (1.06-4.75) | 1.71 (0.87-3.35) | 1.49 (0.59-3.75) | 22.48 (2.83-178.32) | 8.04 (1.37-47.05) |
SCT, stem cell transplantation.
N/A, not applicable because no event occurred in either subgroup, so HR could not be calculated for that comparison.
Outcomes
With a median follow-up of 9 months, 33 patients (55%) relapsed/progressed, and 21 patients (35%) had died. The estimated 1-year EFS and OS were 40% (95% CI, 28% to 56%) and 69% (95% CI, 57% to 82%), respectively (Figure 4). The most common cause of death was disease progression (n = 19). Two patients (3.3%) died in remission, 1 due to severe influenza A pneumonia (at 5 months) and 1 of extensive hepatic vein thrombosis (at 1 year). The 1-year NRM was 1.7% (95% CI, 0.1% to 8.0%). Among all toxicities, the univariable analysis demonstrated that mortality risk of patients who developed severe pulmonary complications (grade ≥3) was 3 times higher than patients without pulmonary complications (HR, 2.92; 95% CI, 1.06-8.02) (Table 4). Neither severe CRS nor neurological toxicities were associated with an increased risk of relapse or mortality. When grade ≥2 toxicities were analyzed by univariate Cox regression, we found no significant association with mortality (supplemental Table 4). There was no association between organ toxicities and EFS. Due to the very low rate of NRM in our cohort, statistical tests for association between toxicities and NRM were not analyzable. Multivariable analysis was not performed due to the small number of patients.
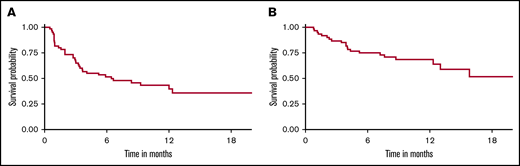
EFS and OS of aggressive large B-cell NHL treated with CD19-specific CAR T-cell therapy. (A) EFS (1-year EFS, 40%). (B) OS (1-year OS, 69%).
Univariate analysis for the association between organ-based toxicities grade ≥3 and risk of event and death
| EFS | OS | |||
|---|---|---|---|---|
| HR (95% CI) | P | HR (95% CI) | P | |
| Cardiovascular-based complication | 1.27 (0.55-2.91) | .57 | 1.15 (0.38-3.42) | .80 |
| Hematologic-based complication | 2.24 (0.91-5.49) | .08 | 1.35 (0.53-3.44) | .54 |
| Metabolic-based complication | 1.29 (0.66-2.52) | .46 | 1.62 (0.66-3.96) | .29 |
| Neurologic-based complication | 1.14 (0.51-2.52) | .75 | 1.66 (0.64-4.32) | .30 |
| Pulmonary-based complication | 2.28 (0.94-5.56) | .07 | 2.92 (1.06-8.02) | .04 |
| Infection-based complication | 1.14 (0.53-2.47) | .74 | 1.57 (0.62-3.93) | .34 |
| CRS | 1.95 (0.80-4.72) | .14 | 2.43 (0.81-7.29) | .11 |
Discussion
In this cohort of 60 patients with DLBCL treated with FDA-approved CD19 CAR T cells, we describe a comprehensive and detailed analysis of toxicities associated with CAR T-cell therapy, both during early and delayed phases after treatment. Although almost all patients developed toxicities, most toxicities occurred within the first 100 days after CAR T-cell infusion. This finding is similar to the result of the ZUMA-1 and JULIET studies, in which 85% to 90% of patients developed at least 1 adverse event (any grade), especially during the first 60 days after CAR T-cell infusion.7,8 Despite the systemic nature of immune-mediated toxicities, our study demonstrated that patients notably experienced metabolic, infectious, hematologic, and cardiovascular complications. Most cardiovascular and pulmonary complications were attributed to the manifestations of CRS. In contrast, certain organ adverse events, for example, renal complication was rarely observed as we previously reported.9 In addition, the majority of toxicities were manageable, and very few events led to a life-threatening outcome. According to our observation, only severe pulmonary toxicity (grade ≥3) was associated with an increased risk of death. Our study also highlights that each organ system was unequally affected by CAR T cells. Moreover, toxicity in each organ system had an unequal clinical impact on patients and may require more attention in management to improve CAR T-cell treatment experience.
The ASTCT recently published guidelines for CRS and ICANS grading.5 However, there is currently no standardized way to assess other toxicities related to CAR T-cell therapy. Recently, our group reported the comparison and performance of CRS and ICANS among different grading systems.6 Discordant interpretations among grading systems were observed and may contribute to different management decisions. A standardized toxicity assessment in CAR T-cell recipients is critical to accurately identify the events, which potentially will lead to better monitoring and proper management, and eventually result in improved CAR T-cell experience and resource utilization.10 Our study applied the CTCAE version 5.0, which is a standard toxicity assessment tool in the experimental trials.
Data from pivotal studies mostly focused on the incidence of CRS and ICANS but did not systematically stratify the burden of toxicities in organ-based fashion. In addition, most studies also focused on the toxicities occurring during the early follow-up after CAR T cell. In the ZUMA-1 study (NCT02348216), the most common grade ≥3 toxicities reported were hematological toxicities (neutropenia, 78%; anemia, 43%; thrombocytopenia, 38%) followed by febrile neutropenia (31%) and encephalopathy (21%).7,11 Toxicity data from the JULIET trial (NCT02445248) indicated that 85% of patients had at least 1 grade 3 or higher toxicity during the first 8 weeks. Common adverse events (excluding CRS and ICANS) included prolonged cytopenias (34%), infections (19%), and febrile neutropenia (15%).8,12 The occurrence of severe toxicities was seen less often after 8 weeks and was observed in 45% of patients. Recent data from real-world experience observed comparable outcomes and rates of CRS and ICANS similar to clinical trial settings.13-15 Although the incidence of most toxicities in our study was similar among baseline and treatment characteristics, there were some notable findings. LDH, numbers of prior therapies, and types of CAR T products appeared to be common predictors of treatment-related complications. LDH, a nonspecific surrogate of tumor replication, was demonstrated as a predictor of CAR T-cell–related toxicities in previous studies.16 Data from pediatric ALL indicated that bone marrow blasts >25% were associated with cardiovascular outcomes in CAR T-cell treated patients.17 Although we did not see the correlation between tumor bulk or LDH and cardiovascular toxicities, we saw a similar association trend. Interestingly, we observed increased risks of pulmonary and neurologic complications in patients with elevated baseline LDH. According to this finding, patients with high disease burden may require a more preemptive approach for toxicity monitoring and treatments. The higher number of prior therapies had a trend toward higher infectious complications. This observation should be further explored in a prospective setting for plausible mechanisms as current guidelines on antimicrobial prophylaxis for CAR T cells are mostly adopted from allogeneic HCT. Lastly, although the difference in toxicities between CAR T-cell products and lymphodepletion regimens was not seen in all individual presentations, tisagenlecleucel showed a trend toward lower incidence of most treatment-related adverse events compared with axicabtagene ciloleucel (supplemental Figure 3). This finding is in accordance with our previous report, which demonstrated a trend toward higher incidence of CRS and ICANS in patients who received axicabtagene ciloleucel compared with tisagenlecleucel.6 However, the statistical significance may not be appreciated owing to the relatively small sample size in this study. Regarding the lymphodepletion chemotherapy, because the regimen was directly related to the CAR T construct given, we are unable to separate the effects of the lymphodepletion and the specific CAR T product. In addition, the selection of CAR T-cell product takes several factors in to account, including patient’s background, primary physician’s preference, and logistics, all of which could influence the distribution and incidence of toxicities observed for each CAR T-cell product.
Recent data from the TRANSCEND NHL 001 study reported grade 3 toxicities in 79% of patients.18 Prolonged cytopenia grade ≥3 was observed in 37% but severe infection (grade ≥3) occurred in 12%. Fatigue was a commonly reported event but mostly at a low grade. The quality-of-life data showed the improvement of quality of life over time.19,20 Unfortunately, we did not have data on the quality of life in our study but the correlation between toxicities and quality of life is actively being explored. The difference in toxicity rates and patterns between CAR T products might be attributed to the unique CAR T-cell kinetics or results of other confounding factors such as patient’s characteristics, physician observance, and baseline disease burdens.
Our study indicated that most toxicities resolved over time after longer follow-up, and delayed toxicities were uncommon and mostly mild in severity. These delayed toxicities were attributed mostly to late onset infection (Figure 3). Recently, Cordeiro and colleagues reported the delayed effect after day +90 in patients treated with CD19 CAR T cells.21 Common toxicities were infection, cytopenia, and hypogammaglobulinemia. We recently reported the incidence and pattern of cytopenia of patients treated with CAR T cells at our institution.22 In a separate study,23 we also reported a comparable incidence of hypogammaglobulinemia and infection in our DLBCL cohort after long-term follow up similar to the findings of Cordeiro’s study. Data in ALL patients treated with CAR T-cell from our center revealed that 31% of patients developed infections and 83% had hypogammaglobulinemia after day +30. Underlying B-cell lymphoid neoplasms may influence the immune function and infection patterns of the patients.24
Our study has several strengths. We systematically describe real-world data of CAR T-cell–associated complications and their burdens in the organ-system based approach both during the early and long-term follow-up. We uniformly allocated each toxicity using the standardized criteria. The detailed toxicity recognition will help physicians to understand the burdens and impacts of CAR T cells on patients’ well-being and treatment experience. Before the era of CAR T-cell therapy, treatment options for R/R DLBCL, especially relapse after autologous stem cell transplant, was very limited. Allogeneic HCT was the only treatment modality that could provide potential cure to these patients; however, a small proportion of patients could proceed with this approach partly due to foreseen transplant-related mortality. Our group previously reported detailed toxicity profiles in CD34-selected allogeneic HCT.25-27 The detailed toxicities analysis is an essential aspect of the value-based care transplant approach which will ultimately enhance the quality of allogeneic HCT.28 The data from our study, along with robust symptom burden data from patient-reported outcomes, could help set a benchmark for improving the quality of care for these patients and planning of future clinical trials aimed at reducing toxicities.29
Nevertheless, our study also has some notable limitations. Due to the retrospective nature of the study, the accuracy of the results highly depends upon appropriate documentation in the medical record. Missing data may affect the estimation and statistical power of the study. In contrast, overrecording may exaggerate the result of the study. We countered the overestimation bias by conducting cross-reviews among 3 abstracting authors and having the independent final consensus to correct any significant discrepancies by the fourth independent author. Second, the number of patients in this cohort is relatively small, which might limit the statistical power and prohibit the multivariable analysis due to multiple comparison biases.
In summary, CAR T-cell therapy is associated with a high toxicity burden, although most complications are acceptable and manageable. Most toxicities occurred early and resolved over time. A standardized and uniformed approach for a toxicity grading system is required to accurately characterize and monitor adverse events throughout the course of CAR T-cell therapy. Incorporating comprehensive toxicity assessments into the CAR T-cell management program requires a multidisciplinary effort to potentially lower the toxicity burden and lead to improved CAR T-cell tolerability.
Data-sharing requests may be e-mailed to the corresponding author, Miguel-Angel Perales, at peralesm@mskcc.org.
Acknowledgments
This work was supported, in part, by National Institutes of Health/National Cancer Institute Cancer Center Support Grant P30 CA008748.
The content is solely the responsibility of the authors and does not necessarily represent the official views of the National Institutes of Health.
Authorship
Contribution: K.W. and M.-A.P. designed the study and wrote the manuscript; K.W., M.P., and M.G.-R. collected the data and conducted the analysis; M.L.S., A.A., and M.A.M. participated in data collection; M.P. and M.G.-R. participated in the data analysis; J.R.F. and S.M.D. conducted the statistical analysis; C.L.B., G.L.S., M.S., M.L.P., P.B.D., C.S.S., B.D.S., and E.M. took care of the patients; and all the authors reviewed and approved the manuscript.
Conflict-of-interest disclosure: K.W. receives salary support from Parker Institute for Cancer Immunotherapy at Memorial Sloan Kettering Cancer Center. M.P. received salary support from an American Italian Cancer Foundation Postdoctoral Research Fellowship and from Associazione Italiana contro le Leucemie-linfomi e mieloma Milano e Provincia Organizzazione Non Lucrativa di Utilità Sociale. M.G.-R. reports receiving honoraria from Takeda and Janssen Pharmaceutical. M.S. has served as a paid consultant for McKinsey & Company, Angiocrine Bioscience, Inc, and Omeros Corporation; has received research funding from Angiocrine Bioscience, Inc; and has served on an ad hoc advisory board for Kite, a Gilead Company. G.L.S. receives research funding from Amgen and Janssen Pharmaceutical. C.L.B. serves as a paid consultant for Life Sci, GLG, Juno/Celgene, Seattle Genetics, and Kite/Gilead; reports receiving research funding from Janssen Pharmaceutical, Novarits, Epizume, Xynomics, and Bayer; and receives honorarium from Dava Oncology. M.L.P. has served on ad hoc advisory boards for Kite and Novartis. P.B.D. serves on the advisory board for Kite/Gilead. C.S.S. has served as a paid consultant on advisory boards for Juno Therapeutics, Sanofi-Genzyme, Spectrum Pharmaceuticals, Novartis, Genmab, Precision Biosciences, Kite, a Gilead Company, Celgene, Gamida Cell, and GlaxoSmithKline; and has received research funds for clinical trials from Juno Therapeutics, Celgene, Precision Biosciences, and Sanofi-Genzyme. B.D.S. provides consultancy for Kite/Gilead, Juno/Celgene, and Janssen; and also receives research support from ADC Therapeutics. M.-A.P. reports honoraria from Kite/Gilead, AbbVie, Bellicum, Bristol-Myers Squibb, Incyte, Merck, Novartis, Nektar Therapeutics, Omeros, and Takeda; serves on data and safety monitoring boards for Servier and Medigene, and the scientific advisory boards of MolMed and NexImmune; has received research support for clinical trials from Incyte, Kite/Gilead, and Miltenyi Biotec; and serves in a volunteer capacity as a member of the Board of Directors of the American Society for Transplantation and Cellular Therapy (ASTCT) and Be the Match (National Marrow Donor Program [NMDP]), as well as on the Center for International Blood & Marrow Transplant Research (CIBMTR) Cellular Immunotherapy Data Resource (CIDR) Committee. The remaining authors declare no competing financial interests.
Correspondence: Miguel-Angel Perales, Adult BMT Service, Division of Hematologic Malignancy, Department of Medicine, Memorial Sloan Kettering Cancer Center, 1275 York Ave, Box 298, New York, NY 10065; e-mail: peralesm@mskcc.org.

