

Key Points
Bridging therapy before CAR T-cell therapy is pursued in high-risk patients, including those with high IPI, elevated LDH, and bulky disease.
Radiation therapy can be an effective bridging option for disease control before CAR T-cell therapy.

Abstract
The impact of bridging therapy (BT) administered between leukapheresis and chimeric antigen receptor (CAR) T-cell therapy for large B-cell lymphoma (LBCL) is unclear. We evaluated the influence of BT (systemic therapy [ST], radiation therapy [RT], or combined-modality therapy [CMT]) on outcomes of 148 LBCL patients who underwent leukapheresis for planned axicabtagene ciloleucel (axi-cel) infusion. The 55% (n = 81) of patients who received BT were more likely to have international prognostic index (IPI) score ≥3 (P ≤ .01), bulky disease (P = .01), and elevated lactate dehydrogenase (LDH; P ≤ .01). The 1-year progression-free (PFS) and overall survival (OS) rates were 40% and 65% in non-BT patients vs 21% and 48% in BT patients (P = .01 and .05, respectively). Twenty-four patients (16%) did not receive axi-cel, most commonly because of lymphoma progression (88%), despite 80% (n = 19) receiving BT. Among 124 patients who received axi-cel, 50% (n = 62) received BT with ST (n = 45), RT (n = 11), or CMT (n = 6); 1-year PFS and OS rates were not significantly different between BT and non-BT cohorts (P = .06 and .21, respectively). There was no difference in proportion of patients with IPI ≥3, limited-stage disease, or elevated LDH between ST, RT, and CMT groups. Compared with non-BT patients, 1-year PFS was inferior for ST-bridged patients (P = .01). RT-bridged patients had improved PFS compared with ST-bridged patients (P = .05). Despite the poor prognosis associated with requiring BT, RT can be an effective bridging strategy. Future studies are necessary to identify strategies that may improve access to CAR T-cell therapy and outcomes.
Introduction
Chimeric antigen receptor (CAR) therapy targeting CD19 is a promising treatment for patients with relapsed or refractory (R/R) large B-cell lymphoma (LBCL). Two autologous CD19-directed CAR T-cell therapies (axicabtagene ciloleucel [axi-cel] and tisagenlecleucel) are approved for the treatment of these patients based on promising initial overall response rates (ORRs), with sustained responses confirmed in a significant fraction of patients.1-4
Many candidates for CAR T-cell therapy have symptomatic disease that could be fatal if left untreated during the cell-manufacturing period. Often oncologists address this dilemma with bridging therapy (BT; commonly referred to as therapy administered after apheresis and before CAR T-cell infusion), which may include steroids, chemotherapy, targeted therapy, or radiation therapy (RT).5,6 However, the ZUMA-1 trial that led to axi-cel approval did not permit the administration of BT other than dexamethasone.1
It is unclear if BT adversely affects outcome. The US Lymphoma CAR T Consortium evaluated the influence of BT among 298 patients who underwent leukapheresis with the intent to deliver axi-cel at 17 academic institutions, including patients from our institution.5 Of the 53% of patients who received BT, 23% received steroids alone, 54% received chemotherapy, 12% received RT, and 10% received targeted therapy. On multivariable analysis, of the 275 patients who received axi-cel, BT was associated with inferior overall survival (OS). The impact of RT compared with other bridging strategies was not reported.
RT is an effective tool for R/R LBCL patients, with ORRs in excess of 80%.7 Although the long-term durability of RT response for chemotherapy-refractory LBCL is moderate, in the bridging setting, RT can effectively address burdensome disease and may improve outcomes when coupled with cellular therapy.6,8-10 RT has been shown to enable presentation of tumor-associated antigens for the priming of antigen-specific T cells, facilitate homing of antigen-specific T cells, and augment effector function and proliferation of native and adoptively transferred T cells.11 Preclinical data in a pancreatic adenocarcinoma model suggest that RT conditioning may promote susceptibility to CAR therapy and decrease antigen-negative tumor relapse.12
We sought to evaluate the influence of BT on the outcome of a large cohort of R/R LBCL patients who underwent leukapheresis for the purpose of treatment with commercially available axi-cel therapy at a single institution. The present study evaluates the impact of various bridging strategies among patients treated with BT before CAR T-cell immunotherapy.
Methods
Patient selection
After institutional review board approval (protocol PA15-1064 entitled, “Retrospective chart review of hematologic malignancies treated with and without radiation therapy”), we conducted a retrospective analysis of R/R LBCL patients age ≥18 years who underwent apheresis for commercially available axi-cel between November 2017 and September 2019. Patients with diffuse LBCL (DLBCL), high-grade B-cell lymphoma, transformed follicular lymphoma, or primary mediastinal B-cell lymphoma were eligible. The study was conducted in accordance with the principles of the Declaration of Helsinki.
BT, lymphodepletion chemotherapy, and CD19 CAR T-cell infusion
BT was defined as systemic therapy (ST; including steroids, chemotherapy, or targeted therapy), RT (administered as single modality), or combined-modality therapy (CMT; RT delivered concurrently with ST) administered between leukapheresis and lymphodepleting chemotherapy (cyclophosphamide [500 mg/m2] and fludarabine [30 mg/m2] administered on days −5, −4, and −3). If BT was initiated before leukapheresis but continued during the interval between leukapheresis and axi-cel infusion, it was considered BT. CAR T-cell treatment was a single infusion of axi-cel (2 × 10⁶ per kg CAR T cells) on day 0.
ICANS and CRS grading
Toxicity grading was conducted prospectively. Consensus criteria were used for grading cytokine release syndrome (CRS) and immune effector cell–associated neurotoxicity syndrome (ICANS) severity according to CARTOX criteria until April 201913 and thereafter according to American Society for Transplantation and Cellular Therapy criteria.14
Response evaluation
The international prognostic index (IPI) was based on disease factors at leukapheresis.15 Bulky disease was defined as a nodal/extranodal conglomerate of ≥10 cm. Disease response evaluations were generally conducted 1 month after CAR T-cell infusion with positron emission tomography–computed tomography (PET-CT) and based on the Lugano classification.16 Progression/relapse was determined using biopsy, imaging, and/or clinical assessment. Partial response (PR) on the first response evaluation was not considered an event unless biopsy confirmed lymphoma.
Study end points and statistical methods
All survival measures were defined from the date of leukapheresis. Progression-free survival (PFS) was defined as lymphoma progression, relapse, or death resulting from any cause. OS was defined as death resulting from any cause. The Kaplan-Meier method was used for survival time estimations.17 Differences between groups were compared using the log-rank test. Median follow-up times and 95% confidence intervals (CIs) were calculated using the reverse Kaplan-Meier method.18 The cutoff for data analysis was 27 January 2020.
Between patient cohorts, categorical variables were compared by the χ2 or Fisher’s exact test. The Student t test was used to compare continuous variables. The nonparametric independent samples median test was used to compare median values between 2 groups. Statistical analyses were performed using SPSS (version 24; IBM, Armonk, NY) and GraphPad Prism software (version 8.0, GraphPad, San Diego, CA). All comparisons were 2 sided.
Results
Patient and BT characteristics
Patients who underwent leukapheresis.
A total of 148 patients with R/R LBCL underwent leukapheresis (Table 1). Median age was 60 years (range, 18-85 years). Most patients had DLBCL (n = 115; 78%).
Characteristics of patients who underwent apheresis (N = 148) and those who received CAR T-cell therapy (N = 124)
| Apheresis (N = 148) | CAR T-cell infusion (N = 124) | |||||||
|---|---|---|---|---|---|---|---|---|
| Characteristic | All patients (N = 148) | No BT (n = 67) | BT (n = 81) | P | All patients (N = 124) | No BT (n = 62) | BT (n = 62) | P |
| Age, y | .88 | .59 | ||||||
| Median | 60 | 60 | 59 | 60 | 60 | 60 | ||
| Range | 18-85 | 18-84 | 18-85 | 18-85 | 18-84 | 18-85 | ||
| >60 | 76 (51) | 36 (54) | 40 (49) | .62 | 64 (52) | 32 (52) | 32 (52) | 1.00 |
| Female sex | 42 (28) | 21 (31) | 21 (26) | .47 | 32 (26) | 18 (29) | 14 (23) | .54 |
| ECOG PS 2-3 | 30 (20) | 7 (10) | 23 (28) | .01 | 17 (14) | 4 (7) | 13 (21) | .03 |
| Pathology | .78 | .61 | ||||||
| DLBCL | 115 (78) | 52 (78) | 63 (78) | 95 (77) | 49 (79) | 46 (74) | ||
| TFL | 24 (16) | 10 (15) | 14 (17) | 20 (16) | 8 (13) | 12 (19) | ||
| PMBCL | 9 (6) | 5 (8) | 4 (5) | 9 (7) | 5 (8) | 4 (7) | ||
| Cell of origin | .57 | .32 | ||||||
| GCB | 86 (58) | 36 (54) | 50 (62) | 72 (58) | 32 (51) | 40 (65) | ||
| Non-GCB | 55 (37) | 28 (42) | 27 (33) | 46 (37) | 27 (44) | 19 (31) | ||
| Unknown | 7 (5) | 3 (5) | 4 (5) | 6 (5) | 3 (5) | 3 (5) | ||
| Double expresser | .31 | .56 | ||||||
| Yes | 45 (30) | 18 (27) | 27 (33) | 36 (29) | 16 (26) | 20 (32) | ||
| No | 76 (51) | 39 (58) | 37 (46) | 68 (55) | 37 (60) | 31 (50) | ||
| Unknown | 27 (18) | 10 (15) | 17 (21) | 20 (16) | 9 (14) | 11 (18) | ||
| HGBL-DH/TH | .11 | .09 | ||||||
| Yes | 30 (20) | 9 (13) | 21 (26) | 23 (19) | 7 (11) | 16 (26) | ||
| No | 107 (72) | 54 (81) | 53 (65) | 92 (74) | 51 (82) | 41 (661) | ||
| Unknown | 11 (7) | 4 (6) | 7 (8.6) | 9 (7) | 4 (7) | 5 (8) | ||
| Stage at apheresis | .14 | .20 | ||||||
| I/II | 19 (13) | 12 (18) | 7 (9) | 18 (15) | 12 (19) | 6 (10) | ||
| III/IV | 129 (87) | 55 (82) | 74 (81) | 106 (85) | 50 (81) | 56 (91) | ||
| IPI ≥3 | 88 (60) | 30 (45) | 58 (72) | <.01 | 68 (55) | 27 (44) | 41 (66) | .02 |
| Bulky disease (≥10 cm) | 46 (31) | 14 (21) | 32 (40) | .01 | 33 (27) | 11 (18) | 22 (36) | .04 |
| Lines of prior therapy, n | .55 | .39 | ||||||
| Median | 3 | 3 | 3 | 3 | 3 | 3 | ||
| Range | 2-11 | 2-11 | 2-9 | 2-11 | 2-11 | 2-9 | ||
| ≥3 | 110 (74) | 47 (70) | 63 (78) | .35 | 87 (71) | 43 (69) | 44 (71) | 1.00 |
| Serum LDH, IU/L* | ||||||||
| >ULN | 110 (74) | 41 (61) | 69 (85) | <.01 | 87 (71) | 37 (60) | 50 (81) | .01 |
| >2× ULN | 45 (32) | 11 (17) | 34 (44) | <.01 | 26 (22) | 8 (13) | 18 (31) | .03 |
| Median time from leukapheresis to axi-cel infusion, d | 29.0 | 29.5 | 29.0 | 1.00 | ||||
Values are n (%) unless otherwise noted. P values in bold indicate statistical significance (≤.05).
ECOG PS, Eastern Cooperative Oncology Group performance status; GCB, germinal center B-cell type; HGBL-DH/TH, high-grade B-cell lymphoma with MYC and BCL2 and/or BCL6 rearrangements; LDH, lactate dehydrogenase; PMBCL, primary mediastinal B-cell lymphoma; TFL, transformed follicular lymphoma; ULN, upper limit of normal.
LDH data unavailable for 5 patients.
BT was administered to 55% of patients (n = 81) using ST (75%; n = 61), RT (14%; n = 11), or CMT (11%; n = 9). At leukapheresis, patients who received BT were more likely to have Eastern Cooperative Oncology Group PS of 2 to 3 (P = .01), IPI ≥3 (P < .01), bulky disease (P = .01), and elevated LDH (P < .01; Table 1). Sixteen percent of patients (n = 24) did not receive CAR T-cell therapy (Table 2). Of the 61 patients who received ST bridging, 16 (26%) did not undergo axi-cel infusion because of disease progression (n = 14), failed manufacturing (n = 1), or decision to postpone after CR with BT (n = 1). All 11 patients who received RT bridging underwent axi-cel infusion. Of the 9 patients treated with CMT bridging, 3 (33%) did not receive CAR T-cell therapy because of disease progression (n = 2) or failed manufacturing (n = 1). Sixty-seven patients were not administered BT, and 5 of them (7%) did not receive axi-cel infusion because of lymphoma progression.
Patient and treatment characteristics of patients who underwent apheresis according to receipt of CAR T-cell therapy
| All patients (N = 148) | Apheresis (N = 148) | |||
|---|---|---|---|---|
| Characteristic | CAR T-cell infusion (n = 124) | No CAR T-cell infusion (n = 24) | P | |
| Age, y | .71 | |||
| Median | 60 | 60 | 60 | |
| Range | 18-85 | 18-85 | 31-80 | |
| >60 | 76 (51) | 64 (52) | 12 (50) | .89 |
| Female sex | 42 (28) | 32 (26) | 10 (42) | .14 |
| ECOG PS 2-3 | 30 (20) | 17 (14) | 13 (54) | <.01 |
| Pathology | .39 | |||
| DLBCL | 115 (78) | 95 (77) | 20 (83) | |
| TFL | 24 (16) | 20 (16) | 4 (17) | |
| PMBCL | 9 (6) | 9 (7) | 0 (0) | |
| Cell of origin | .99 | |||
| GCB | 86 (58) | 72 (58) | 14 (58) | |
| Non-GCB | 55 (37) | 46 (37) | 9 (38) | |
| Unknown | 7 (5) | 6 (5) | 1 (4) | |
| Double expresser | .13 | |||
| Yes | 45 (30) | 36 (29) | 9 (38) | |
| No | 76 (51) | 68 (55) | 8 (33) | |
| Unknown | 27 (18) | 20 (16) | 7 (29) | |
| HGBL-DH/TH | .47 | |||
| Yes | 30 (20) | 23 (19) | 7 (29) | |
| No | 107 (72) | 92 (74) | 15 (63) | |
| Unknown | 11 (7) | 9 (7) | 2 (8) | |
| Stage at apheresis | .31 | |||
| I/II | 19 (13) | 18 (15) | 1 (4) | |
| III/IV | 129 (87) | 106 (85) | 23 (96) | |
| IPI ≥3 | 88 (60) | 68 (55) | 20 (83) | .01 |
| Bulky disease (≥10 cm) | 46 (31) | 33 (27) | 13 (54) | .01 |
| Lines of prior therapy, n | .67 | |||
| Median | 3 | 3 | 3 | |
| Range | 2-11 | 2-11 | 2-6 | |
| ≥3 | 110 (74) | 87 (71) | 23 (96) | .01 |
| Serum LDH, IU/L* | ||||
| >ULN | 110 (74) | 87 (71) | 24 (100) | .01 |
| >2× ULN | 45 (32) | 26 (22) | 19 (79) | <.01 |
| BT | .01 | |||
| Any | 81 (55) | 62 (50) | 19 (79) | |
| ST | 61 (41) | 45 (36) | 16 (67) | |
| RT | 11 (7) | 11 (9) | 0 (0) | |
| CMT | 9 (6) | 6 (5) | 3 (13) | |
| PFS, mo | <.01 | |||
| Median | 4.8 | 6.2 | 0.7 | |
| 95% CI | 3.7-6.0 | 4.1-8.3 | 0.5-1.0 | |
| OS, mo | <.01 | |||
| Median | 16.7 | 21.9 | 1.3 | |
| 95% CI | 7.1-26.2 | NE | 0.8-1.8 | |
Values are n (%) unless otherwise noted. P values in bold indicate statistical significance (≤.05).
NE, not estimable.
LDH data unavailable for 5 patients.
Patients who received axi-cel therapy.
A total of 124 patients (84%) received axi-cel infusion after leukapheresis (Table 1). Sixty-two patients were treated with BT using ST (n = 45; 73%), RT (n = 11; 18%), or CMT (n = 6; 9%). Median time from leukapheresis to axi-cel infusion was 29 days for all patients, with no difference between bridged (29 days) and nonbridged patients (29.5 days; P = 1.00; Table 1). Within the ST group, 31 patients (69%) received cytotoxic chemotherapy, 10 (22%) received targeted therapy, and 4 (9%) received high-dose corticosteroids. Among the 31 patients who received chemotherapy, the most common regimen was hyperfractionated cyclophosphamide (n = 19) administered alone (n = 1) or with rituxan (n = 16) or obinutuzumab (n = 2).
For the RT-alone cohort, median RT dose was 35.2 Gy (range, 10-45 Gy), with median fraction size of 2.5 Gy (range, 1.8-2.6 Gy). Irradiated sites included the spine (n = 1), neck (n = 1), thorax (n = 3), and abdomen/pelvis (n = 6). At the time of RT, 7 patients had pain, 1 patient had neurologic deficit, and 2 patients had a compressive symptom from lymphoma in the thorax. RT was initiated before leukapheresis in 4 patients.
In the CMT group, ST was administered concurrently with chemotherapy (n = 4) or targeted therapy (n = 2). Chemotherapy regimens included fractionated cyclophosphamide with rituximab (n = 2), rituximab, gemcitabine, and oxaliplatin (n = 1), and rituximab, high-dose cytarabine, and cisplatin (n = 1). Targeted therapy was administered with rituximab in 1 patient and with obinutuzumab, lenalidomide, and dexamethasone in 1 patient. Median RT dose in the CMT group was 35 Gy (range, 9-46 Gy), with median fraction size of 2.5 Gy (range, 2-5 Gy). Irradiated sites included the axilla and extremity (n = 1), thorax (n = 2), and abdomen/pelvis (n = 3). RT was initiated before leukapheresis in 2 patients. Four patients were referred for pain. Two patients had neurologic symptoms and 1 patient had compressive symptoms from thoracic disease.
There was no difference in a majority of patient and disease characteristics between the ST, RT, and CMT cohorts at leukapheresis, including IPI ≥3, limited-stage disease at apheresis, and LDH >2× ULN (Table 3). RT patients did, however, have a median of 2 lines of prior therapy, compared with 3 lines of therapy in the ST (P = .01) and CMT (P = .01) groups (Table 3).
Patient and treatment characteristics of patients who underwent CAR T-cell therapy (n = 124) according to type of BT
| BT | P | |||||||||
|---|---|---|---|---|---|---|---|---|---|---|
| Characteristic | No BT (n = 62) | ST (n = 45) | RT (n = 11) | CMT (n = 6) | No BT vs ST | No BT vs RT | No BT vs CMT | ST vs RT | ST vs CMT | RT vs CMT |
| Age, y | .55 | .05 | .02 | .15 | .02 | .01 | ||||
| Median | 60 | 60 | 68 | 40.5 | ||||||
| Range | 18-84 | 18-85 | 51-84 | 24-67 | ||||||
| >60 | 32 (52) | 23 (51) | 7 (64) | 2 (33) | 1.00 | .53 | .67 | .52 | .67 | .34 |
| Female sex | 18 (29) | 10 (22) | 2 (18) | 2 (33) | .51 | .72 | 1.00 | 1.00 | .62 | .58 |
| ECOG PS 2-3 | 4 (7) | 10 (22) | 1 (9) | 2 (33) | .02 | .57 | .08 | .43 | .62 | .52 |
| Pathology | .44 | .25 | .27 | .13 | .52 | .04 | ||||
| DLBCL | 49 (79) | 32 (71) | 11 (100) | 3 (50) | ||||||
| TFL | 8 (13) | 10 (22) | 0 (0) | 2 (33) | ||||||
| PMBCL | 5 (8) | 3 (7) | 0 (0) | 1 (17) | ||||||
| Cell of origin | .54 | .10 | .84 | .26 | .67 | .15 | ||||
| GCB | 32 (51) | 28 (62) | 9 (82) | 3 (50) | ||||||
| Non-GCB | 27 (44) | 15 (33) | 1 (9) | 3 (50) | ||||||
| Unknown | 3 (5) | 2 (5) | 1 (9) | 0 (0) | ||||||
| Double expresser | .91 | .18 | .10 | .28 | .16 | .16 | ||||
| Yes | 16 (26) | 13 (29) | 3 (27) | 4 (67) | ||||||
| No | 37 (60) | 25 (56) | 4 (36) | 2 (33) | ||||||
| Unknown | 9 (14) | 7 (15) | 4 (36) | 0 (0) | ||||||
| HGBL-DH/TH | .45 | <.01 | .28 | .07 | .65 | .37 | ||||
| Yes | 7 (11.3) | 9 (20) | 5 (46) | 2 (33) | ||||||
| No | 51 (82) | 33 (73) | 4 (26) | 4 (67) | ||||||
| Unknown | 4 (7) | 3 (7) | 2 (18) | 0 (0) | ||||||
| Stage at apheresis | .17 | 1.00 | .58 | .59 | 1.00 | .52 | ||||
| I/II | 12 (19) | 4 (9) | 2 (18) | 0 (0) | ||||||
| III/IV | 50 (81) | 41 (91) | 9 (82) | 6 (100) | ||||||
| IPI ≥3 | 27 (44) | 31 (69) | 6 (55) | 4 (67) | .01 | .53 | .40 | .48 | 1.00 | 1.00 |
| Bulky disease (≥10 cm) | 11 (18) | 14 (31) | 4 (36) | 4 (67) | .16 | .22 | .02 | .73 | .17 | .23 |
| Lines of prior therapy, n | .90 | .02 | .53 | .01 | .44 | .01 | ||||
| Median | 3 | 3 | 2 | 3 | ||||||
| Range | 2-11 | 2-9 | 2-3 | 2-4 | ||||||
| ≥3 | 43 (69) | 36 (80) | 3 (27) | 5 (83) | .27 | .02 | .66 | <.01 | 1.00 | .05 |
| Serum LDH, IU/L* | ||||||||||
| >ULN | 37 (60) | 38 (86) | 7 (64) | 5 (83) | .02 | .09 | .51 | .09 | .92 | .52 |
| >2× ULN | 8 (13) | 12 (27) | 2 (22) | 4 (67) | .08 | .61 | .01 | 1.00 | .07 | .14 |
Values are n (%) unless otherwise noted. P values in bold indicate statistical significance (≤.05).
LDH data unavailable for 5 patients in the no BT (n = 2), ST (n = 1), and RT (n = 2) cohorts.
There was no difference in median white blood cell or absolute lymphocyte counts between patients who did not receive BT and the various BT cohorts just before lymphodepleting chemotherapy (Table 4). At the time of conditioning, median white blood cell count was slightly higher for patients who received BT (4.6 × 10⁹/L) compared with those who did not (4.35 × 10⁹/L; P = .02), likely reflecting growth factor administration.
WBC counts according to BT
| BT | P | |||||||||||
|---|---|---|---|---|---|---|---|---|---|---|---|---|
| No BT (n = 62) | All (n = 62) | ST (n = 45) | RT (n = 11) | CMT (n = 6) | No BT vs BT | No BT vs ST | No BT vs RT | No BT vs CMT | ST vs RT | St vs CMT | RT vs CMT | |
| At time of leukapheresis | ||||||||||||
| WBC count | 4.5 (1.5-14.5) | 4.85 (1.7-18.7) | 4.9 (1.8-18.7) | 4.3 (1.7-13.5) | 6.75 (3.0-10.2 | .20 | .24 | .72 | .20 | .76 | .61 | .52 |
| ALC | 0.71 (0.03-3.02) | 0.62 (0.09-2.03) | 0.59 (0.09-2.03) | 0.65 (0.24-1.58) | 0.38 (0.32-1.33) | .33 | .53 | .57 | .28 | .83 | .37 | .43 |
| At time of conditioning | ||||||||||||
| WBC count | 4.35 (0.6-16.5) | 4.6 (0.7-20.6) | 5.4 (1.3-20.6) | 3.1 (0.7-7.0) | 4.65 (1.9-19.0 | .05 | .02 | .24 | .02 | .06 | .45 | .08 |
| ALC | 0.63 (0.1-3.55) | 0.52 (0.07-1.94) | 0.51 (0.07-1.94) | 0.62 (0.23-1.69) | 4.65 (1.9-19.0) | .15 | .21 | .75 | .27 | .62 | .43 | .19 |
Values are median (range) unless otherwise noted. P values in bold indicate statistical significance (≤.05).
ALC, absolute lymphocyte count; WBC, white blood cell.
Survival outcomes
Patients who underwent leukapheresis.
For all patients (n = 148), at median follow-up of 11.1 months (95% CI, 9.9-12.3 months), 97 of 148 patients had progressive lymphoma or died. Median PFS and OS for the entire cohort were 4.8 months (95% CI, 3.7-6.0 months) and 16.7 months (95% CI, 7.1-26.2 months), respectively. The 1-year PFS and OS rates for the entire cohort were 30% and 56%, respectively. PFS and OS outcomes were worse for patients who received BT (Figure 1A-B). Median PFS for patients who received BT was 3.4 months (95% CI, 1.6-5.2 months), compared with 7.3 months (95% CI, 2.8-11.8 months) for patients who did not receive bridging (P = .01). Median OS was not reached for patients who did not receive BT and 10.3 months (95% CI, 0.4-20.2 months) for patients who were treated with bridging (P = .05). For the 24 patients who did not undergo CAR T-cell therapy, median OS from apheresis was 1.3 months (95% CI, 0.8-1.8 months), with 22 of 24 patients dying as a result of disease (Table 2).

Survival outcomes in patients treated with or without BT. Kaplan-Meier estimates of PFS (A) and OS (B) in patients with R/R LBCL who underwent leukapheresis according to receipt of BT, and estimates of PFS (C) and OS (D) in R/R LBCL patients who received CAR T-cell therapy. The numbers of patients at risk in 5-month intervals are indicated.
Survival outcomes in patients treated with or without BT. Kaplan-Meier estimates of PFS (A) and OS (B) in patients with R/R LBCL who underwent leukapheresis according to receipt of BT, and estimates of PFS (C) and OS (D) in R/R LBCL patients who received CAR T-cell therapy. The numbers of patients at risk in 5-month intervals are indicated.
Patients who received axi-cel.
For axi-cel–treated patients (n = 124), the 1-year PFS and OS rates were 37% and 64%, respectively. The 1-year PFS rate was 44% for patients who did not receive BT vs 29% for patients who did receive BT (P = .06; Figure 1C). There was no statistical difference in 1-year OS (P = .22) according to receipt of BT (Figure 1D).
For all 124 patients, the ORR was 77%, with 60 patients achieving CR on the initial 30-day post–CAR T-cell disease assessment and 36 patients achieving PR (Table 5). Six patients did not undergo disease assessment because of toxicity, which was fatal in all patients (4 patients in the ST group and 2 patients who did not receive BT). There was no difference in the ORR (P = .23) or CR rate (P = 1.0) among patients who did (n = 62) or did not (n = 62) receive BT (Table 5). There was also no difference in the ORR for patients who did not receive BT compared with the various cohorts of patients who received bridging with ST (n = 45; P = .08), RT (n = 11; P = .13), or CMT (n = 6; P = .38; Table 5). However, when comparing the various BT strategies, patients who received RT bridging had a higher ORR (P = .03) and CR rate (P = .01) compared with those who received ST bridging (Table 5). The ORR and CR rate for the RT cohort were 100% and 82%, respectively, compared with 67% and 38% in the ST cohort. The RT cohort also had a higher CR rate than patients who did not receive BT (48%; P = .04).
Treatment-related toxicity and survival outcomes among patients who received CAR T-cell therapy
| Characteristic | BT | P | |||||||||||
|---|---|---|---|---|---|---|---|---|---|---|---|---|---|
| All patients (n = 124) | No BT (n = 62) | ||||||||||||
| All (n = 62) | ST (n = 45) | RT (n = 11) | CMT (n = 6) | No BT vs BT | No BT vs ST | No BT vs RT | No BT vs CMT | ST vs RT | ST vs CMT | RT vs CMT | |||
| Outcome | |||||||||||||
| Overall response | 96 (77) | 51 (82) | 45 (73) | 30 (67) | 11 (100) | 4 (67) | .23 | .08 | .13 | .38 | .03 | 1.0 | .05 |
| CR | 60 (48) | 30 (48) | 30 (48) | 17 (38) | 9 (82) | 4 (67) | 1.0 | .30 | .04 | .38 | .01 | .18 | .50 |
| PR | 36 (29) | 21 (34) | 15 (24) | 13 (29) | 2 (18) | 0 (0) | |||||||
| SD/PD | 22 (18) | 9 (15) | 13 (21) | 11 (24) | 0 (0) | 2 (33) | |||||||
| Not assessed | 6 (5) | 2 (3) | 4 (7) | 4 (9) | 0 (0) | 0 (0) | |||||||
| PFS, mo | .06 | .01 | .52 | .36 | .05 | .78 | .17 | ||||||
| Median | 6.2 | 9.2 | 5.1 | 4.7 | 8.9 | 2.5 | |||||||
| 95% CI | 4.1-8.3 | 3.4-15.0 | 3.8-6.4 | 3.0-6.3 | 8.2-9.5 | 0.0-8.3 | |||||||
| OS, mo | .22 | .17 | .40 | .03 | .15 | .30 | .02 | ||||||
| Median | 21.9 | NR | 21.9 | 21.9 | NR | 3.9 | |||||||
| 95% CI | NE | NE | 0-47.6 | 0-8.7 | |||||||||
| Toxicity | |||||||||||||
| CRS grade ≥3 | 11 (9) | 6 (10) | 5 (8) | 4 (9) | 0 (0) | 1 (17) | 1.00 | 1.00 | .58 | .49 | .58 | .48 | .35 |
| CRES/ICANS grade ≥3 | 49 (40) | 21 (34) | 28 (45) | 22 (49) | 3 (27) | 3 (50) | .27 | .16 | 1.00 | .66 | .31 | 1.00 | .60 |
| Tocilizumab administration | 85 (69) | 41 (66) | 44 (71) | 31 (69) | 8 (73) | 5 (83) | .70 | .84 | 1.00 | .66 | 1.00 | .66 | 1.00 |
| Steroid administration | 73 (59) | 34 (55) | 39 (63) | 27 (60) | 7 (64) | 5 (83) | .47 | .69 | .75 | .23 | 1.00 | .39 | .60 |
| ICU admission | 46 (37) | 19 (31) | 27 (44) | 20 (44) | 3 (27) | 4 (67) | .19 | .16 | 1.00 | .17 | .50 | .40 | .16 |
| Death resulting from toxicity | 11 (9) | 4 (6) | 7 (11) | 7 (16) | 0 (0) | 0 (0) | .34 | .13 | .39 | .52 | .16 | .30 | 1.0 |
Values are n (%) unless otherwise noted. P values in bold indicate statistical significance (≤.05).
CRES, CAR T-cell–related encephalopathy syndrome; ICU, intensive care unit; NR, not reached; PD, progressive disease; SD, stable disease.
Compared with patients who did not receive BT, the cohort of patients who received ST had inferior PFS (Figure 2A; Table 5). The 1-year PFS rate was 44% for patients who did not receive BT, compared with 25% for the ST cohort (P = .01). Compared with the patients who did not receive BT, there was no difference in 1-year PFS for patients who received RT bridging (1-year PFS, 44%; P = .52) or CMT bridging (1-year PFS, 25%; P = .36). When comparing the PFS outcomes of the various bridging approaches, patients who received RT bridging had improved PFS (Figure 2A; Table 5). Median PFS for patients who received RT was 8.9 months (95% CI, 8.2-9.5 months), compared with 4.7 months (95% CI, 3.0-6.3 months) for the ST cohort (P = .05).

Survival outcomes in patients who underwent CAR T-cell therapy according to receipt of BT. Kaplan-Meier estimates of PFS (A) and OS (B) according to type of BT (no bridging, ST, RT, or CMT with RT concurrently with ST). The numbers of patients at risk in 5-month intervals are indicated.
Survival outcomes in patients who underwent CAR T-cell therapy according to receipt of BT. Kaplan-Meier estimates of PFS (A) and OS (B) according to type of BT (no bridging, ST, RT, or CMT with RT concurrently with ST). The numbers of patients at risk in 5-month intervals are indicated.
Among the 124 patients who received axi-cel, there were 43 deaths, 32 resulting from lymphoma and 11 from toxicity. Among patients who did not receive BT, there were 20 deaths, 16 secondary to progressive lymphoma and 4 resulting from toxicity. Among the 45 patients who received ST, there were 17 deaths resulting from lymphoma (n = 10) or toxicity (n = 7). There were 2 deaths in the 11-patient RT cohort, both resulting from lymphoma. Among the 6 patients who received CMT, there were 4 deaths, all secondary to lymphoma. There was no difference in 1-year OS between patients who did not receive BT (70%) compared with those who received ST (60%; P = .17) or RT (63%; P = .40; Figure 2B). However, patients treated with CMT had a poor outcome, with a 1-year OS rate of 25% and median OS of 3.9 months (95% CI, 0-8.7 months; Table 5; Figure 2B). These patients had statistically inferior OS compared with patients who did not receive BT (P = .03) and patients treated with RT (P = .02).
Influence of RT field size.
Nine patients were treated with a comprehensive RT field that encompassed all sites of lymphoma (CMT, n = 2; RT, n = 7), and 8 patients received focal RT fields that excluded active disease (CMT, n = 4; RT, n = 4; Figure 3). There was no significant difference in the proportion of patients who had LDH >2× ULN (P = .32), bulky disease (P = 1.0), advanced-stage disease at leukapheresis (P = .47), or ≥3 lines of prior therapy (P = .64) in the comprehensive vs focal RT groups; however, patients who received focal fields were more likely to have an IPI of ≥3 at leukapheresis (P < .01). There was no significant difference in median RT dose (RT, 35.2 Gy; CMT, 35.0 Gy; P = .85). Of the 8 patients treated focally, 6 progressed or relapsed; 3 of these relapses occurred in sites of active lymphoma at the time of axi-cel infusion not included in the RT field. Two such cases are illustrated in Figures 4 and 5; in both patients, the post–30-day PET-CT showed that all sites of disease (within and outside of the field) responded favorably to CAR T-cell therapy; however, subsequent imaging revealed disease progression in areas that harbored disease before CAR T-cell infusion but were not included in the RT field.
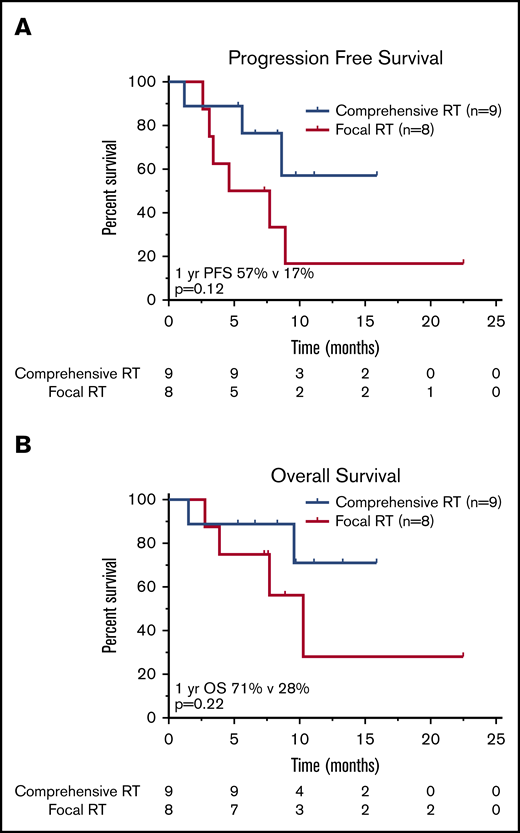
Survival outcomes in patients treated with RT BT according to RT field size. Kaplan-Meier estimates of PFS (A) and OS (B) in patients treated with bridging RT and focal RT fields as compared with patients treated with comprehensive RT encompassing all sites of known active lymphoma. The numbers of patients at risk in 5-month intervals are indicated.
Survival outcomes in patients treated with RT BT according to RT field size. Kaplan-Meier estimates of PFS (A) and OS (B) in patients treated with bridging RT and focal RT fields as compared with patients treated with comprehensive RT encompassing all sites of known active lymphoma. The numbers of patients at risk in 5-month intervals are indicated.

BT with a focal RT field in a CAR T-cell patient. Scout (A) and axial (D) images of a PET-CT scan in a male patient with primary refractory DLBCL who presented with cauda equina syndrome and a sacral mass. Emergent RT was administered with a 3-dimensional conformal RT plan that was transitioned to a volumetric-modulated arc therapy plan to a total dose of ∼43 Gy administered in 2.5-Gy fractions; the PET avid left gluteal mass (white arrow) was excluded from the RT field in an effort to limit bone marrow dose (E). The initial response assessment at day 30 revealed CR to therapy with a score of 2 on a 5-point scale (B,F). The 3-month post–axi-cel PET-CT scan revealed recurrent disease in the left gluteal region that was positive before axi-cel therapy but excluded from the RT field (C,G).
BT with a focal RT field in a CAR T-cell patient. Scout (A) and axial (D) images of a PET-CT scan in a male patient with primary refractory DLBCL who presented with cauda equina syndrome and a sacral mass. Emergent RT was administered with a 3-dimensional conformal RT plan that was transitioned to a volumetric-modulated arc therapy plan to a total dose of ∼43 Gy administered in 2.5-Gy fractions; the PET avid left gluteal mass (white arrow) was excluded from the RT field in an effort to limit bone marrow dose (E). The initial response assessment at day 30 revealed CR to therapy with a score of 2 on a 5-point scale (B,F). The 3-month post–axi-cel PET-CT scan revealed recurrent disease in the left gluteal region that was positive before axi-cel therapy but excluded from the RT field (C,G).
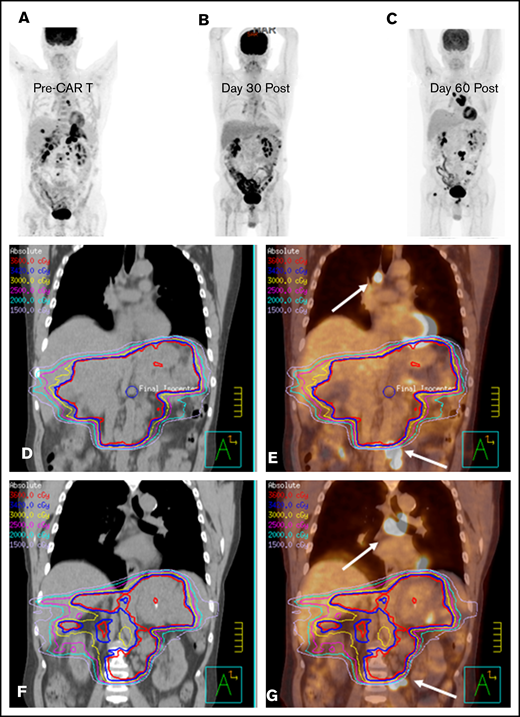
Bridging with a limited RT field in a CAR T-cell patient. (A) PET-CT scout image before CAR T-cell therapy in a male patient with primary refractory DLBCL. He presented 1 month after the illustrated PET-CT scan with severe abdominal pain, prompting CT imaging that revealed increased infiltrative soft tissue masses in the abdomen and pelvis (not shown). (D) Emergent RT was initiated with an intensity-modulated RT (IMRT) plan to the sites of symptomatic disease to an intended dose of 36 Gy; however, only 10.8 Gy was administered. (E) The IMRT plan fused to the sagittal pre–CAR T-cell PET-CT scan illustrates the sites of mediastinal and pelvic disease (arrows) that were excluded from the RT field. (B) The 30-day post–axi-cel PET-CT scan revealed PR to therapy, with a score of 4 on a 5-point scale. The 90-day post–CAR T-cell PET-CT scan (C) revealed new sites of disease progression outside of the RT field, as illustrated by the day-90 CT (F) and PET-CT (G) scans fused to the pre–CAR T-cell RT plan, with the arrows indicating the sites of disease progression outside of the RT field that were present before CAR T-cell therapy.
Bridging with a limited RT field in a CAR T-cell patient. (A) PET-CT scout image before CAR T-cell therapy in a male patient with primary refractory DLBCL. He presented 1 month after the illustrated PET-CT scan with severe abdominal pain, prompting CT imaging that revealed increased infiltrative soft tissue masses in the abdomen and pelvis (not shown). (D) Emergent RT was initiated with an intensity-modulated RT (IMRT) plan to the sites of symptomatic disease to an intended dose of 36 Gy; however, only 10.8 Gy was administered. (E) The IMRT plan fused to the sagittal pre–CAR T-cell PET-CT scan illustrates the sites of mediastinal and pelvic disease (arrows) that were excluded from the RT field. (B) The 30-day post–axi-cel PET-CT scan revealed PR to therapy, with a score of 4 on a 5-point scale. The 90-day post–CAR T-cell PET-CT scan (C) revealed new sites of disease progression outside of the RT field, as illustrated by the day-90 CT (F) and PET-CT (G) scans fused to the pre–CAR T-cell RT plan, with the arrows indicating the sites of disease progression outside of the RT field that were present before CAR T-cell therapy.
Toxicity.
There was no difference in grade ≥3 CRS or CAR T-cell–related encephalopathy syndrome/ICANS between any of the nonbridging or BT cohorts (Table 5). There were 4 deaths secondary to toxicity among patients who did not receive BT; all resulted from neurotoxicity. There were 7 deaths resulting from toxicity in the ST cohort but no deaths resulting from toxicity in the RT or CMT groups. Deaths resulting from toxicity in the ST cohort occurred at a median time of 1.1 months from axi-cel infusion (range, 0.5-2.4 months). Causes of death resulting from toxicity in the ST cohort included septic shock (n = 5), hemophagocytic lymphohistiocytosis (n = 1), and encephalopathy (n = 1). The 5 patients who died as a result of infectious complications all received cytotoxic chemotherapy bridging. The patient who died as a result of hemophagocytic lymphohistiocytosis was bridged with steroids. The patient who died as a result of encephalopathy received rituximab.
Discussion
We report the impact of various bridging strategies on the outcome of a large group of R/R LBCL patients who underwent leukapheresis for the intention of treatment with commercially available anti-CD19 CAR T-cell therapy at a single institution. Among all patients who underwent apheresis, those who received BT had inferior PFS and OS. Patients who received BT had unfavorable disease characteristics at leukapheresis, which likely affected physician decision to administer BT. Indeed, among the 16% of patients who did not receive axi-cel therapy after undergoing leukapheresis, most received BT, and median OS was very poor, with a majority dying as a result of disease in ∼1 month. Among the patients who received axi-cel infusion, BT was not associated with OS but may have negatively affected PFS, particularly among those who received ST bridging. Patients who received RT bridging had superior PFS vs those patients who were bridged with ST, despite comparable baseline characteristics.
Although patients in ZUMA-1 did not receive lymphoma directed–therapy between leukapheresis and axi-cel infusion,1 just over half of the patients in our entire cohort received BT. In the current study, among all patients for whom axi-cel therapy was intended, PFS and OS were inferior for those who received BT compared with those who did not. Patients who received BT were more likely to have adverse factors at leukapheresis, including worse PS, IPI score ≥3, bulky disease, and elevated LDH. Physician concern regarding patient ability to sustain the 3- to 4-week interval between leukapheresis and infusion seems to have been valid, given that axi-cel therapy was not administered to 21 of 24 patients because of rapid disease progression and declining PS. In this group of 24 patients, BT was administered to 80%, and median OS was very poor, suggesting BT was not able to overcome the rapid disease progression and death.
Among the patients who actually received axi-cel therapy, it is unclear if BT conferred worse outcome. In this group of patients, OS was not affected by BT, but there was a trend toward worse PFS (P = .06). Although responses among ZUMA-1 patients seemed to be independent of traditional adverse covariates such as age, IPI score, stage, and bulky disease, 21% of patients in our bridging cohort who received axi-cel therapy had a PS of 2 to 3 and would not have been eligible for ZUMA-1. Moreover, the patients who received BT had higher rates of bulky disease at leukapheresis (36%) compared with the nonbridged cohort (18%) and ZUMA-1 patients (17%), which reflects probable higher disease burden at axi-cel infusion. Pretreatment disease burden has been shown to affect CAR T-cell response, response durability, and survival among patients with R/R B-cell acute lymphoblastic leukemia.19,20 Among R/R LBCL patients in ZUMA-1, high tumor burden was associated with decreased durable response rates.21 Among 48 patients treated at Moffitt Cancer Center, high metabolic tumor volume was associated with decreased response and inferior PFS and OS.22 Therefore, BT is unlikely to affect disease burden or overcome poor risk factors. The implementation of risk stratification tools or more effective bridging strategies may be necessary to improve outcome.
Among the 3 bridging strategies used for patients who received axi-cel therapy, those who received ST had inferior PFS compared with patients who did not receive BT. Compared with those administered ST bridging, patients who received RT had improved PFS. In addition, there was an apparent increased CR rate among RT-bridged patients (82%) compared with those treated with ST (38%) and even compared with those who did not receive BT (48%). It could be argued that the efficacy differences between the RT and ST cohorts resulted from tumor burden, because patients referred for RT may have had less overall disease burden than those treated with ST or CMT. However, in the current study, at leukapheresis the proportion of patients with advanced disease, bulky disease, and LDH >2× ULN was not significantly different between the RT and ST bridging cohorts, suggesting similar disease burden levels.
Recognizing the retrospective nature of these analyses, physician decision regarding the use of ST may be presumed to have been guided by the presence of diffuse disease that would not be controlled by single-modality therapy. It is possible that patients in the RT cohort had disease that was limited to fewer nodal or extranodal regions compared with patients in the ST and CMT cohorts. Even if this is true, it is still important to highlight the efficacy of RT as a bridging strategy. All patients who underwent leukapheresis and received RT bridging ultimately were administered axi-cel infusion, compared with 74% and 67% of patients who received ST and CMT bridging, respectively. This suggests that RT may be a superior strategy to bridge patients to axi-cel in our single-center experience.
Although there were no significant differences in severe CRS or ICANS between the ST- and RT-bridged patients, there were no deaths resulting from toxicity in the RT cohort. The deaths resulting from toxicity in the ST cohort were largely due to infectious complications, with 5 of 7 deaths resulting from sepsis occurring in patients who received chemotherapy. Given that the ST cohort was more heavily pretreated and had less bone marrow reserve, it is possible that chemotherapy affected immune function recovery, resulting in increased susceptibility to lethal infection. If this hypothesis were true, we may have expected to see deaths resulting from toxicity in the CMT cohort; however, the number of patients in this group was small, hindering additional conclusions. However, consideration of the potential risk of infection when considering BT is warranted based on our findings.
The optimal field size for RT bridging is uncertain. It is intriguing that there may be an efficacy advantage to irradiating all disease sites. In patients in whom comprehensive RT can be administered, reducing disease burden before CAR T-cell infusion may result in higher response rates and durability. However, there is concern that in the absence of active CD19+ lymphoma, CAR T-cell expansion may be hampered, compromising therapy efficacy. However, in the JULIET study, which led to tisagenlecleucel approval, 7 patients who received systemic BT and were restaged before infusion had CR to BT but went on to receive CAR T cells. The tisagenlecleucel product expanded rapidly among all 7 patients and remained detectable for up to 2 years. All patients sustained CR at 3 months, with 5 of 7 patients remaining progression free >1 year.23 Additional investigation is required to determine if axi-cel therapy remains effective among patients without PET-CT–detectable disease after BT.
In an initial description of bridging RT among 11 patients who received axi-cel therapy, palliative hypofractionated regimens of 30 Gy in 3-Gy fractions and 20 Gy in 4-Gy fractions were used for most patients; roughly 80% of patients achieved local control within the RT field.6 In the current study, median dose was 35 Gy, with a smaller median fraction size of 2.5 Gy, without an apparent impact of dose on PFS. For DLBCL patients treated with salvage RT, doses >40 Gy may improve local control.7 For patients who receive RT as BT before CAR T-cell treatment, however, the optimal RT dose and fractionation remain unclear. Many factors can influence decisions regarding RT dose and fractionation, including the amount of time expected for bridging treatment before the arrival of the CAR T-cell product, the size of the RT field, and the proximity to surrounding normal tissues.
This study has several limitations beyond the retrospective design. BT was initiated at physician discretion, resulting in imbalances in characteristics between cohorts. Although we performed comparisons between the ST, RT, and CMT groups for disease-related factors, patients who received RT alone may have had less diffuse disease. Importantly, although half of the patients received BT, only a limited fraction of the bridging cohort received RT alone (18%) or CMT (9%). The observation that there may be a benefit to irradiating all sites of disease comprehensively is only hypothesis generating, because there were small patient numbers within this analysis. Moreover, we do not know whether there are differences in T-cell fitness, CAR T-cell phenotype, or tumor biology between patients who received bridging vs no bridging or between patients treated with ST or CMT vs RT bridging.
In conclusion, these data demonstrate that concern for disease-related mortality in the period between apheresis and CAR T-cell infusion is justified, because patients who do not go on to receive axi-cel therapy in this cohort of R/R patients treated at a single institution had an abysmal outcome. It is unclear if ST administered with or without RT confers an adverse outcome. These data provide evidence of the safety and efficacy of single-modality RT as a bridging strategy for R/R LBCL patients treated with axi-cel therapy. Comprehensive RT to all sites of active lymphoma seemed to result in a superior disease outcome after CAR T-cell therapy. Prospective studies are warranted to explore strategies to improve patient selection and management strategies leading up to CAR T-cell infusion.
Send data sharing requests via e-mail to the corresponding author, Chelsea C. Pinnix (ccpinnix@mdanderson.org).
Acknowledgments
This work was supported in part by National Institutes of Health, National Cancer Institute, Cancer Center Support (CORE) grant CA 016672 to the University of Texas MD Anderson Cancer Center. No other funding was received for design, completion, or analysis of this study.
Authorship
Contribution: C.C.P. and L.J.N. designed the research, collected the data, analyzed the data, and wrote the paper; J.R.G., B.S.D., and P.F. designed the research and wrote the paper; P.S., M.C.H., and S. Adkins collected the data and wrote the paper; J.W., S. Ahmed, L.F., H.J.L., R.N., R.E.S., S.P.I., M.A.R., M.W., and C.F. wrote the paper; and S.S.N. designed the research, collected the data, and wrote the paper.
Conflict-of-interest disclosure: S.S.N. has received research support from Kite/Gilead, Cellectis, Poseida, Merck, Acerta, Karus, Bristol-Myers Squibb, Unum Therapeutics, Allogene, and Precision Biosciences; has served as a consultant and advisory board member for Kite/Gilead, Bristol-Myers Squibb, Celgene, Novartis, Unum Therapeutics, Pfizer, Merck, Precision Biosciences, Cell Medica, Incyte, Allogene, Calibr, and Legend Biotech; and has patents related to cell therapy. M.W. has received research support from Kite/Gilead and has served as a consultant for Kite/Gilead. The remaining authors declare no competing financial interests.
Correspondence: Chelsea C. Pinnix, Department of Radiation Oncology, Unit 97, The University of Texas MD Anderson Cancer Center, 1515 Holcombe Blvd, Houston, TX 77030; e-mail: ccpinnix@mdanderson.org.

