

Key Points
TLR signals in WM B cells fail to drive plasma cell differentiation while CD40L-mediated differentiation is intact.
Functional TLR uncoupling provides an explanation for the balance between B-cell and plasma cell disease components.

Abstract
Waldenström macroglobulinemia (WM) is a rare malignancy in which clonal B cells infiltrate the bone marrow and give rise to a smaller compartment of neoplastic plasma cells that secrete monoclonal immunoglobulin M paraprotein. Recent studies into underlying mutations in WM have enabled a much greater insight into the pathogenesis of this lymphoma. However, there is considerably less characterization of the way in which WM B cells differentiate and how they respond to immune stimuli. In this study, we assess WM B-cell differentiation using an established in vitro model system. Using T-cell–dependent conditions, we obtained CD138+ plasma cells from WM samples with a frequency similar to experiments performed with B cells from normal donors. Unexpectedly, a proportion of the WM B cells failed to upregulate CD38, a surface marker that is normally associated with plasmablast transition and maintained as the cells proceed with differentiation. In normal B cells, concomitant Toll-like receptor 7 (TLR7) activation and B-cell receptor cross-linking drives proliferation, followed by differentiation at similar efficiency to CD40-mediated stimulation. In contrast, we found that, upon stimulation with TLR7 agonist R848, WM B cells failed to execute the appropriate changes in transcriptional regulators, identifying an uncoupling of TLR signaling from the plasma cell differentiation program. Provision of CD40L was sufficient to overcome this defect. Thus, the limited clonotypic WM plasma cell differentiation observed in vivo may result from a strict requirement for integrated activation.
Introduction
Dysregulation of B-cell signaling can result in a multitude of lymphoproliferative diseases that can affect each stage of differentiation. Waldenström macroglobulinemia (WM) is a rare lymphoplasmacytic lymphoma that is characterized by the infiltration and accumulation of clonal B lymphocytes in the bone marrow that give rise to a small number of neoplastic plasma cells (PCs) that are likely to be the main source of secreted immunoglobulin M (IgM) paraprotein.1-3 WM represents a challenging neoplasm to model in vitro because the B-cell and PC compartments are affected. An understanding of both is required to inform potential treatments, because current regimens only target the B-cell stage.
Investigation into the pathogenesis of WM identified the recurrent somatic MYD88L265P as the most prevalent mutation in WM, present in >90% of patients.4 MYD88 is an adaptor protein for all Toll-like receptors (TLRs), with the exception of TLR3.5 Ligation of TLRs induces receptor dimerization, facilitating MYD88 recruitment. Subsequently, MYD88 undergoes oligomerization and forms a complex with the serine/threonine kinases IRAK4 and IRAK1. Activation of this pathway results in the nuclear translocation of nuclear factor-κB (NF-κB) and gene expression linked to cell survival.6,7
A key part of this signaling cascade is the formation of the myddosome complex.8,9 The L265P mutation increases the propensity of MYD88 to form spontaneous myddosomes without the requirement of TLR signaling.8,10 However, murine B cells that acutely express MYD88L265P require the presence of TLR9 to trigger spontaneous proliferation,11 and human ABC-DLBCL lines harboring combined MYD88L265P/CD79B mutations are also dependent on TLR9.12 Thus, whether MYD88L265P can function independently of the upstream context remains an open question.
Here, we report the first detailed investigation of the differentiation of primary WM B cells in vitro. We examine the response of WM cells expressing MYD88L265P to multiple stimuli that generate PCs, including TLR engagement, and uncover an unanticipated effect on differentiation.
Methods
Clinical samples
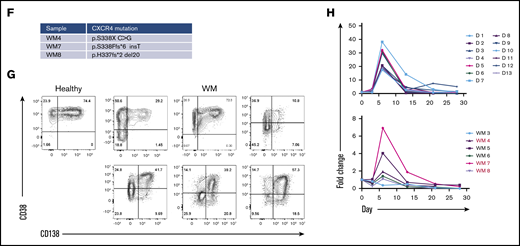
Peripheral blood was obtained from healthy donors with informed consent. Patient bone marrow aspirates and peripheral blood from 14 WM patients, 6 splenic marginal zone lymphoma (SMZL) patients, 1 chronic lymphocytic leukemia patient, and 1 mantle cell lymphoma patient fulfilling World Health Organization diagnostic criteria were included in this analysis. CXCR4 mutations were confirmed by Sanger sequencing. All of the samples were obtained at initial presentation. Approval for the study was granted by the Leeds (East) NHS Research Ethics Committee.
In vitro generation of PCs
B cells were isolated by negative selection with a Memory B Cell Isolation Kit (Miltenyi Biotec) or were positively selected with CD20 MicroBeads and cultured in Iscove modified Dulbecco medium + 10% fetal bovine serum (Invitrogen) with the addition of human interleukin-2 (20 U/mL), human interleukin-21 (50 ng/mL), and F(ab′)2 goat anti-human IgM and IgG (10 μg/mL). B cells were stimulated with the TLR7/8 agonist R848 (InvivoGen) or γ-irradiated CD40L-expressing L cells (supplemental Figure 1). Subsequent culture followed the protocol detailed by Cocco et al.13 Cells were quantified by flow cytometry using CountBright Beads (Thermo Fisher Scientific).
Flow cytometry
The antibodies used for cell surface staining included CD20 (130-091-104), CD27-FITC (M-T271) (BD Biosciences), CD19-PE (LT19; Miltenyi Biotec), CD20-Pacific Blue (2H7; eBioscience), CD38-APC-Cy7 (HB-7; BD Biosciences), CD138-APC (44F9; Miltenyi Biotec), and 7-AAD-PerCP-Cy5 (BD Biosciences). Flow cytometry was performed using a BD LSR II 3 Laser (BD Biosciences) or a CytoFLEX S (Beckman Coulter). Analysis was performed using FACSDiva Software v8.0.0 (BD Biosciences) or FlowJo v10 (TreeStar).
SPADE analysis
viSNE (Visualization of t-distributed Stochastic Neighbor Embedding) maps were generated using proportional sampling of concatenated data in Cytobank (https://www.cytobank.org). Analysis was performed using the default t-distributed Stochastic Neighbor Embedding parameters but with perplexity = 50 and 5000 iterations. Clustering analysis was performed with SPADE (Spanning-tree Progression Analysis of Density-normalized Events) using default analysis parameters. Clusters of nodes were labeled manually according to the phenotype.
RNA sequencing
Sequencing libraries were generated using a TruSeq Stranded Total RNA Library Prep Human/Mouse/Rat kit and sequenced on a NextSeq 500 System (both from Illumina) using 76-bp single-end sequencing. The fastq files were trimmed using TrimGalore v0.6.0 and aligned to GRCh38.p12 (GENCODE, release 28) with STAR aligner (v2.6.0c).14 Transcript abundance was estimated using RSEM v1.3.0 and processed using DESeq2 v1.22.2.15-18 Significantly differentially expressed genes (1.4 fold-change, false discovery rate <0.05) were analyzed by the Database for Annotation, Visualization and Integrated Discovery functional annotation tool (Laboratory of Human Retrovirology and Immunoinformatics). RNA-sequencing (RNA-seq) data were aligned to the immunoglobulin heavy chain reference library using MIXCR v3.0.9,19 and clones were defined by the presence of a unique CDR3 sequence. Resulting output was analyzed using R version 3.5.1 and visualized using ggplot2.20
Results
In vitro differentiation of WM B cells
The response of B cells can generally be divided into 2 categories: those that require T-cell help (T-dependent [TD] responses) and those that do not (T-independent [TI] responses). Therefore, we initially sought to characterize the response of WM B cells to TD stimuli because the response of healthy cells in this system has already been established.
In our model, WM total B cells were stimulated in a manner that mimics TD activation by coculture with CD40L-expressing fibroblasts and cross-linking the B-cell receptor (BCR) with F(ab′)2 anti-IgG/IgM. Throughout the culture, the immunophenotype of the cells was determined at time points corresponding to the different recognized stages of B-cell differentiation. Under these conditions, WM cells had acquired a plasmablast-like phenotype by day 6, having downregulated the expression of CD20 and upregulated the plasmablast marker CD38 (Figure 1A). Examination of RNA-seq confirmed the clonal nature of the cells generated from WM samples (Figure 1B), as well as the presence of the MYD88L265P mutation (Figure 1C).
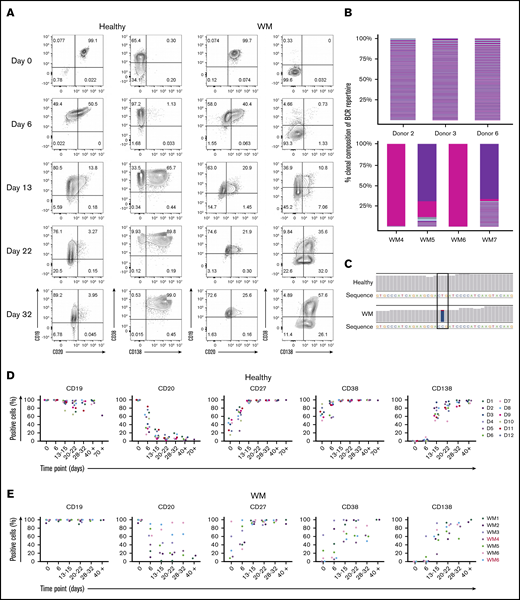
WM B cells generate PCs in vitro following culture with TD stimuli. (A) Representative flow cytometric plots depicting phenotypic characterization of differentiating B cells derived from the peripheral blood of healthy donors (left panels) or WM patients (right panels) stimulated with CD40L and F(ab′)2 anti-IgG/IgM. The day of culture is indicated on the left. (B) The proportion of the IgH repertoire occupied by each clone was plotted for healthy donor (upper panel) or WM (lower panel) samples stimulated with CD40L and F(ab′)2 anti-IgG/IgM, with each unique clone represented by a colored band. The top 250 clones are shown. (C) Reads from RNA-seq from representative day-6 samples taken from healthy donors and WM differentiations, highlighting the L265P somatic variant (T>C). (D) Phenotypic profiles for B cells derived from the peripheral blood of healthy donors (D1-D12). Each scatter plot displays the percentage of live cells expressing the stated CD marker, as determined at each time point via flow cytometry. Data from comparable intervals were grouped together for clarity. Each independent differentiation is represented by a different color. (E) Phenotypic profiles for B cells derived from the bone marrow of WM patients stimulated with CD40L and F(ab′)2 anti-IgG/IgM. Each independent differentiation is represented by a different color, and samples with CXCR4 mutations are shown in red (WM4 and WM7). (F) CXCR4 mutations detected among WM samples. (G) Representative plots of CD38 and CD138 expression on day-13 cells from 1 healthy donor and 6 WM samples. (H) The fold change in cell number from healthy donors (upper panel) and WM samples (lower panel) at each time point was determined by manual counts between day 0 and day 6 and by flow cytometry thereafter. The cell number at each point was normalized to the number of “input” cells for that specific donor obtained at day 0. Samples with CXCR4 mutations are indicated by red font.
WM B cells generate PCs in vitro following culture with TD stimuli. (A) Representative flow cytometric plots depicting phenotypic characterization of differentiating B cells derived from the peripheral blood of healthy donors (left panels) or WM patients (right panels) stimulated with CD40L and F(ab′)2 anti-IgG/IgM. The day of culture is indicated on the left. (B) The proportion of the IgH repertoire occupied by each clone was plotted for healthy donor (upper panel) or WM (lower panel) samples stimulated with CD40L and F(ab′)2 anti-IgG/IgM, with each unique clone represented by a colored band. The top 250 clones are shown. (C) Reads from RNA-seq from representative day-6 samples taken from healthy donors and WM differentiations, highlighting the L265P somatic variant (T>C). (D) Phenotypic profiles for B cells derived from the peripheral blood of healthy donors (D1-D12). Each scatter plot displays the percentage of live cells expressing the stated CD marker, as determined at each time point via flow cytometry. Data from comparable intervals were grouped together for clarity. Each independent differentiation is represented by a different color. (E) Phenotypic profiles for B cells derived from the bone marrow of WM patients stimulated with CD40L and F(ab′)2 anti-IgG/IgM. Each independent differentiation is represented by a different color, and samples with CXCR4 mutations are shown in red (WM4 and WM7). (F) CXCR4 mutations detected among WM samples. (G) Representative plots of CD38 and CD138 expression on day-13 cells from 1 healthy donor and 6 WM samples. (H) The fold change in cell number from healthy donors (upper panel) and WM samples (lower panel) at each time point was determined by manual counts between day 0 and day 6 and by flow cytometry thereafter. The cell number at each point was normalized to the number of “input” cells for that specific donor obtained at day 0. Samples with CXCR4 mutations are indicated by red font.
We successfully produced a population of WM PCs by day 13, at which time a high proportion of cells had acquired CD38 and CD138. These were mature PCs; once generated, they could be maintained until elective termination. The pattern of cell surface marker expression changes was largely consistent between samples from different patients and were not impacted by CXCR4 mutation status, although there was a trend toward a lower percentage of CD38 expressing cells in WM samples with mutated CXCR4 (Figure 1D-F).
Although differentiation occurred in a similar manner in healthy and WM B cells, there was a greater degree of heterogeneity among patient samples. Most WM B cells stimulated in a TD manner acquired surface markers that were characteristic of PCs by day 13; however, it appears that a proportion of the cells go through an alternate plasmablast-like phenotype (Figure 1G). These cells express CD138 but do so without prior upregulation of CD38, the characteristic plasmablast marker. This population was observed to persist for several weeks.
Once B cells have become activated, they proliferate rapidly and give rise to effector cells. At the end of this response, many of these cells die, but a small number of long-lived PCs persist. The in vitro system replicates these dynamics for healthy and WM cells. The expansion in the number of B cells derived from healthy donors can be as much as 40-fold, whereas the increase in WM cells is less profound (Figure 1H). There is also a reduction in the overall output of PCs normalized to the input cell number compared with healthy cells (day 21: healthy, 1.38 ± 2.03 vs WM, 0.24 ± 0.2; day 28: 1.18 ± 1.42 vs 0.21 ± 0.18, respectively). Despite differences in the amplitude, WM cells exhibit a similar response to that of healthy cells.
A TLR7 agonist inhibits the proliferation and survival of WM B cells
The above results confirm that WM B cells can successfully generate PCs using an in vitro system that mimics the response to a TD antigen. In this scenario, the presence of the MYD88L265P mutation appears to have minimal influence on the production of antibody-secreting cells. However, PCs are also generated in the context of TI responses, involving receipt of costimulatory signals from other sources, including TLR activation by pathogen-associated molecular patterns (PAMPs).21
TLR stimulation induces a signaling cascade through MYD88, which ultimately results in the translocation of NF-κB to the nucleus and expression of genes required for survival and proliferation. Previous studies have suggested that B cells harboring the MYD88L265P mutation require continued TLR activity to maintain proliferation,11,12,22 but it remains unknown whether WM cells behave differently when exposed to PAMPs that drive PC production.
Therefore, we investigated whether activating WM B cells in a TI manner, through ligation of TLR7 with its synthetic ligand R848, would enhance the proliferation or survival of these cells. Initial experiments performed on healthy donors determined that, although stimulation of B cells with R848 alone was sufficient to promote PC differentiation, the process lagged behind the TD version and resulted in a persistent B-cell population (supplemental Figure 1). In some instances, exposure to antigen and PAMPs occurs simultaneously, which can enhance antibody responses.23,24 Therefore, healthy control cells were also stimulated with R848 combined with F(ab′)2 anti-IgG/IgM. Cells treated with this combination exhibited a profile that was similar to the TD conditions (Figure 2A-B). Unexpectedly, stimulation of WM cells with R848+anti-BCR led to an abrupt decline in cell numbers, resulting in virtually no viable cells by day 14, regardless of CXCR4 mutation status (Figure 2B). This is in contrast to the response shown by healthy cells to R848. Furthermore, WM cells do not follow the usual pattern of phenotypic differentiation when stimulated with R848. A large proportion of cells retain a less mature phenotype (Figure 2C), whereas in healthy controls, activation with R848 promotes the acquisition of CD138 as efficiently as CD40L.

WM B cells fail to differentiate in response to the TLR7 agonist R848. (A) B cells derived from the peripheral blood of healthy donors were stimulated with 1 μg/mL R848 and F(ab′)2 anti-IgG/IgM. Each scatter plot displays the percentage of live cells expressing the stated CD marker, as determined at each time point via flow cytometry. Data from comparable intervals were grouped together for clarity. Each independent differentiation is represented by a different color. (B) The fold change in cell number from healthy donors (left panel) and WM samples (right panel) at each time point was determined by manual counts between day 0 and day 6 and by flow cytometry thereafter. The cell number at each point was normalized to the number of “input” cells for that specific donor obtained at day 0. WM samples with CXCR4 mutations are shown in red (WM7 and WM8). (C) B cells derived from the bone marrow of patients diagnosed with WM were stimulated with 1 μg/mL R848 and F(ab′)2 anti-IgG/IgM and profiled for markers as in panel A.
WM B cells fail to differentiate in response to the TLR7 agonist R848. (A) B cells derived from the peripheral blood of healthy donors were stimulated with 1 μg/mL R848 and F(ab′)2 anti-IgG/IgM. Each scatter plot displays the percentage of live cells expressing the stated CD marker, as determined at each time point via flow cytometry. Data from comparable intervals were grouped together for clarity. Each independent differentiation is represented by a different color. (B) The fold change in cell number from healthy donors (left panel) and WM samples (right panel) at each time point was determined by manual counts between day 0 and day 6 and by flow cytometry thereafter. The cell number at each point was normalized to the number of “input” cells for that specific donor obtained at day 0. WM samples with CXCR4 mutations are shown in red (WM7 and WM8). (C) B cells derived from the bone marrow of patients diagnosed with WM were stimulated with 1 μg/mL R848 and F(ab′)2 anti-IgG/IgM and profiled for markers as in panel A.
Previous studies have demonstrated that interactions among TLRs, CD40L, and the BCR affect the ability of B cells to class switch and undergo differentiation.25,26 Therefore, the effect of combining CD40L and R848 stimulation was assessed. B cells from 2 donors were stimulated concurrently with CD40L+anti-BCR (CD40L), R848+anti-BCR (R848), or a combination of CD40L and R848+anti-BCR (CD40L+R848). B cells proliferated better following stimulation with CD40L compared with R848 (Figure 3A), and cells that received CD40L+R848 proliferated to a similar extent as their counterparts that received CD40L stimulation. The difference in cell number between CD40L alone and CD40L+R848 was minimal.
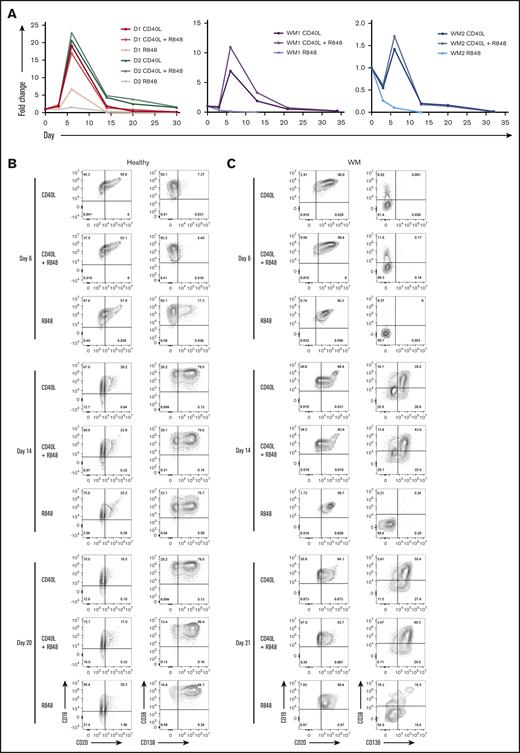
Combinatorial activation of WM B cells by TLR7 agonist, BCR triggering, and T-cell help generates PCs. (A) B cells derived from the peripheral blood of 2 healthy donors (left panel) or 2 WM patients (middle and right panels) were stimulated with CD40L+anti-BCR (CD40L), CD40L+R848+anti-BCR (CD40L+R848), or R848+anti-BCR (R848). The fold change in cell number at each time point was determined by manual counts for day 3 and day 6 and then by flow cytometry thereafter. The cell number at each point was normalized to the number of “input” cells for that specific patient obtained at day 0. The immunophenotype of cells from a representative healthy (B) or WM (C) sample, stimulated as in panel A, was assayed by flow cytometry at each time point. Percentages are displayed for each quadrant.
Combinatorial activation of WM B cells by TLR7 agonist, BCR triggering, and T-cell help generates PCs. (A) B cells derived from the peripheral blood of 2 healthy donors (left panel) or 2 WM patients (middle and right panels) were stimulated with CD40L+anti-BCR (CD40L), CD40L+R848+anti-BCR (CD40L+R848), or R848+anti-BCR (R848). The fold change in cell number at each time point was determined by manual counts for day 3 and day 6 and then by flow cytometry thereafter. The cell number at each point was normalized to the number of “input” cells for that specific patient obtained at day 0. The immunophenotype of cells from a representative healthy (B) or WM (C) sample, stimulated as in panel A, was assayed by flow cytometry at each time point. Percentages are displayed for each quadrant.
The response of WM B cells was then examined to investigate whether the failure to proliferate and differentiate following R848 stimulation could be ameliorated by costimulation with CD40L+R848.
Between days 0 and 3, cell numbers were maintained within cultures that received CD40L stimuli, but cells that were stimulated with R848 alone had decreased considerably in number (Figure 3A). The decline continued for the R848-stimulated cells until there were very few cells left from day 13 onward. In contrast, cells under CD40L-stimulated conditions proliferated between days 3 and 6; WM cells stimulated with a combination of CD40L+R848 proliferated to a greater extent than did those that received only CD40L. The numbers of cells from the CD40L+R848-stimulated condition remained higher than those stimulated with CD40L alone until day 20 of the differentiation, after which the 2 conditions had very similar numbers of cells.
The phenotype of the cells in each condition is displayed in Figure 3B-C. At day 6, the phenotype of the dual-stimulated cells was virtually indistinguishable from those that received CD40L. The cells stimulated with CD40L+R848 continued to have almost the same phenotype as the CD40L-only group throughout the rest of the differentiation. In contrast, the R848-stimulated WM cells failed to differentiate.
Differentiation profiles from non-WM LPDs
To determine whether the features of in vitro WM differentiation were unique, we investigated the profile of B cells from other lymphoproliferative disorders (LPDs), notably SMZL cells. The capacity to differentiate into PCs appears to be conserved in a proportion of SMZL cases (21-74%).27-30 Similar to WM, dysregulation of NF-κB signaling also plays a key role in SMZL pathogenesis,31-33 although the frequency of MYD88L265P mutation is low.34-36
B cells were isolated and stimulated as described previously. A summary of the input samples is provided, accompanied by the capacity of B cells from each sample to generate plasmablasts or PCs in vitro (supplemental Table 1). All samples were negative for the MYD88L265P mutation, as determined by allele-specific oligonucleotide polymerase chain reaction.
The expression of each marker, with the exception of CD19, was highly variable between the samples, as was the extent to which they were able to differentiate when stimulated with CD40L+anti-BCR (Figure 4A). Like WM, these cells also responded poorly to a TI stimulus. Only 1 of the samples (patient 6) was able to generate PCs (Figure 4B). This is in contrast to the phenotypes obtained when the cells were stimulated with CD40L: all but 1 sample exhibited some ability to generate PCs. No evidence of a CD38−CD138+ population akin to that of the WM samples was observed, indicating that the phenotype may be restricted to WM cells.
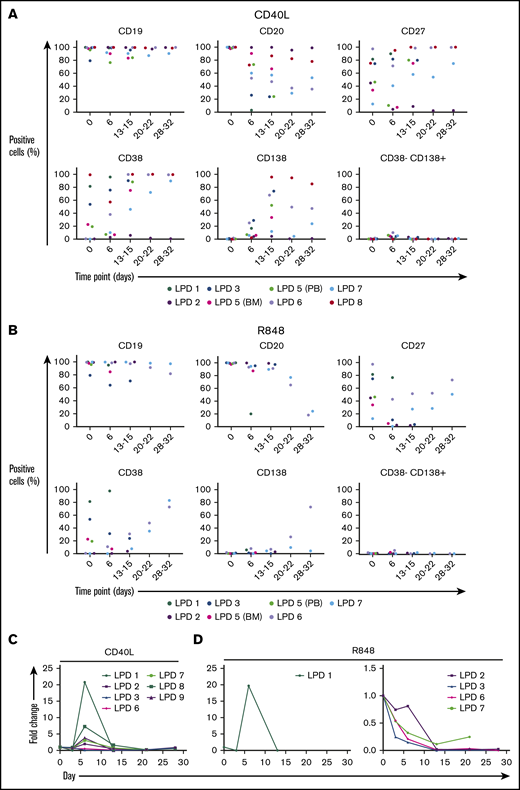
B cells from other LPDs display variable PC differentiation in vitro. B cells derived from the bone marrow (BM), peripheral blood (PB), or spleen of patients with various LPDs were stimulated with CD40L and F(ab′)2 anti-IgG/IgM (A) or 1 μg/mL R848 and F(ab′)2 anti-IgG/IgM (B). Each scatter plot displays the percentage of live cells expressing the stated CD marker, as determined at each time point via flow cytometry. Data from comparable intervals were grouped together. Each independent differentiation is represented by a different color. (C) The fold change in cell number at each time point was determined by manual counts for day 3 and day 6 and by flow cytometry thereafter. The cell number at each point was normalized to the number of “input” cells for that specific patient obtained at day 0.
B cells from other LPDs display variable PC differentiation in vitro. B cells derived from the bone marrow (BM), peripheral blood (PB), or spleen of patients with various LPDs were stimulated with CD40L and F(ab′)2 anti-IgG/IgM (A) or 1 μg/mL R848 and F(ab′)2 anti-IgG/IgM (B). Each scatter plot displays the percentage of live cells expressing the stated CD marker, as determined at each time point via flow cytometry. Data from comparable intervals were grouped together. Each independent differentiation is represented by a different color. (C) The fold change in cell number at each time point was determined by manual counts for day 3 and day 6 and by flow cytometry thereafter. The cell number at each point was normalized to the number of “input” cells for that specific patient obtained at day 0.
LPD samples, with the exception of patient 1, displayed a weaker proliferative response to stimulation with R848+anti-BCR in comparison with that observed following CD40L+anti-BCR (Figure 4C). In addition, samples capable of generating PCs following activation with CD40L were, in general, less able to do so subsequent to TLR7 stimulation. The variable capacity for PC differentiation among these samples in vitro is in line with the spectrum of differentiation observed in vivo. Despite the fact that the profiles initially appeared similar between WM and the other LPDs, direct comparison of the proliferation of these samples reveals that the divergent response of WM B cells to these stimuli is more extreme.
Determination of cellular hierarchy using SPADE
viSNE was used to identify populations that become apparent when multiple data sets are analyzed simultaneously and explore differences among differentiations with WM-derived cells, LPD cells, and healthy cells. The relationships between the populations of cells generated in each group were examined using SPADE plots generated from the initial viSNE results.
Figure 5A depicts SPADE plots constructed from WM concatenated flow data at day 13 of differentiation, with the intensity of expression of CD38 and CD138 indicated. The equivalent plots of concatenated healthy cells at this time point are shown on the left for comparison. In the upper healthy SPADE tree, all nodes are orange or red, denoting high levels of CD38 in all cells; the lower tree illustrates the separation of plasmablasts and PCs by CD138 expression. However, in the CD38 WM tree, a distinct collection of green nodes can be seen. These CD38-low cells have a comparable level of CD138 expression as the WM cells that fall within the “classic” PC group and, thus, are the atypical CD38−CD138+ fraction. The most closely related healthy cells lie further up the branch located within the plasmablast group, suggesting that the CD38−CD138+ cells are more similar to healthy plasmablasts than to PCs.
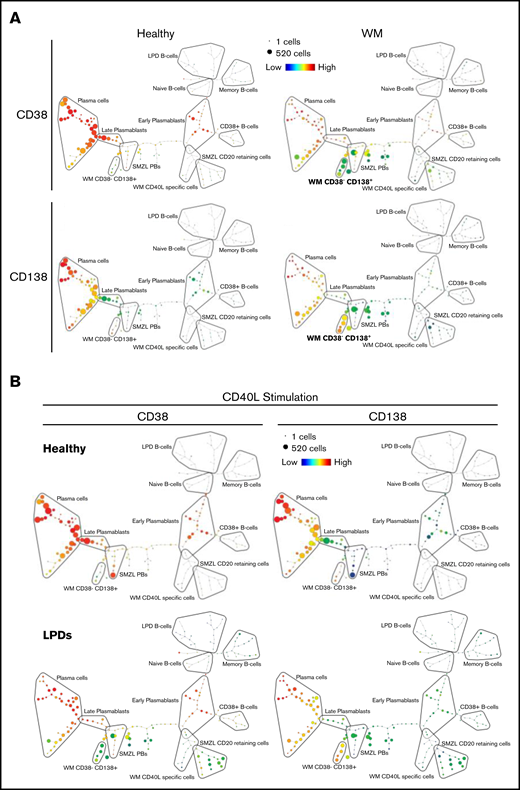
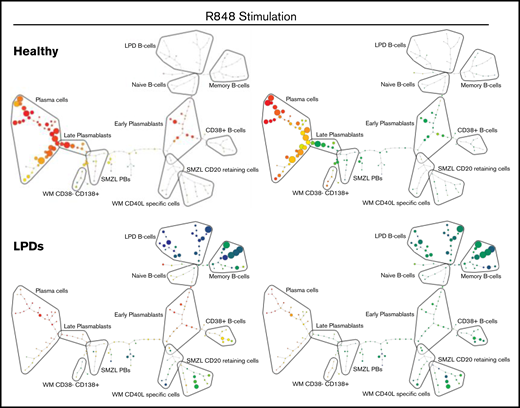
SPADE plots depicting population relationships during in vitro differentiation. (A) Plots showing related phenotypes in healthy and WM samples based on CD38 and CD138 expression among day-13 cells that had been stimulated with CD40L and F(ab′)2 anti-IgG/IgM at day 0. Each node is colored according to the median intensity of the indicated marker and is proportional in size to the number of cells with that marker intensity. (B) Visualization of the branched interconnectivity of healthy day-13 cells vs all LPDs, including WM, in response to CD40L or R848 stimulation based on CD38 or CD138 expression.
SPADE plots depicting population relationships during in vitro differentiation. (A) Plots showing related phenotypes in healthy and WM samples based on CD38 and CD138 expression among day-13 cells that had been stimulated with CD40L and F(ab′)2 anti-IgG/IgM at day 0. Each node is colored according to the median intensity of the indicated marker and is proportional in size to the number of cells with that marker intensity. (B) Visualization of the branched interconnectivity of healthy day-13 cells vs all LPDs, including WM, in response to CD40L or R848 stimulation based on CD38 or CD138 expression.
The similarity in the phenotypes of healthy cells stimulated with CD40L or R848 is demonstrated in supplemental Figure 2. However, SPADE highlights the fact that the greatest divergence between samples occurs at day 6 of the differentiation. Although differences are observed in the healthy group at day 6 of the differentiation, the final results following either stimulation are almost identical from day 13 onward. The responses of all of the LPD samples to the 2 types of stimulation at day 13 of the differentiation in comparison with healthy cells are summarized in Figure 5B. The overlap between the healthy cells with either stimulation is extensive, in contrast to the LPDs. The profound inability of WM cells to respond correctly to TLR7 stimulation predominates in the R848 plots, with the LPD plasmablasts generated earlier in the time course unable to survive to this time point.
R848-stimulated WM cells fail to mount an effective PC gene expression program
To provide insight into the distinct WM responses to PC-inducing stimuli, RNA-seq was performed on material harvested from cells at day 6 of culture within the in vitro system, because this time point showed the greatest degree of difference in the SPADE analysis. The samples consisted of 3 healthy controls with matched samples for CD40L and R848 stimulation and a total of 6 WM samples (Figure 6A).
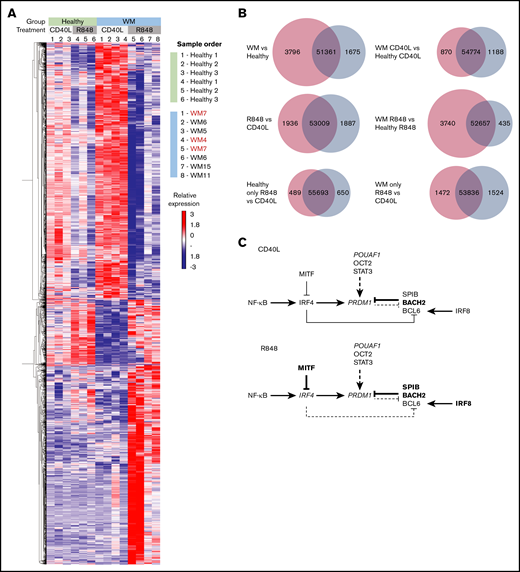
WM cells exhibit a block in the PC gene-expression program. (A) Hierarchically clustered heat map of differentially expressed genes between healthy and WM samples in day-6 in vitro–generated cells from R848 or CD40L conditions. The threshold for significance was a false discovery rate <0.05. WM samples with CXCR4 mutations are indicated in red (WM4 and WM7). (B) Venn diagrams depicting the significantly differentially expressed genes for each stated comparison. The number of upregulated genes is displayed in red, the number of downregulated genes is displayed in blue, and the number of nonsignificant genes is shown in the center. (C) The interaction between key genes involved in PC differentiation is depicted for cells stimulated with CD40L (upper panel) or R848 (lower panel). Genes that are upregulated in WM samples compared with healthy samples are in larger and bold type, whereas those that are downregulated are shown in smaller and italicized type.
WM cells exhibit a block in the PC gene-expression program. (A) Hierarchically clustered heat map of differentially expressed genes between healthy and WM samples in day-6 in vitro–generated cells from R848 or CD40L conditions. The threshold for significance was a false discovery rate <0.05. WM samples with CXCR4 mutations are indicated in red (WM4 and WM7). (B) Venn diagrams depicting the significantly differentially expressed genes for each stated comparison. The number of upregulated genes is displayed in red, the number of downregulated genes is displayed in blue, and the number of nonsignificant genes is shown in the center. (C) The interaction between key genes involved in PC differentiation is depicted for cells stimulated with CD40L (upper panel) or R848 (lower panel). Genes that are upregulated in WM samples compared with healthy samples are in larger and bold type, whereas those that are downregulated are shown in smaller and italicized type.
The numbers of significantly up- or downregulated genes between healthy and WM samples and between the different activation stimuli are displayed in Figure 6B. The greatest difference in gene expression occurs between WM and healthy samples, with WM samples demonstrating a considerably greater proportion of upregulated genes. As might be anticipated from the characterization of the differentiation responses, the number of differentially expressed genes between WM and healthy cells following CD40L stimulation is smaller than that for R848 stimulation.
One of the most important questions to address was whether WM cells are able to successfully integrate TLR7 signals to initiate B-cell activation, because a failure to do so could explain the profound loss of cell number. The sequencing data reveal that, in fact, TLR7 messenger RNA is the most highly expressed endosomal TLR in healthy and WM samples (supplemental Figure 3). The expression of TLR7 messenger RNA was similar between healthy and WM cells, with WM cells expressing slightly lower levels. Moreover, the results indicate that TLR7 stimulation does indeed activate WM B cells. Stimulation of WM cells with R848 upregulates multiple genes associated with B-cell activation that are similarly upregulated in R848-stimulated healthy cells, including FOSB, JUND, IL2RA, and SDC1 (supplemental Figure 3). Having established that WM cells remain capable of being activated by TLR7 ligation, the failure of these cells to successfully differentiate/survive may be due to a perturbation of the genes associated with PC differentiation.
Indeed, WM cells demonstrated differential expression of multiple key genes within the PC-differentiation pathway compared with healthy cells. Differences in gene expression were apparent subsequent to both types of stimulation (Figure 6C). For WM cells stimulated with CD40L, fewer genes were significantly differentially expressed compared with WM samples activated with R848. WM cells exhibited decreased levels of PRDM1 (encoding the master regulator of PC differentiation BLIMP1), TNFRSF17 (encoding BCMA, which is important for PC survival), and POU2AF1; conversely, increased levels of BACH2, STAT3, and SPIB, which are associated with the B-cell program, were observed.37,38 This pattern supports previous phenotypic analysis and may explain the delay in differentiation that is sometimes observed in WM cells in comparison with their healthy counterparts.
A greater number of members of this pathway are perturbed in WM cells subsequent to R848 stimulation. IRF8, BACH2, SPIB, and MITF exhibit significantly increased expression, associated with repression of IRF4 and PRDM1, and indicative of an impediment to PC differentiation. The elevated levels of BACH2, SPIB, and IRF8 suggest that WM cells respond to activation but are then unable to progress beyond the preplasmablast state.
To highlight additional pathways that would be affected by the altered expression levels between the different samples and conditions, comparisons of differentially expressed genes were performed between and within the healthy and WM groups and subsequently analyzed using the Database for Annotation, Visualization and Integrated Discovery functional annotation tool. Components of 3 major pathways were upregulated among the WM samples compared with the healthy controls (Table 1). As expected, the NF-κB pathway was highlighted by the functional annotation tool. Cytokine signaling plays a key role in WM pathogenesis; mutations in CXCR4 are the most common after MYD88 and are central to the homing of WM cells to the bone marrow.39-41 Therefore, it is not surprising for components of these pathways to be upregulated. In particular, the chemokines CCR4, CCR7, and CCL5, as well as CXCR4 and multiple members of the tumor necrosis factor (TNF) family, are elevated in the WM samples. This is in accordance with the findings of Ngo et al,39 and such genes are characteristic of activated B cells.42
Biological pathways associated with differentially expressed genes between each sample group
| Upregulated | Downregulated | |
|---|---|---|
| Healthy R848 vs healthy CD40L | No significant pathways | Ribosome |
| Cytokine-cytokine receptor interaction | ||
| Metabolism/gluconeogenesis | ||
| Amino acid synthesis | ||
| All WM vs all healthy | MAPK signaling pathway | No significant pathways |
| NF-κB pathway | ||
| Cytokine-cytokine receptor interaction | ||
| WM CD40L vs healthy CD40L | Cytokine-cytokine receptor interaction | JAK-STAT signaling pathway |
| TNF signaling pathway | Endocytosis | |
| TLR signaling pathway | NK cell–mediated cytotoxicity | |
| NF-κB pathway | FOXO signaling pathway | |
| Apoptosis | Glycosaminoglycan biosynthesis | |
| Chemokine signaling pathway | ||
| WM R848 vs healthy R848 | Cell adhesion molecules/focal adhesion | Protein processing in ER |
| TNF signaling pathway | ||
| TLR signaling pathway | ||
| NF-κB pathway | ||
| Cytokine-cytokine receptor interaction | ||
| PI3K-AKT signaling | ||
| WM R848 vs WM CD40L | Antigen processing and presentation | Ribosome/ribosome biogenesis |
| NK cell–mediated cytotoxicity | Spliceosome | |
| ECM-receptor interaction | Cell cycle/DNA replication | |
| PI3K-AKT signaling pathway | Glycolysis | |
| Endocytosis | RNA transport/RNA degradation | |
| Choline metabolism in cancer | Purine/pyrimidine metabolism | |
| Leukocyte transendothelial migration | ||
| Regulation of actin cytoskeleton |
Comparisons of cell source and stimulation conditions are shown in the first column. Terms associated with genes that were upregulated or downregulated in the comparators indicated in bold are listed.
ECM, extracellular matrix; ER, endoplasmic reticulum; NK, natural killer; PI3K, phosphatidylinositol 3-kinase.
Many of the genes upregulated in WM cells compared with healthy cells following CD40L stimulation are consistent with previously documented WM transcriptomic analyses.43-45 Because the WM samples used for CD40L stimulations consisted of an equal number of wild-type and mutated CXCR4, the number of differentially expressed genes between the 2 groups was also evaluated. A total of 159 genes showed significant changes, and only 11 of which were upregulated in the CXCR4 mutated samples (supplemental Figure 4). In contrast to the results reported by Hunter et al,45 there did not appear to be any bias toward enhanced differentiation in the CXCR4 wild-type samples or a clear impact on TLR or MAPK signaling associated with CXCR4 mutations. The lack of concordance between the 2 sets of results may be largely dictated by the differentiation stage from which the material was obtained. However, GRN and LGALS3BP are among the shared genes that showed reduced levels in mutated CXCR4 samples; they exhibit similar patterns of expression during differentiation, with highest levels in mature PCs (supplemental Figure 4C). Both genes encode secreted proteins with a range of properties,46,47 and progranulin, in particular, has been linked to multiple myeloma cell survival and treatment resistance.48,49
As with the comparison of cells stimulated with CD40L, WM cells stimulated with R848 demonstrate elevated expression levels of genes associated with TLR and NF-κB signaling. Once again, WM cells demonstrate upregulation of numerous components involved in cell-cell interaction, but to an even greater extent than following CD40L stimulation. This suggests that the R848-stimulated WM cells are trapped at the activated B-cell state.
Discussion
WM is a heterogenous disease comprising malignant B cells and their more differentiated progeny. This study represents the first time that the differentiation of primary human WM B cells has been investigated, in an in vitro setting, in response to TD and TI stimuli. WM cells successfully generated PCs that were phenotypically identical to those from healthy individuals when provided with stimuli that mimics TD activation. However, in contrast to healthy individuals, approximately half of the WM samples also generated a novel population of CD38− PCs that have not been described previously. The relationship between these cells and the other phenotypic fractions generated by the SPADE algorithm suggests that these cells are more similar to plasmablasts on the cusp of becoming PCs than to traditional CD38+CD138− plasmablasts. Therefore, differentiation of WM cells may occur in a manner analogous to that of the model proposed by Avery and colleagues, in which memory cells generate CD38− and CD38+ plasmablast fractions subsequent to activation.50 The distinct nature of these cells may also reflect the aberrant gene expression pattern in purified ex vivo WM PCs, which appear to express a profile consistent with an intermediate stage between B cells and PCs.51 This fraction and the conventional CD38+CD138+ PCs generated by WM cells demonstrate an equivalent lifespan to those generated by healthy controls and represent a truly long-lived PC population, persisting in culture in excess of 40 days.
Research undertaken by 2 groups of investigators suggested that MYD88L265P-expressing cells still require TLR signals for proliferation and their continued survival.11,12 Therefore, the effect of TLR7 stimulation on WM cells was assessed to determine whether this translated into enhanced differentiation. In contrast to the expectation of improved survival, WM cells exhibited a profoundly deleterious response to R848.
RNA-seq established that WM cells are able to be activated by a combination of TLR7 and BCR signaling, yet the majority of these cells are unable to generate a PC population. This implies that there is a failure of downstream signaling to integrate the activation signal with the PC-differentiation pathway. Multiple essential regulators of PC differentiation appear to be dysregulated in WM cells stimulated with the TLR7 agonist. Central to differentiation is PRDM1, encoding BLIMP-1, termed the master regulator of PC differentiation because of its essential nature for this process. RNA-seq data confirmed that IRF4 and PRDM1 were significantly downregulated in WM cells stimulated with R848, whereas suppressors of these transcription factors, such as SPIB, BACH2, and MITF, were significantly upregulated. This provides a molecular explanation for the failure of R848-stimulated WM cells to generate PCs, despite retaining the capacity to do so following CD40L stimulation. Further testing using B cells from MYD88WT WM cases will help to confirm whether these effects are strictly related to the presence of the mutated form of MYD88.
It is possible that the chronic intrinsic activation of the TLR pathway via MYD88L265P in WM cells is inducing a state of TLR tolerance, rendering them unable to fully respond to TLR engagement and progress further down the differentiation pathway once they have been activated. However, because the cells are also in receipt of a concomitant BCR signal, this should be sufficient to overcome a refractory state.52 The further addition of CD40L to TLR7 and BCR signaling rescued the cells from an apoptotic fate and enabled them to successfully undergo differentiation. This observation suggests that the neoplastic clone requires multiple activation signals within the local environment to drive the characteristic IgM monoclonal gammopathy.
WM cells displayed a distinctive gene expression signature, with functional annotation software identifying the upregulation of numerous pathways involved in cell-cell interaction, cytokine production, and migration, all of which are indicators of engaging in a microenvironmental response. The bone marrow microenvironment clearly plays a central role in WM pathogenesis, as demonstrated by the efficacy of therapeutics inducing egress of neoplastic cells from the bone marrow.53-56 Moreover, accumulation of excess mast cells within the bone marrow is a characteristic feature of WM, with the presence of these cells often aiding differential diagnoses.57,58 The presence of mast cells has been demonstrated to promote the proliferation of the WM clone through CD40L-CD40 interaction.59 Based on the findings presented here, it is conceivable that the provision of CD40L by mast cells is also required to promote the conversion of WM B cells to IgM-secreting PCs.
In summary, the in vitro system represents a powerful tool for studying B-cell neoplasms. It is particularly useful for investigating WM because it enables analysis of the spectrum of B-cell differentiation, which is impossible in cell lines. An understanding of the bone marrow microenvironment is increasingly being recognized as an essential component for treating WM. Currently, a mouse model that sufficiently recapitulates this neoplasm does not exist60 ; thus, the flexibility of the in vitro system will enable superior modeling of the BM niche with patient-derived primary cells and allow further evaluation of the WM PC compartment, including the impact of molecular subtypes, such as CXCR4WHIM.
The data reported in this article have been deposited in the Gene Expression Omnibus database (accession number GSE139671).
Acknowledgments
The authors thank the University of Leeds Faculty of Medicine and Health Flow Cytometry and Next Generation Sequencing Facilities for technical support.
This work was supported by Bloodwise (Project Grant 13055), Waldenström’s Macroglobulinemia UK, the Ella Dickinson Memorial Charitable Trust, and Cancer Research UK (Programme Grant C7845/A17723).
Authorship
Contribution: J.S. designed the research, performed experiments, analyzed data, and wrote the manuscript; M.A.C. and J.C. analyzed data; C.E., K.W. and P.E. performed experiments and analyzed data; R.d.T. and R.O. provided clinical material, discussed results, and edited the manuscript; and R.M.T. and G.M.D. designed the research, analyzed data, and wrote the manuscript.
Conflict-of-interest disclosure: The authors declare no competing financial interests.
Correspondence: Gina M. Doody, Wellcome Trust Brenner Building, St James’s University Hospital, Leeds LS9 7TF, United Kingdom; e-mail: g.m.doody@leeds.ac.uk.

